
K. E. Frey1, J. C. Comiso2, L. W. Cooper3, J. M. Grebmeier3, and L. V. Stock2
1Graduate School of Geography, Clark University, Worcester, MA, USA
2Cryospheric Sciences Laboratory, Goddard Space Flight Center, NASA, Greenbelt, MD, USA
3Chesapeake Biological Laboratory, University of Maryland Center for Environmental Science, Solomons, MD, USA
Highlights
- Satellite estimates of ocean primary productivity (i.e., the rate at which marine algae transform dissolved inorganic carbon into organic material) showed higher values for 2021 (relative to the 2003-20 mean) for seven of the nine regions investigated across the Arctic.
- All regions continue to exhibit positive trends over the 2003-21 period, with the strongest trends in the Eurasian Arctic and Barents Sea.
- During May 2021, a ~1700 km long region from the Greenland Sea in the west to the eastern boundary of the Barents Sea showed much lower (10-20%) chlorophyll-a concentrations compared with the same month of the multiyear average (2003-20), likely associated with cooler than average sea surface temperatures.
Introduction
Autotrophic single-celled algae living in sea ice (ice algae) and the water column (phytoplankton) are the main primary producers in the Arctic Ocean, although there is also increased scientific interest in the role of marine macroalgae in the Arctic (e.g., kelp forests; Filbee-Dexter et al. 2019). Recent projections indicate that range expansions of non-polar, boreal kelps are likely, while endemic Arctic species may become much more limited in distribution as water temperatures increase (Goldsmit et al. 2021). Through photosynthesis, all of these autotrophs transform dissolved inorganic carbon into organic material. Consequently, primary production provides a key ecosystem service by providing energy to the entire food web in the oceans. Primary productivity is strongly dependent upon light availability and the presence of nutrients, and thus is highly seasonal in the Arctic. The melting and retreat of sea ice during spring are strong drivers of primary production in the Arctic Ocean and its adjacent shelf seas, owing to enhanced light availability and stratification (Ardyna et al. 2017). Recent studies have emphasized that primary production occurs earlier in the season than previously recognized and even under unusually low light conditions (Randelhoff et al. 2020). Other studies suggest that increased nutrient supply has also influenced overall production (Henley et al. 2020; Lewis et al. 2020), although there are indications that increases in nutrients and primary production are not universal across the Arctic (Yun et al. 2016). In addition to upwelling of nutrients, high winds and glacial runoff are regionally important in helping to drive Arctic marine productivity (Crawford et al. 2020; Hopwood et al. 2020). While declines in Arctic sea ice extent (see essay on Sea Ice) and increases in seawater temperatures (see essay on Sea Surface Temperature) over the past several decades have contributed substantially to shifts in primary productivity throughout the Arctic Ocean, the response of primary production to sea ice loss has varied both seasonally and spatially (e.g., Hill et al. 2018).
Chlorophyll-a
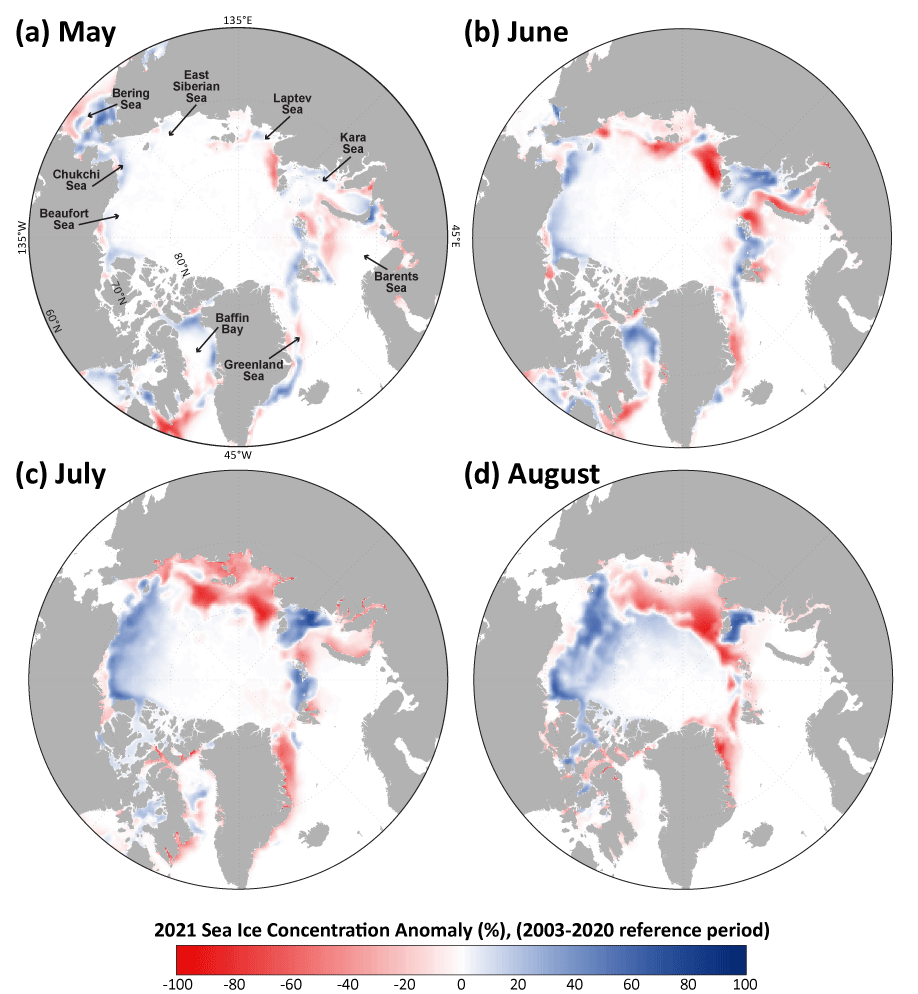
Here we present satellite-based estimates of algal chlorophyll-a (occurring in all species of phytoplankton), based on ocean color, and subsequently provide calculated primary production estimates. These results are shown for ocean areas with less than 10% sea ice concentration and, therefore, do not include production by sea ice algae or under-ice phytoplankton blooms, which can be significant (e.g., Lalande et al. 2019; Kim et al. 2021). The data presented in Fig. 1 show mean monthly ratios of chlorophyll-a concentrations for 2021 as percentages of the multiyear average from 2003 to 2020. Observed patterns, which are spatially and temporally heterogeneous across the Arctic Ocean, are often associated with the timing of the seasonal break-up and retreat of the sea ice cover (Fig. 2) (see essay on Sea Ice): high percentages tend to occur in regions where the break-up is relatively early, while low percentages tend to occur in regions where the break-up is delayed. Some of the most notable patterns in 2021 occurred in the Barents Sea, with widespread lower-than-average concentrations of chlorophyll-a in May (Fig. 1a) and several pockets of higher-than-average concentrations in June and July (Figs. 1b and 1c), linked with relatively cool sea surface temperatures across the region in May that may have delayed the spring phytoplankton bloom. In particular, this regional low in May chlorophyll-a concentrations extended ~1700 km from the Greenland Sea in the west to the eastern boundary of the Barents Sea. Additional lower-than-average chlorophyll-a concentrations occurred in the northern Bering Sea during May and June (Figs. 1a and 1b) associated with an above-average sea ice cover (Fig. 2a), as well as in the Kara Sea during July and August (Figs. 1c and 1d). Higher-than-average chlorophyll-a concentrations occurred in the Barents Sea during June and July (as noted above; Figs. 1b and 1c); the Laptev Sea, Baffin Bay, and Greenland Sea during July and August (Figs. 1c and 1d); and the northern Bering and Beaufort Seas during August (Fig. 1d).
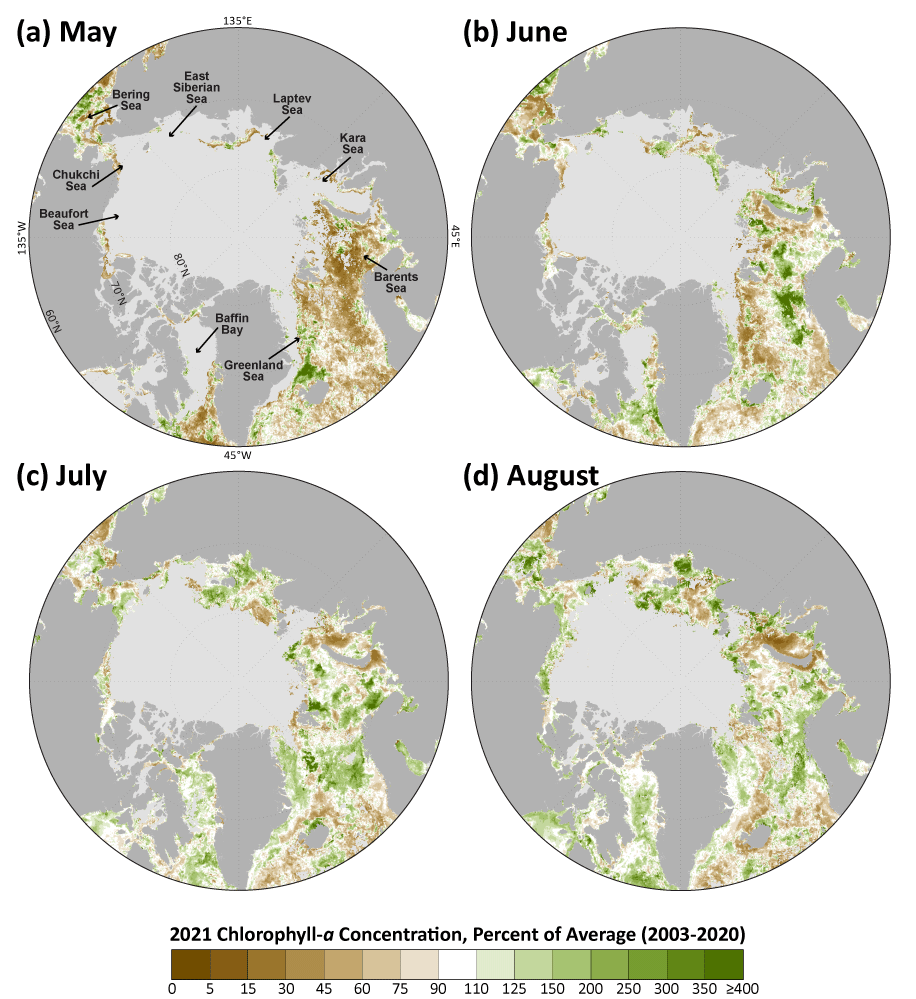
While many of these observed patterns in chlorophyll-a concentrations are directly linked to sea ice variability (and therefore light availability), there are other important factors at play that add to the complexity of observed chlorophyll-a concentrations, such as seawater temperatures, the distribution and availability of nutrients (e.g., Rijkenberg et al. 2018; Giesbrecht et al. 2019; Lewis et al. 2020), and sea surface salinity (Garcia-Eidell et al. 2021). The impacts of sea ice decline on specific water column phytoplankton properties, such as community composition and carbon biomass (Neeley et al. 2018) as well as broader ecosystem responses (Duffy-Anderson et al. 2019), are also critical to monitor as we continue to understand the responses of Arctic marine food web dynamics to climate warming. Furthermore, it is important to reiterate that the satellite ocean color data do not account for early-season under-ice blooms that may contribute substantially to annual primary productivity estimates in these regions (e.g., Ardyna et al. 2020). Furthermore, under stratified conditions, it is well known that satellite observations can underestimate production when a deep chlorophyll maximum is present (see recent review by Bouman et al. 2021). The variable distribution of sediments and chromophoric dissolved organic matter (CDOM), owing to riverine delivery (Lewis et al. 2016) (see essay on River Discharge) and sea ice dynamics (Logvinova et al. 2016, Hölemann et al. 2021), can also affect the accuracy of satellite-based estimations of chlorophyll-a and primary productivity in Arctic waters. As such, in situ observations will continue to be important to provide overall context for changes to and drivers of primary productivity across Arctic marine ecosystems. For example, deployment of a new sediment trap array (together with a mooring array) in the northern Bering Sea in autumn 2020 should help to improve understanding of seasonal carbon production and export in this region, just as new year-round results reported from the Chukchi Ecosystem Observatory in the northern Chukchi Sea (Lalande et al. 2020) and across the Distributed Biological Observatory in the Pacific Arctic (Lalande et al. 2021) have improved understanding of annual production.
Primary production
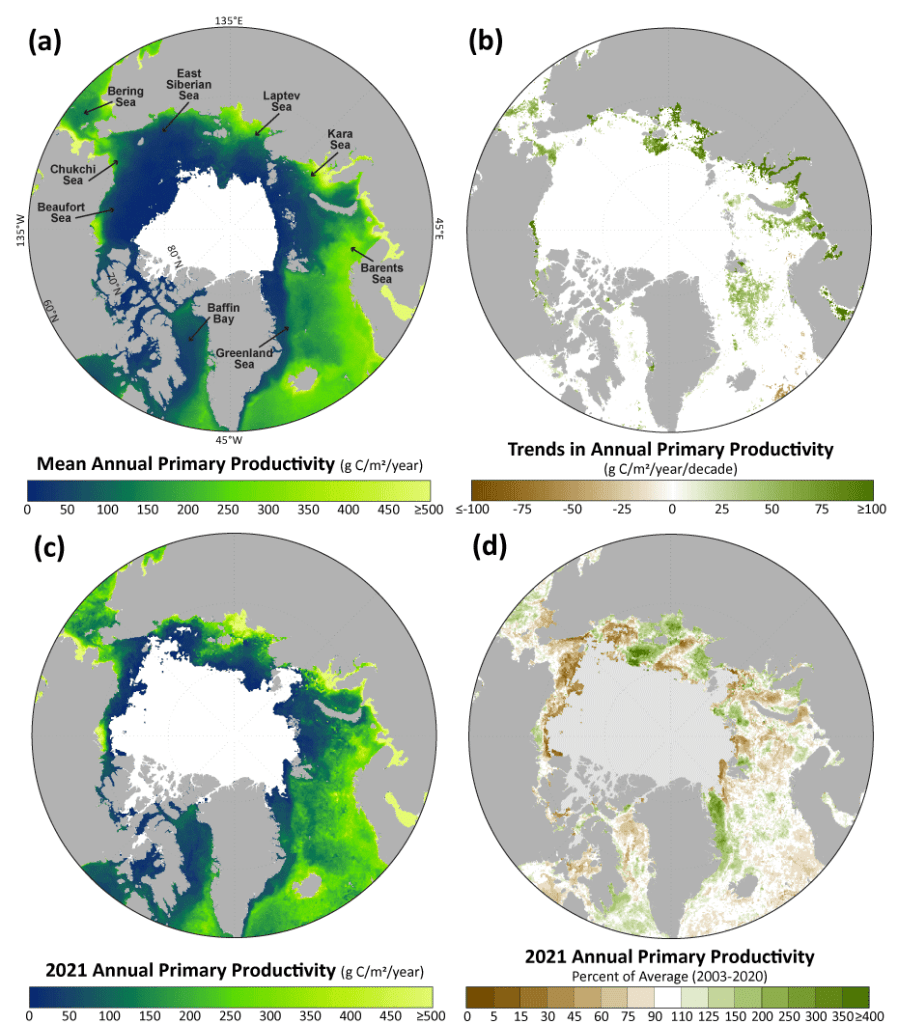
Chlorophyll-a concentrations give an estimate of the total standing stock of algal biomass. However, rates of primary production (i.e., the production of organic carbon via photosynthesis) provide a different perspective since not all algae present in the water column are necessarily actively producing. The mean annual primary productivity across the Arctic shows important spatial patterns, most notably the overall decreases moving northward as sea ice cover is present for a greater fraction of the year (Fig. 3a). Spatial trends in annual primary productivity (Fig. 3b) are a particularly useful tool for understanding hotspots of change. Statistically significant positive trends are primarily clustered in the Bering/Chukchi, Laptev, Barents, and Greenland Seas. Those trends that are positive and the largest are located in the Laptev Sea, reaching into the 100-150 g C/m2/yr/decade range (Fig. 3b). This is consistent with the Eurasian Arctic region as a whole, which exhibited the greatest increases in primary productivity compared to all other Arctic regions (Fig. 4, Table 1). Investigation of 2021 annual primary productivity (Fig. 3c), as well as 2021 compared to the 2003-20 average (Fig. 3d), shows greater-than-average annual productivity in the western Greenland and northern Bering Seas, but lower-than-average annual productivity in the Beaufort and Chukchi Seas as well as localized areas throughout the Arctic region. The Laptev Sea shows subregions of both greater-than-average and lower-than-average annual primary productivity, which is also similarly reflected in spatial heterogeneity of chlorophyll-a concentrations during July (Fig. 1c) and August (Fig. 1d).
| 2003-21 | 2021 | ||||
|---|---|---|---|---|---|
| Region | Trend (g C/m2/yr/decade) |
Mann-Kendall p-value |
% Change | Anomaly (g C/m2/yr) from a 2003-20 reference period |
Primary Productivity (% of the 2003-20 average) |
| Eurasian Arctic | 38.45 | 0.001 | 59.5 | 29.72 | 119.9 |
| Amerasian Arctic | 6.66 | 0.238 | 14.9 | 9.31 | 110.8 |
| Sea of Okhotsk | 9.14 | 0.332 | 7.3 | 32.80 | 114.2 |
| Bering Sea | 12.27 | 0.164 | 13.7 | 20.44 | 111.9 |
| Barents Sea | 24.42 | 0.001 | 24.0 | -2.47 | 98.8 |
| Greenland Sea | 10.51 | 0.093 | 12.1 | -2.71 | 98.4 |
| Hudson Bay | 7.70 | 0.368 | 13.4 | 11.50 | 110.5 |
| Baffin Bay/Labrador Sea | 11.73 | 0.041 | 15.7 | 17.66 | 112.3 |
| North Atlantic | 17.09 | 0.019 | 14.4 | 22.07 | 109.7 |
| Average of nine regions | 15.33 | 0.000 | 18.1 | 15.37 | 109.3 |
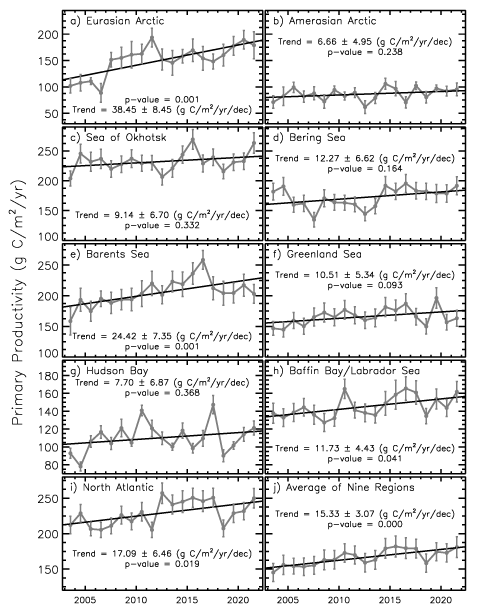
Estimates of ocean primary productivity for nine regions and across the Northern Hemisphere (relative to the 2003-20 reference period) were assessed (Fig. 4, Table 1). The Eurasian Arctic designation includes the Kara Sea, Laptev Sea, and East Siberian Sea. The Amerasian Arctic designation includes the Chukchi Sea, Beaufort Sea, and Canadian Archipelago region. The North Atlantic region in this categorization is south of 60° N and east of 45° W, and as such is not inclusive of the Labrador or Greenland Seas. Our results show above average primary productivity for 2021 in seven of the nine regions investigated; only the Barents and Greenland Seas exhibit lower-than-average values (Fig. 4, Table 1). Across the whole time series, positive trends in primary productivity occurred in all regions during the 2003-21 period. Statistically significant positive trends occurred in the Eurasian Arctic, Barents Sea, Baffin Bay/Labrador Sea, North Atlantic, as well as on average for the nine regions. The steepest trends over the 2003-21 period were in the Eurasian Arctic (a ~59.5% overall increase) and the Barents Sea (a ~24.0% overall increase). In summary, while observations of primary productivity have shown complex interannual and spatial patterns over the 2003-21 period, we observe overall increasing trends across all sectors of the Arctic Ocean.
Methods and data
Measurements of the algal pigment chlorophyll (specifically, chlorophyll-a) serve as a proxy for the amount of algal biomass present in the ocean (e.g., Behrenfeld and Boss 2006) as well as overall plant health. The complete, updated Moderate Resolution Imaging Spectroradiometer (MODIS)-Aqua satellite record of chlorophyll-a concentrations within northern polar waters for the years 2003-21 serves as a time series against which individual years can be compared. Satellite-based chlorophyll-a data across the pan-Arctic region were derived using the MODIS-Aqua Reprocessing 2018.0, chlor_a algorithm: https://oceancolor.gsfc.nasa.gov/. For this reporting, we show mean monthly chlorophyll-a concentrations calculated as a percentage of the 2003-20 average, which was chosen as the reference period in order to maximize the length of the satellite-based time series. Satellite-based sea ice concentrations were derived from the Special Sensor Microwave/Imager (SSM/I) and Special Sensor Microwave Imager/Sounder (SSMIS) passive microwave instruments, calculated using the Goddard Bootstrap (SB2) algorithm (Comiso et al. 2017). Monthly sea ice concentration anomalies were additionally calculated for 2021 (compared to the 2003-20 average) in order to streamline comparisons with the variability in monthly chlorophyll-a satellite data. Primary productivity data were derived using chlorophyll-a concentrations from MODIS-Aqua data, the NOAA 1/4° daily Optimum Interpolation Sea Surface Temperature Version 2 dataset (or daily OISSTv2) that uses satellite sea surface temperatures from AVHRR, incident solar irradiance, mixed layer depths, and additional parameters. Primary productivity values were calculated based on the techniques described by Behrenfeld and Falkowski (1997). Chlorophyll-a and primary productivity data only incorporate pixels where sea ice is less than 10%, which is a compromise between potential pixel contamination with sea ice and an attempt to incorporate open water near the ice edge that typically exhibits high rates of primary production. We define annual productivity as productivity over the March-September time period. The 2021 annual primary productivity percent of average (compared to 2003-20) was calculated the same way as for chlorophyll-a, as described above. Lastly, Theil-Sen median trends were calculated spatially (Fig. 3b) and for the extracted time series for each geographic region (Table 1), where statistical significance (p<0.05) of the trends was determined using the Mann-Kendall trend test.
An erratum for past Arctic Report Card (ARC) primary production essays (2015-2020) can be found here. This erratum identifies how the algorithm that produced primary production data for these years incorrectly incorporated sea surface temperatures, and presents a comparison of the previously reported data with corrected updated data.
Acknowledgments
K. Frey would like to acknowledge financial support by the National Science Foundation (NSF) Arctic Observing Network (AON) Program (Grant 1917434). J. Comiso and L. Stock are also grateful for the support provided by the NASA Ocean Biology and Biogeochemistry Program. Support for J. Grebmeier and L. Cooper is provided through NSF AON (Grant 1917469) and the NOAA Arctic Research Program (CINAR 22309.07_UMCES_Grebmeier).
References
Ardyna, M., M. Babin, E. Devred, A. Forest, M. Gosselin, P. Raimbault, and J. -É. Tremblay, 2017: Shelf-basin gradients shape ecological phytoplankton niches and community composition in the coastal Arctic Ocean (Beaufort Sea). Limnol. Oceanogr., 62, 2113-2132, https://doi.org/10.1002/lno.10554.
Ardyna, M., and Coauthors, 2020: Under-ice phytoplankton blooms: Shedding light on the “invisible” part of Arctic primary production. Front. Mar. Sci., 7, 608032, https://doi.org/10.3389/fmars.2020.608032.
Behrenfeld, M. J., and E. Boss, 2006: Beam attenuation and chlorophyll concentration as alternative optical indices of phytoplankton biomass. J. Mar. Res., 64, 431-451, https://doi.org/10.1357/002224006778189563.
Behrenfeld, M. J., and P. G. Falkowski, 1997: Photosynthetic rates derived from satellite-based chlorophyll concentration. Limnol. Oceanogr., 42(1), 1-20, https://doi.org/10.4319/lo.1997.42.1.0001.
Bouman, H. A., T. Jackson, S. Sathyendranath, and T. Platt, 2020: Vertical structure in chlorophyll profiles: influence on primary production in the Arctic Ocean. Philos. Trans. Roy. Soc. A, 378, 20190351, https://doi.org/10.1098/rsta.2019.0351.
Comiso, J. C., 2015: Variability and trends of the global sea ice covers and sea level: Effects on physicochemical parameters. Climate and Fresh Water Toxins, L. M. Botana, M. C. Lauzao, and N. Vilarino, Eds., De Gruyter, Berlin, Germany, https://doi.org/10.1515/9783110333596-003.
Comiso, J. C., W. N. Meier, and R. Gersten, 2017: Variability and trends in the Arctic Sea ice cover: Results from different techniques. J. Geophys. Res.-Oceans, 122, 6883-6900, https://doi.org/10.1002/2017JC012768.
Crawford, A. D., K. M. Krumhardt, N. S. Lovenduski, G. L. Van Dijken, and K. R. Arrigo, 2020: Summer high-wind events and phytoplankton productivity in the Arctic Ocean. J. Geophys. Res.-Oceans, 125, e2020JC016565, https://doi.org/10.1029/2020jc016565.
Duffy-Anderson, J. T., and Coauthors, 2019: Responses of the northern Bering Sea and southeastern Bering Sea pelagic ecosystems following record-breaking low winter sea ice. Geophys. Res. Lett., 46, 9833-9842, https://doi.org/10.1029/2019GL083396.
Filbee-Dexter, K., T. Wernberg, S. Fredriksen, K. M. Norderhaug, and M. F. Pedersen, 2019: Arctic kelp forests: Diversity, resilience and future. Global Planet. Change, 172, 1-14, https://doi.org/10.1016/j.gloplacha.2018.09.005.
Garcia-Eidell, C., J. C. Comiso, M. Berkelhammer, and L. Stock, 2021: Interrelationships of sea surface salinity, chlorophyll-a concentration, and sea surface temperature near the Antarctic ice edge. J. Climate, 34(15), 6069-6086, https://doi.org/10.1175/JCLI-D-20-0716.1.
Giesbrecht, K. E., D. E. Varela, J. Wiktor, J. M. Grebmeier, B. Kelly, and J. E. Long, 2019: A decade of summertime measurements of phytoplankton biomass, productivity and assemblage composition in the Pacific Arctic Region from 2006 to 2016. Deep-Sea Res. Pt. II, 162, 93-113, https://doi.org/10.1016/j.dsr2.2018.06.010.
Goldsmit, J., and Coauthors, 2021: Kelp in the eastern Canadian Arctic: Current and future predictions of habitat suitability and cover. Front. Mar. Sci., 18, 742209, https://doi.org/10.3389/fmars.2021.742209.
Henley, S. F., M. Porter, L. Hobbs, J. Braun, R. Guillaume-Castel, E. J. Venables, E. Dumont, and F. Cottier, 2020: Nitrate supply and uptake in the Atlantic Arctic sea ice zone: seasonal cycle, mechanisms and drivers. Philos. T. Roy. Soc. A, 378(2181), 20190361, http://doi.org/10.1098/rsta.2019.0361.
Hill, V., M. Ardyna, S. H. Lee, and D. E. Varela, 2018: Decadal trends in phytoplankton production in the Pacific Arctic Region from 1950 to 2012. Deep-Sea Res. Pt. II, 152, 82-94, https://doi.org/10.1016/j.dsr2.2016.12.015.
Hölemann, J. A., B. Juhls, D. Bauch, M. Janout, B. P. Koch, and B. Heim, 2021: The impact of the freeze-melt cycle of land-fast ice on the distribution of dissolved organic matter in the Laptev and East Siberian Seas (Siberian Arctic). Biogeosciences, 18, 3637-3655, https://doi.org/10.5194/bg-18-3637-2021.
Hopwood, M. J., and Coauthors, 2020: Review article: How does glacier discharge affect marine biogeochemistry and primary production in the Arctic? Cryosphere, 14, 1347-1383, https://doi.org/10.5194/tc-14-1347-2020.
Kim, H. -J., and Coauthors, 2021: Temporal and spatial variations in particle fluxes on the Chukchi Sea and East Siberian Sea slopes from 2017 to 2018. Front. Mar. Sci., 7, 609748, https://doi.org/10.3389/fmars.2020.609748.
Lalande, C., J. M. Grebmeier, R. R. Hopcroft, and S. L. Danielson, 2020: Annual cycle of export fluxes of biogenic matter near Hanna Shoal in the northeast Chukchi Sea. Deep-Sea Res. Pt. II, 177, 104730, https://doi.org/10.1016/j.dsr2.2020.104730.
Lalande, C., J. M. Grebmeier, A. M. P. McDonnell, R. R. Hopcroft, S. O’Daly, and S. L. Danielson, 2021: Impact of a warm anomaly in the Pacific Arctic region derived from time-series export fluxes. PLoS ONE, 16(8), e0255837, https://doi.org/10.1371/journal.pone.0255837.
Lalande, C., E. -M. Nöthig, and L. Fortier, 2019: Algal export in the Arctic Ocean in times of global warming. Geophys. Res. Lett., 46, 5959-5967, https://doi.org/10.1029/2019gl083167.
Lewis, K. M., B. G. Mitchell, G. L. van Dijken, and K. R. Arrigo, 2016: Regional chlorophyll a algorithms in the Arctic Ocean and their effect on satellite-derived primary production estimates. Deep-Sea Res. Pt. II, 130, 14-27, https://doi.org/10.1016/j.dsr2.2016.04.020.
Lewis, K. M., G. L. van Dijken, and K. R. Arrigo, 2020: Changes in phytoplankton concentration now drive increased Arctic Ocean primary production. Science, 369, 198-202, https://doi.org/10.1126/science.aay8380.
Logvinova, C. L., K. E. Frey, and L. W. Cooper, 2016: The potential role of sea ice melt in the distribution of chromophoric dissolved organic matter in the Chukchi and Beaufort Seas. Deep-Sea Res. Pt. II, 130, 28-42, https://doi.org/10.1016/j.dsr2.2016.04.017.
Neeley, A. R., L. A. Harris, and K. E. Frey, 2018: Unraveling phytoplankton community dynamics in the northern Chukchi Sea under sea-ice-covered and sea-ice-free conditions. Geophys. Res. Lett., 45, 7663–7671, https://doi.org/10.1029/2018GL077684.
Randelhoff, A., and Coauthors, 2020: Arctic mid-winter phytoplankton growth revealed by autonomous profilers. Sci. Adv., 6, eabc2678, https://doi.org/10.1126/sciadv.abc2678.
Rijkenberg, M. J., H. A. Slagter, M. Rutgers van der Loeff, J. van Ooijen, and L. J. A. Gerringa, 2018: Dissolved Fe in the deep and upper Arctic Ocean with a focus on Fe limitation in the Nansen Basin. Front. Mar. Sci., 5, 88, https://doi.org/10.3389/fmars.2018.00088.
Yun, M. S., and Coauthors, 2016: Primary production in the Chukchi Sea with potential effects of freshwater content. Biogeosciences, 13, 737-749, https://doi.org/10.5194/bg-13-737-2016.
November 22, 2021