

R. M. Holmes1, A. I. Shiklomanov2,3, A. Suslova1, M. Tretiakov3, J. W. McClelland4, L. Scott1, R. G. M. Spencer5, and S. E. Tank6
1Woodwell Climate Research Center, Falmouth, MA, USA
2University of New Hampshire, Durham, NH, USA
3Arctic and Antarctic Research Institute, St. Petersburg, Russia
4Marine Science Institute, University of Texas at Austin, Port Aransas, TX, USA
5Florida State University, Tallahassee, FL, USA
6University of Alberta, Edmonton, AB, Canada
Highlights
- In 2021, the combined discharge (January through October) from the six Eurasian rivers was 1850 km3, which was 81 km3 or ~5% greater than during the 1981-2010 reference period.
- In 2020, the combined discharge of the eight largest Arctic rivers was 2623 km3, ~12% greater than the average over the 1981-2010 reference period.
- In 2019, the combined discharge of the eight largest Arctic rivers was 2233 km3, 5% less than the 1981-2010 average.
- In 2020, an extraordinarily high May discharge from Eurasian rivers of 443 km3 (96% above average) was followed by an extraordinarily low June discharge of 432 km3 (21% below average), indicating a shift of the freshet to earlier in the season.
- The long-term observations for Eurasian and North American Arctic river discharges demonstrate an upward trend, providing evidence for the intensification of the Arctic hydrologic cycle.
Introduction
Arctic river discharge is a key indicator reflecting changes in the hydrologic cycle associated with widespread environmental change in the Arctic. It is the most accurately measured component of the Arctic water cycle (Shiklomanov et al. 2006). Records of Arctic river discharge since the early 1930s reveal a long-term increase of freshwater flux to the Arctic Ocean, providing compelling evidence of intensification of the Arctic water cycle (Peterson et al. 2002; McClelland et al. 2006). This hydrologic and associated biogeochemical change has significant ramifications for the Arctic Ocean, which contains only about 1% of global ocean water yet receives 11% of the global river discharge (Aagaard and Carmack 1989; McClelland et al. 2012).
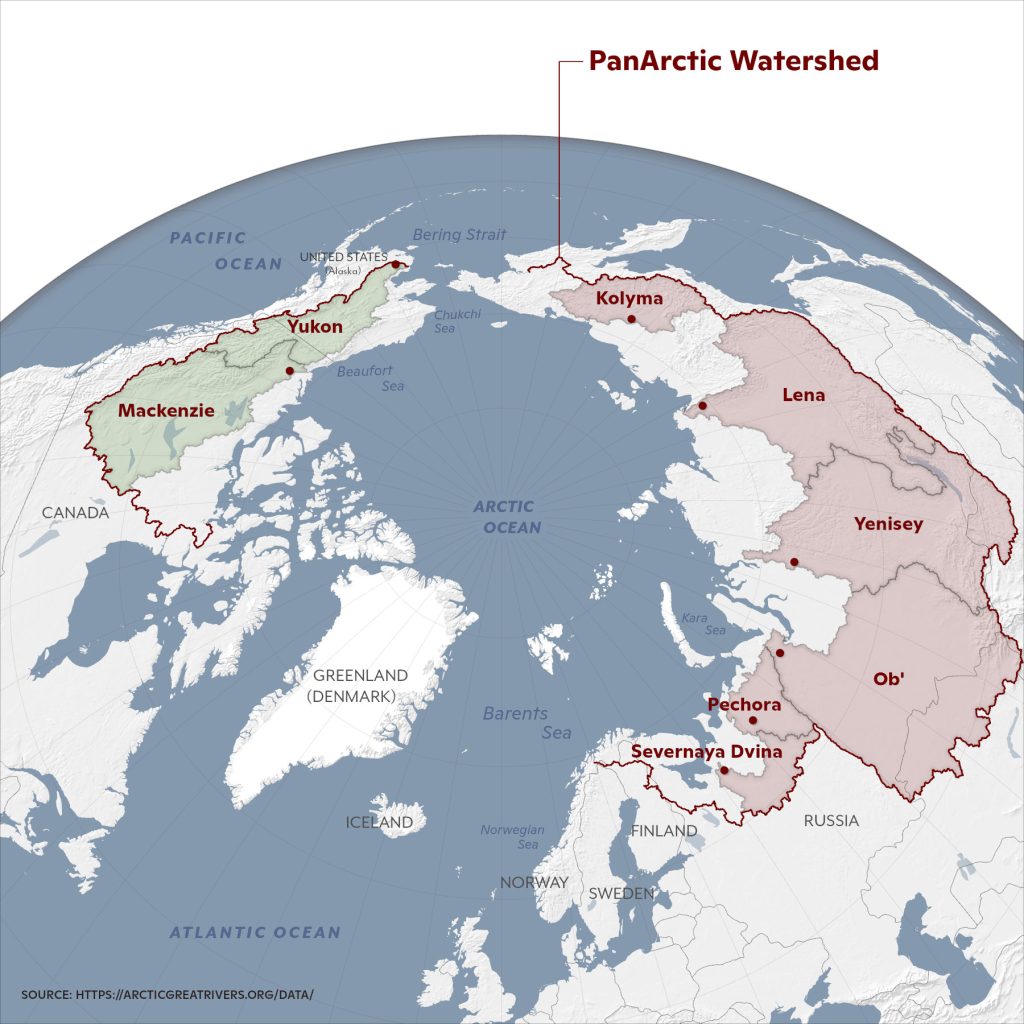
Of the eight largest Arctic rivers by annual discharge, six lie in Eurasia (Kolyma, Yenisey, Lena, Ob’, Pechora, and Severnaya Dvina) and two are in North America (Mackenzie and Yukon). Collectively, the watersheds of these eight rivers cover approximately 70% of the pan-Arctic drainage area and account for the majority of river water input to the Arctic Ocean (Fig. 1). In this report we present river discharge values for these eight rivers for 2019 and 2020, and for the Eurasian portion of these same rivers for the first ten months of 2021, updating the 2018 Arctic Report Card (Holmes et al. 2018). 2021 data are not available for the two North American rivers at the time of this report. Here, we use a common baseline period of 1981-2010 to compare and contextualize recent observations.
Discharge records
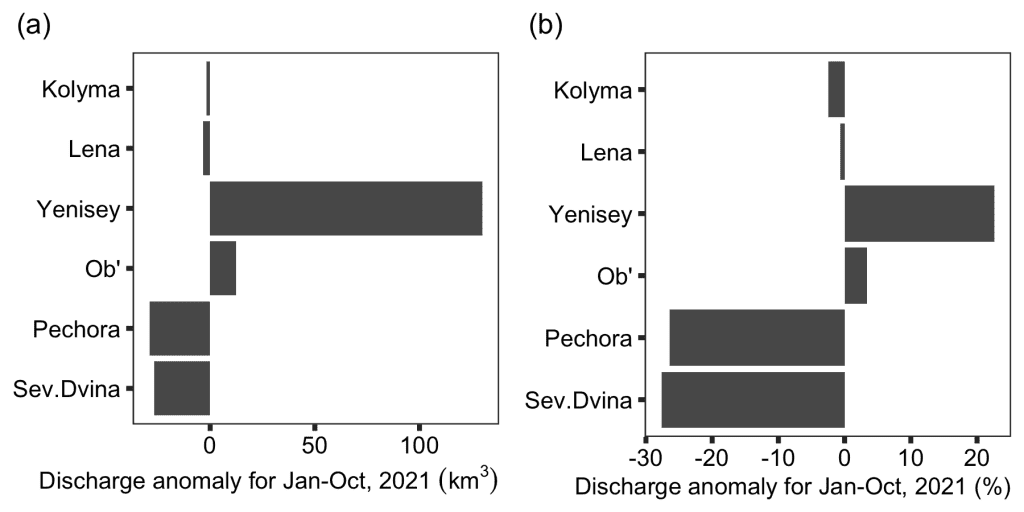
In 2021, the combined discharge (January through October) from the six Eurasian rivers was 1850 km3, which was 81 km3 or ~5% greater than during 1981-2010 reference period. The majority of this increase was driven by the Yenisey River. The Pechora and Severnaya Dvina showed below average discharge, 26% and 28%, respectively (Fig. 2).
In 2020, the combined annual discharge of the eight largest Arctic rivers was 2623 km3, which was 272 km3 or ~12% greater than the 30-year average. This increase is greater than the annual average discharge of the Yukon River. Discharge from the two North American rivers combined was 630 km3, ~28% greater than their 1981-2010 average. Discharge from the six Eurasian rivers combined was 1992 km3, ~7% greater than the average over the 1981-2010 reference period, or ~10% greater than average for whole period of record from 1936 to 2020 (Table 1).
| River Basin | |||||||||
|---|---|---|---|---|---|---|---|---|---|
| Year | Yukon | Mackenzie | S. Dvina | Pechora | Ob’ | Yenisey | Lena | Kolyma | SUM |
| 2020 | 251 | 379 | 152 | 116 | 464 | 620 | 581 | 59 | 2623 |
| 2019 | 210 | 236 | 122 | 146 | 437 | 557 | 463 | 63 | 2233 |
| Average 1981-2010 | 205 | 288 | 104 | 114 | 398 | 612 | 557 | 70 | 2348 |
| All time average | 206 | 286 | 101 | 110 | 404 | 586 | 541 | 73 | 2307 |
High annual discharge of the North American rivers in 2020 was primarily driven by the high discharge values in July, August, and September (+2.1, +2.6, +2.8 std. dev. above average, respectively; Fig. 3). This is attributed to an unusually wet summer, the wettest summer since 1985 based on analysis of precipitation aggregated over the Mackenzie and Yukon watersheds (Hersbach et al. 2020).
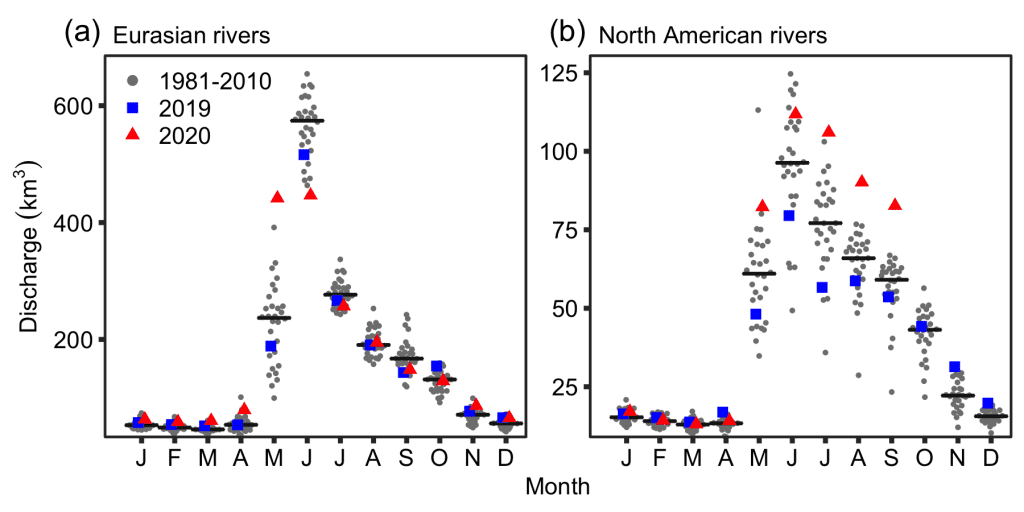
For the Eurasian rivers in 2020, extraordinarily high May discharge (+3.1 std. dev. above average) was followed by extraordinarily low June discharge (-2.3 std. dev. below average; Fig. 3). This pattern observed across the Eurasian rivers is consistent with the observed high terrestrial snow cover and snow water equivalent during winter 2019/20, followed by a remarkably warm spring in 2020 (Ballinger et al. 2020; Mudryk et al. 2020). This led to an early melt of a large snowpack, shifting more of the freshet runoff period from June to May. Discharge for May and June combined was 13% higher in 2020 compared to the baseline period.
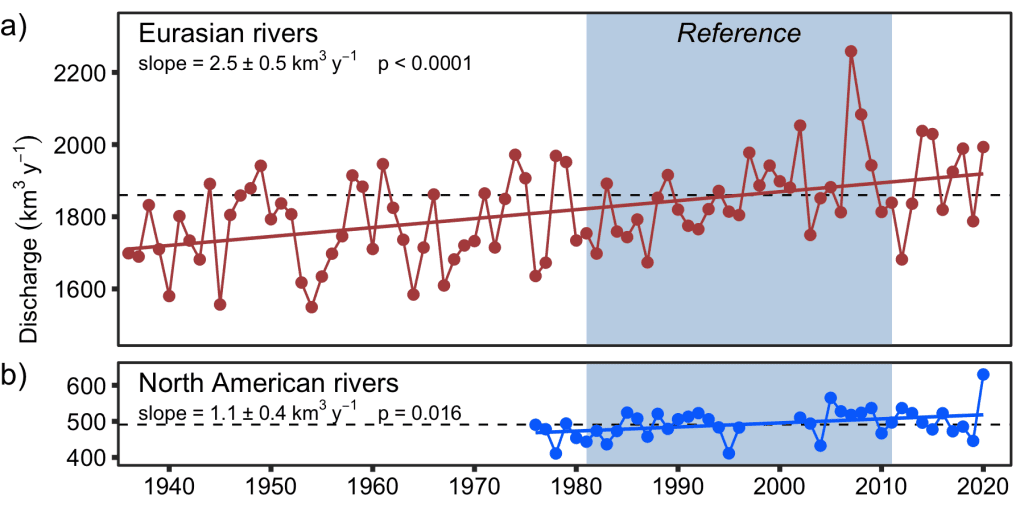
In contrast to 2020, 2019 was a relatively low-discharge year. The combined discharge of the eight largest Arctic rivers was 2233 km3, 118 km3 or 5% less than the 1981-2010 average (Fig. 4). Discharge from the two North American rivers and the six Eurasian rivers was ~9% and ~4% less than average, respectively.
Low annual discharge in 2019 from the North American rivers was driven by low May, June, and July discharge (-0.8, -0.9, -1.4 std. dev. below average, respectively; Fig. 3). Similarly, Eurasian rivers had lower than average discharge in May and June (-0.5, -0.9 std. dev. below average, respectively; Fig. 3). These low summer discharge observations are consistent with the below-average snow water equivalent in April 2019 in both the Eurasian and North American Arctic (Mudryk et al. 2019).
The 85-year time series available for the Eurasian Arctic rivers demonstrates a positive linear trend. Their combined annual discharge is increasing by 2.5 km3 per year. For the North American Arctic rivers, the increase over the period of record (1976-2020) was 1.1 km3 per year (Fig. 4). These long-term observations indicate that Arctic river discharge continues to trend upward, providing powerful evidence for the intensification of the Arctic hydrologic cycle (Shiklomanov et al. 2021).
Methods and data
Discharge values are based on observational discharge data from the downstream-most stations listed in Table 2. Discharge measurements for the six Eurasian rivers began in 1936, whereas discharge measurements did not begin until 1973 for the Mackenzie River and 1976 for the Yukon River. Discharge data for the Kolyma at Srednekolymsk are not available for 2019 and 2020; they were calculated based on monthly correlations with the next downstream station, the Kolyma at Kolymskoe. Average monthly values for 1978-2001 were used to calculate the correction factor. The Yukon is missing discharge values from October-December 2020. We therefore used long-term average values for those three months, which account for less than 17% of the mean annual discharge. All discharge data reported here are available through the Arctic Great Rivers Observatory at arcticgreatrivers.org/discharge/.
| River | Station Location | Station Code | Latitude (°) | Longitude (°) | Catchment Area (km2) |
|---|---|---|---|---|---|
| Kolyma | Srednekolymsk | 1801 | 67.47 | 153.69 | 361000 |
| Lena | Kusur | 3821 | 70.68 | 127.39 | 2430000 |
| Yenisey | Igarka | 9803 | 67.43 | 86.48 | 2440000 |
| Ob’ | Salehard | 11808 | 66.63 | 66.60 | 2950000 |
| Pechora | Ust’ Tsilma | 70850 | 65.42 | 52.28 | 248000 |
| Severnaya Dvina | Ust’ Pinega | 70801 | 64.13 | 41.92 | 348000 |
| Mackenzie | Arctic Red River | 10LC014 | 67.45 | -133.74 | 1750600 |
| Yukon | Pilot Station | 15565447 | 61.93 | -162.88 | 831391 |
Acknowledgments
We thank the United States Geological Survey (Yukon), Water Survey of Canada (Mackenzie) and Roshydromet (Severnaya Dvina, Pechora, Ob’, Yenisey, Lena, and Kolyma) for the discharge data used here. This work was supported by grants from the National Science Foundation in support of the Arctic Great Rivers Observatory (NSF 1602615, 1603149, 1602680, 1602879). The processing and analysis of near-real time data for Russian Arctic rivers were supported in part by the Russian Foundation for Basic Research (grant 18-05-60192).
References
Aagaard, K., and E. C. Carmack, 1989: The role of sea ice and other fresh water in the Arctic circulation. J. Geophys. Res., 94(C10), 14485-14498, https://doi.org/10.1029/jc094ic10p14485.
Ballinger, T. J., and Coauthors, 2020: Surface air temperature. Arctic Report Card 2020, R. L. Thoman, J. Richter-Menge, and M. L. Druckenmiller, Eds., https://doi.org/10.25923/gcw8-2z06.
Hersbach, H., and Coauthors, 2020: The ERA5 global reanalysis. Q. J. Roy. Meteor. Soc., 146, 1999-2049, https://doi.org/10.1002/qj.3803.
Holmes, R. M., A. I. Shiklomanov, A. Suslova, M. Tretiakov, J. W. McClelland, R. G. Spencer, and S.E. Tank, 2018: River discharge. Arctic Report Card 2018, E. Osborne, J. Richter-Menge, and M. Jeffries, Eds., https://doi.org/10.25923/krcx-z320.
McClelland, J. W., S. J. Déry, B. J. Peterson, R. M. Holmes, and E. F. Wood, 2006: A pan-arctic evaluation of changes in river discharge during the latter half of the 20th century. Geophys. Res. Lett., 33(6), L06715, https://doi.org/10.1029/2006gl025753.
McClelland, J. W., R. M. Holmes, K. H. Dunton, and R. W. Macdonald, 2011: The Arctic Ocean estuary. Estuaries Coasts, 35(2), 353-368, https://doi.org/10.1007/s12237-010-9357-3.
Mudryk, L., R. Brown, C. Derksen, K. Luojus, B. Decharme, and S. Helfrich, 2019: Terrestrial snow cover. Arctic Report Card 2019, J. Richter-Menge, M. L. Druckenmiller, and M. Jeffries, Eds., https://doi.org/10.25923/bw4d-my28.
Mudryk, L., A. Elias Chereque, R. Brown, C. Derksen, K. Luojus, and B. Decharme, 2020: Terrestrial snow cover. Arctic Report Card 2020, R. L. Thoman, J. Richter-Menge, and M. L. Druckenmiller, Eds., https://doi.org/10.25923/p6ca-v923.
Peterson, B. J., R. M. Holmes, J. W. McClelland, C. J. Vörösmarty, R. B. Lammers, A. I. Shiklomanov, I. G. Shiklomanov, and S. Rahmstorf, 2002: Increasing river discharge to the Arctic Ocean. Science, 298(5601), 2171-2173, https://doi.org/10.1126/science.1077445.
Shiklomanov, A. I., T. I. Yakovleva, R. B. Lammers, I. Ph. Karasev, C. J. Vörösmarty, and E. Linder, 2006: Cold region river discharge uncertainty-estimates from large Russian rivers. J. Hydrol., 326(1-4), 231-256, https://doi.org/10.1016/j.jhydrol.2005.10.037.
Shiklomanov, A. I., S. Déry, M. Tretiakov, D. Yang, D. Magritsky, A. Georgiadi, and W. Tang, 2021: River freshwater flux to the Arctic Ocean. Arctic Hydrology, Permafrost and Ecosystems, D. Yang, D. L. Kane, Springer, Cham, 703-738, https://doi.org/10.1007/978-3-030-50930-9_24.
November 17, 2021