
M. -L. Timmermans1 and Z. Labe2
1Yale University, New Haven, CT, USA
2Colorado State University, Fort Collins, CO, USA
Highlights
- August 2021 mean sea surface temperatures (SSTs) were ~1.0-3.5°C warmer than 1982-2010 August mean values in the Kara and Laptev Seas, and off the east coast of Greenland.
- Anomalously cooler August 2021 SSTs (~0.5-1.0°C cooler) were observed in the Chukchi and Northern Barents Seas and in Baffin Bay.
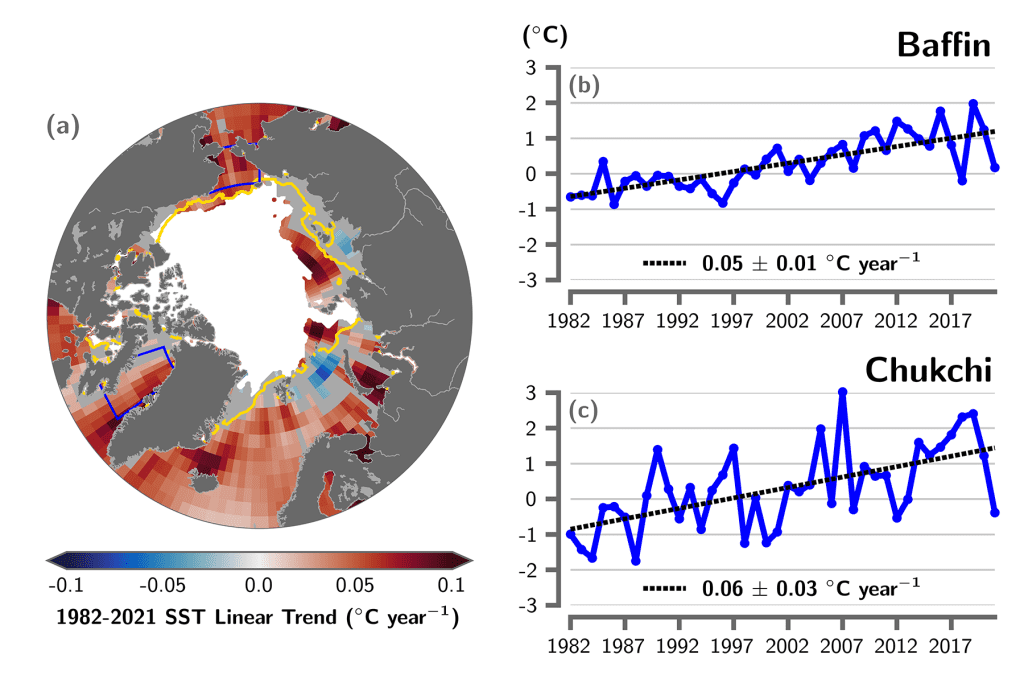
- Although there is considerable interannual variability in spatial SST patterns, August mean SSTs show statistically significant warming trends for 1982-2021 in most regions of the Arctic Ocean that are ice-free in August.
Arctic Ocean sea surface temperatures (SSTs) in the summer (June-August) are driven by the amount of incoming solar radiation absorbed by the sea surface and by the flow of warm waters into the Arctic from the North Atlantic and North Pacific Oceans. Solar warming of the Arctic Ocean surface is influenced by the distribution of sea ice (with greater warming occurring in ice-free regions), cloud cover, and upper-ocean stratification. Discharge of relatively warm Arctic river waters can provide an additional source of heat to the surface of marginal seas.
Arctic SST is an essential indicator of the role of the ice-albedo feedback mechanism in any given summer sea-ice melt season. As the area of sea ice cover decreases, more incoming solar radiation is absorbed by the ocean and, in turn, the warmer ocean melts more sea ice. In addition, higher SSTs are associated with delayed autumn freeze-up and increased ocean heat storage throughout the year. Marine ecosystems are influenced by SSTs, which affect the timing and development of primary and secondary production cycles (e.g., see essay Primary Productivity for further context), as well as available habitat for upper-trophic and temperature-sensitive species. With respect to carbon cycling, warmer SSTs are associated with reduced ocean uptake of carbon dioxide from the atmosphere, and thus represent another positive feedback loop (i.e., amplifying cycle) in a changing climate.
The SST data presented here are monthly mean values for August (1982-2021) (see Reynolds et al. 2002, 2007). August mean SSTs provide the most appropriate representation of Arctic Ocean summer SSTs because they are not affected by the cooling and subsequent sea-ice growth that typically takes place in the latter half of September.
August 2021 mean SSTs ranged from 6° to 10°C in the southeast Chukchi and Barents Seas to around 0° to 3°C in the East Siberian, Kara and Laptev Seas, Baffin Bay and in the ice-free waters east of Greenland (Fig. 1a). August 2021 mean SSTs were notably warm (around 1°-3.5°C warmer than the 1982-2010 August mean) in the Kara and Laptev Seas (Fig. 1b). This is consistent with early-season sea-ice retreat in these regions, and anomalously warm spring 2021 air temperatures over northern Eurasia (see essays Sea Ice and Surface Air Temperature). SSTs in the waters east of Greenland were also warmer (by around 1°-3°C) than the 1982-2010 August mean. It is notable that in the same region, summer 2021 surface air temperatures were about 2°-5°C warmer than the 1981-2010 mean (see essay Surface Air Temperature).
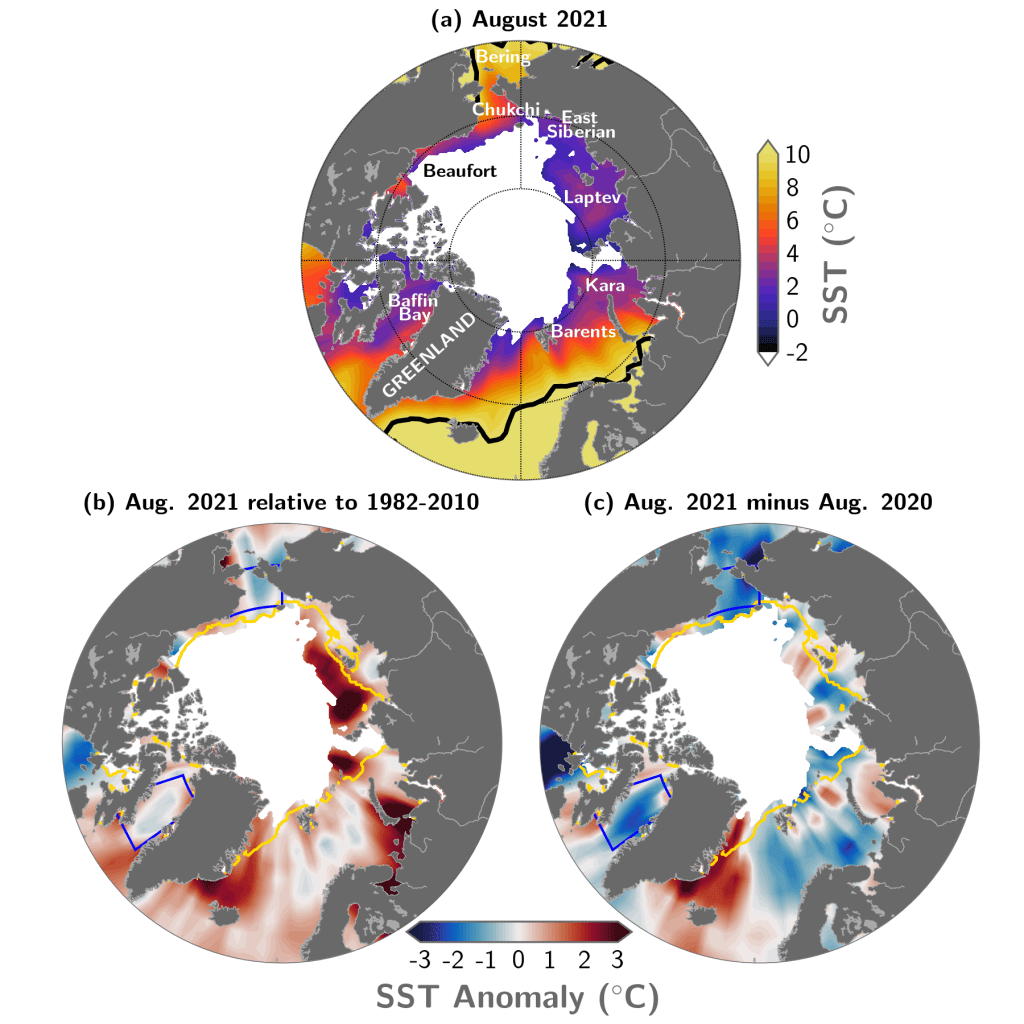
The northern Barents Sea, Baffin Bay, and the Chukchi Sea were marked by anomalously cool SSTs in August 2021 with SSTs around 0.5° to 1°C cooler than the mean (Fig. 1b). Surface air temperatures in summer (June-August 2021) were anomalously cold in the Beaufort and Chukchi Sea regions, and conditions were cloudy, limiting solar fluxes to the surface ocean (see essays Sea Ice and Surface Air Temperature). Cooler SSTs are also consistent with greater sea-ice extents (closer to normal) in the Chukchi and Beaufort Sea regions compared to recent past years, related to wind-driven transport of thick multiyear ice into the region in early 2021 (see essay Sea Ice).
There is significant variability from year-to-year in the particular regions that exhibit anomalously cool or warm SSTs (e.g., see the 2020 Arctic Report Card Sea Surface Temperature essay). The strong interannual variability in spatial patterns of SST is evident in the differences between August 2021 and August 2020 SSTs (Fig. 1c). August 2021 SSTs were around 0.5°C (and up to 2°C) cooler than in August 2020 over a significant portion of the ice-free regions, with some exceptions, including warmer SSTs off east Greenland (Fig. 1c).
Mean August SST warming trends from 1982 to 2021 persist over much of the Arctic Ocean, with statistically significant (at the 95% confidence interval) linear warming trends of up to +0.1°C yr-1 (Fig. 2a). The cooling trend (~-0.06°C yr-1) in mean August SSTs in the northern Barents Sea region remains a notable exception, although the cooling trend is not observed for most other months (see e.g., Lind et al. 2018). Anomalously cool SSTs in Baffin Bay and the Chukchi Sea distinguished the August 2021 SST field (Fig. 1b; Fig. 2b,c). Overall, however, Baffin Bay SSTs are becoming warmer in August with a linear warming trend over 1982-2021 of 0.05 ± 0.01°C yr-1 (Fig. 2b). Similarly, Chukchi Sea August mean SSTs are warming, with a linear trend of 0.06 ± 0.03°C yr-1 (Fig. 2c). Mean August SSTs for the entire Arctic (the Arctic Ocean and marginal seas north of 67° N) exhibit a linear warming trend of 0.03 ± 0.01°C yr-1.
Methods and data
The SST data presented here are a blend of in situ and satellite measurements from August 1982 to August 2021, taken from the monthly mean NOAA Optimum Interpolation (OI) SST Version 2 product (OISSTv2; Reynolds et al. 2002, 2007). OISSTv2 data were provided by the NOAA/OAR/ESRL PSD, Boulder, Colorado, USA, from their Website at https://psl.noaa.gov/data/gridded/data.noaa.oisst.v2.html [accessed Sept. 7, 2021] (Reynolds et al. 2007). In the Arctic Ocean overall, the OISSTv2 product has been found to exhibit a cold bias (i.e., underestimate SST) of up to 0.5°C compared to in situ measurements (Stroh et al. 2015). The OISSTv2 product uses a simplified linear relationship with sea-ice concentration to infer SST under sea ice (Reynolds et al. 2007), which means SSTs may be too cool by up to 0.2°C where there is sea-ice cover. We focus primarily on waters that are ice free in August, although this uncertainty can be reflected in trends and variability in the vicinity of the ice edge. The period 1982-2010 is used as the climatological reference for the August mean.
Sea-ice extent and ice edge data are from the NOAA/NSIDC Climate Data Record of Passive Microwave Sea Ice Concentration, Version 4 and Near-Real-Time NOAA/NSIDC Climate Data Record of Passive Microwave Sea Ice Concentration, Version 2 (Peng et al. 2013; Meier et al. 2021a,b.).
References
Lind, S., R. B. Ingvaldsen, and T. Furevik, 2018: Arctic warming hotspot in the northern Barents Sea linked to declining sea-ice import. Nat. Climate Change, 8, 634-639, https://doi.org/10.1038/s41558-018-0205-y.
Meier, W. N., F. Fetterer, A. K. Windnagel, and J. S. Stewart, 2021a: NOAA/NSIDC Climate Data Record of Passive Microwave Sea Ice Concentration, Version 4. [1982-2021]. Boulder, Colorado USA. NSIDC: National Snow and Ice Data Center, https://doi.org/10.7265/efmz-2t65.
Meier, W. N., F. Fetterer, A. K. Windnagel, and J. S. Stewart, 2021b: Near-Real-Time NOAA/NSIDC Climate Data Record of Passive Microwave Sea Ice Concentration, Version 2. [1982-2021], https://doi.org/10.7265/tgam-yv28.
Peng, G., W. N. Meier, D. J. Scott, and M. H. Savoie, 2013: A long-term and reproducible passive microwave sea ice concentration data record for climate studies and monitoring. Earth Syst. Sci. Data, 5, 311-318, https://doi.org/10.5194/essd-5-311-2013.
Reynolds, R. W., N. A. Rayner, T. M. Smith, D. C. Stokes, and W. Wang, 2002: An improved in situ and satellite SST analysis for climate. J. Climate, 15, 1609-1625, https://doi.org/10.1175/1520-0442(2002)015<1609:AIISAS>2.0.CO;2.
Reynolds, R. W., T. M. Smith, C. Liu, D. B. Chelton, K. S. Casey, and M. G. Schlax, 2007: Daily high-resolution-blended analyses for sea surface temperature. J. Climate, 20, 5473-5496, https://doi.org/10.1175/2007JCLI1824.1, and see http://www.esrl.noaa.gov/psd/data/gridded/data.noaa.oisst.v2.html.
Stroh, J. N., G. Panteleev, S. Kirillov, M. Makhotin, and N. Shakhova, 2015: Sea-surface temperature and salinity product comparison against external in situ data in the Arctic Ocean. J. Geophys. Res.-Oceans, 120, 7223-7236, https://doi.org/10.1002/2015JC011005.
January 7, 2022