
W. N. Meier1,2, D. Perovich3, S. Farrell4, C. Haas5, S. Hendricks5, A. A. Petty6, M. Webster7, D. Divine8, S. Gerland8, L. Kaleschke5, R. Ricker9, A. Steer8, X. Tian-Kunze5, M. Tschudi10, and K. Wood11,12
1National Snow and Ice Data Center, Boulder, CO, USA
2Cooperative Institute for Research in Environmental Sciences, University of Colorado Boulder, Boulder, CO, USA
3Thayer School of Engineering, Dartmouth College, Hanover, NH, USA
4Department of Geographical Sciences, University of Maryland, College Park, MD, USA
5Alfred Wegener Institute, Helmholtz Centre for Polar and Marine Research, Bremerhaven, Germany
6Goddard Space Flight Center, NASA, Greenbelt, MD, USA
7Geophysical Institute, University of Alaska Fairbanks, Fairbanks, AK, USA
8Norwegian Polar Institute, Fram Centre, Tromsø, Norway
9Norwegian Research Centre, Tromsø, Norway
10Aerospace Engineering Sciences, University of Colorado, Boulder, CO, USA
11Cooperative Institute for Climate, Ocean, and Ecosystem Studies, University of Washington, Seattle, WA, USA
12Pacific Marine Environmental Laboratory, NOAA, Seattle, WA, USA
Highlights
- Winter maximum (March) and summer minimum (September) 2021 sea ice extents were less extreme compared to the last couple of years, but the 15 lowest minimum extents have all occurred in the last 15 years.
- An early onset of sea ice melt and retreat occurred in the Laptev Sea, leading to record-low extent in the region during May and June, while winter advection of thick, multiyear ice into the Beaufort and Chukchi Seas resulted in a late and limited spring retreat in that region.
- The amount of multiyear sea ice, based on available data since 1985, reached its second lowest level by the end of summer 2021, sea ice thickness was lower than recent years, and volume was at record low (since at least 2010) in April 2021.
Introduction
Arctic sea ice is the frozen interface between the ocean and atmosphere in the north, limiting ocean-atmosphere exchanges of energy and moisture and playing a critical role in the earth’s climate and the regional ecosystem. The high albedo (reflectivity) of sea ice and overlying snow reflects most incoming solar radiation, which inhibits summer warming. A range of marine mammals depend on the ice as a platform for mating, feeding, birthing, and other activities. The cycle of ice formation and melt influences food web dynamics and the biogeochemical balance of the upper ocean. Humans are deeply connected to the ice as well. Sea ice both facilitates and threatens human activities in the Arctic, including Indigenous hunting and transportation, marine navigation, and national security responsibilities. Overall, 2021 continued to demonstrate the profound changes underway in the Arctic sea ice system.
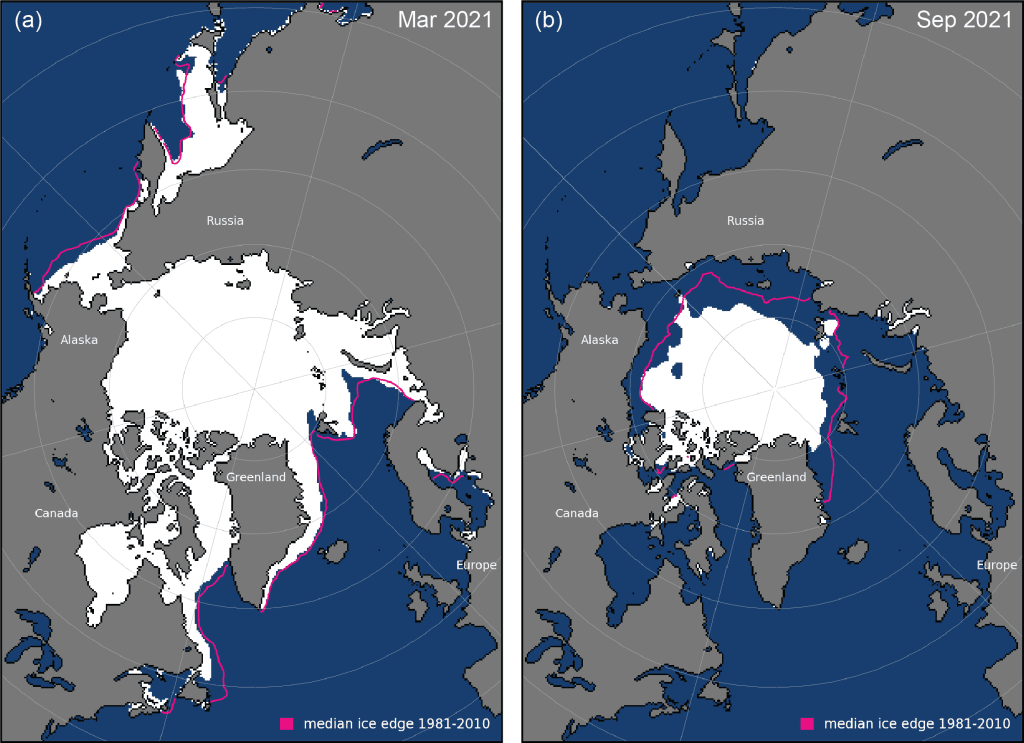
Arctic sea ice began 2021 catching up from record or near-record low extent and a notably late freeze-up in autumn 2020. Such low autumn ice extent can potentially influence stratospheric circulation and subsequent midlatitude cold outbreaks (see essay Surface Air Temperature). At the start of 2021, sea ice extent was lower than the 1981-2020 average in the Bering and Barents Seas, but near-average elsewhere. High pressure in January and February persisted in the Siberian sector of the Arctic, resulting in divergence from and new ice formation along the Siberian coast and strong advection of thicker, multiyear ice into the Beaufort and Chukchi Seas. It also advected icebergs that were calved from the Canadian Archipelago into the coastal region of Utqiaġvik, Alaska. This multiyear ice in the Beaufort and Chukchi Seas delayed the retreat of ice on the North American side of the Arctic. On the Siberian side, strong pressure gradients during April and May facilitated early melt onset and local ice retreat in spring, leading to a record-low extent in the Laptev Sea during May and June.
Summer 2021 was marked by general low pressure over the Arctic Ocean. This brought relatively cloudier conditions and divergent ice circulation that, along with the thicker Beaufort and Chukchi Seas ice, slowed the decline in ice extent. Summer (JJA) air temperatures at the 925 mb level ranged from 1° to 2°C above normal over the Arctic Ocean, with the exception of near-normal temperatures for the Beaufort and Chukchi Seas (see essay Surface Air Temperature). The older ice in the Beaufort and Chukchi Seas resulted in a near-normal ice edge location throughout most of the summer, breaking the regional pattern of low ice extents seen in recent years. The summer circulation also limited ice export through Fram Strait, resulting in the unusual occurrence of a nearly ice-free East Greenland Sea during much of the summer.
Sea ice extent
Sea ice extent is defined as the total area covered by at least 15% ice concentration. Extent is a common and useful metric to assess seasonal and long-term Arctic sea ice changes, for which there is now a 43-year record derived from consistent satellite-borne passive microwave sensor observations. The substantial decline in Arctic ice extent since 1979 is one of the most iconic indicators of climate change.
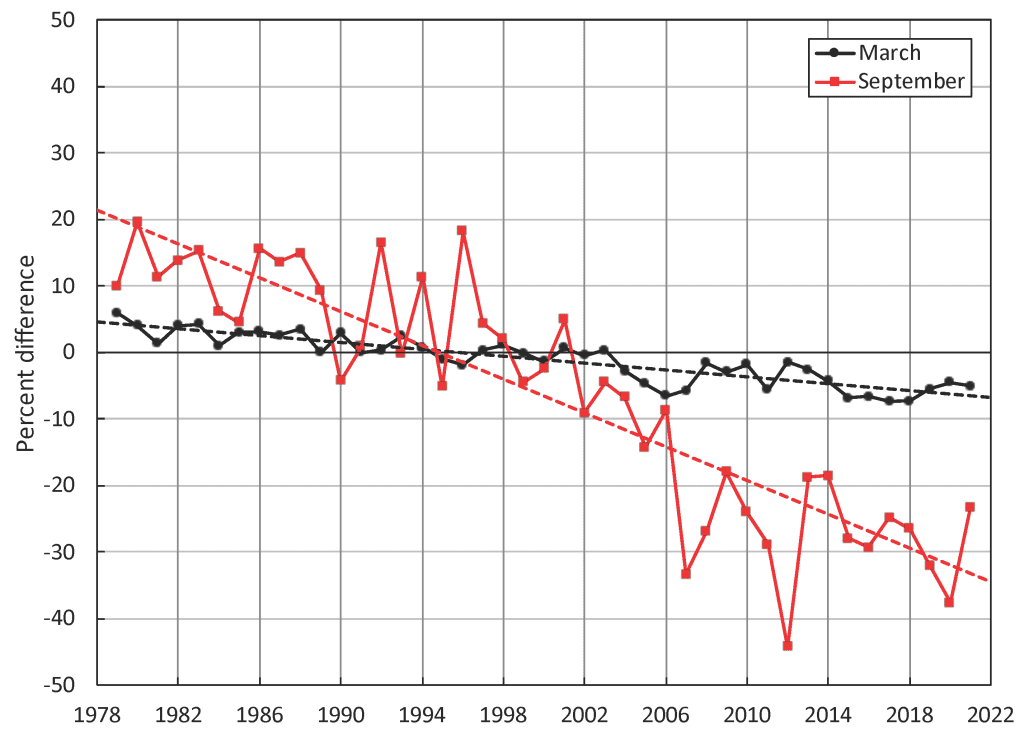
The seasonal cycle of Arctic sea ice is characterized by the maximum annual extent in March, decreasing through spring and summer to an annual minimum extent in September. March and September 2021 total extent negative anomalies were not as extreme as in recent years, but still ranked among the lowest in the satellite record (Table 1). September trends are steeper than March (Fig. 1, Table 1) and the steepest of any month, though statistically significant declines in extent are seen in all months throughout the satellite record. The 15 lowest September extents in the satellite record have all occurred in the last 15 years. March 2021 was characterized by lower-than-average extent in the Bering Sea, Baffin Bay, and the Gulf of St. Lawrence and near-normal extent elsewhere (Fig. 2). September 2021 average extent was characterized by particularly lower-than-average coverage in the Siberian and East Greenland Seas and closer-to-normal coverage in the Beaufort and Chukchi Seas (Fig. 2).
| March | September | |||
|---|---|---|---|---|
| Monthly Average | Daily Maximum | Monthly Average | Daily Minimum | |
| Extent (106 km2) |
14.64 | 14.77 | 4.92 | 4.72 |
| Rank (out of 43 years) |
9 | 7 | 12 | 12 |
| 1981-2010 average (106 km2) |
15.43 | 15.65 | 6.41 | 6.22 |
| Anomaly rel. 1981-2010 average (106 km2) |
-0.79 | -0.88 | -1.49 | -1.50 |
| Trend, 1979-2021 (km 2 yr-1) |
-0.40 | -0.43 | -0.81 | -0.81 |
| Trend, 1979-2021 (% dec -1) |
-2.6 | -2.7 | -12.7 | -13.0 |
Sea ice age
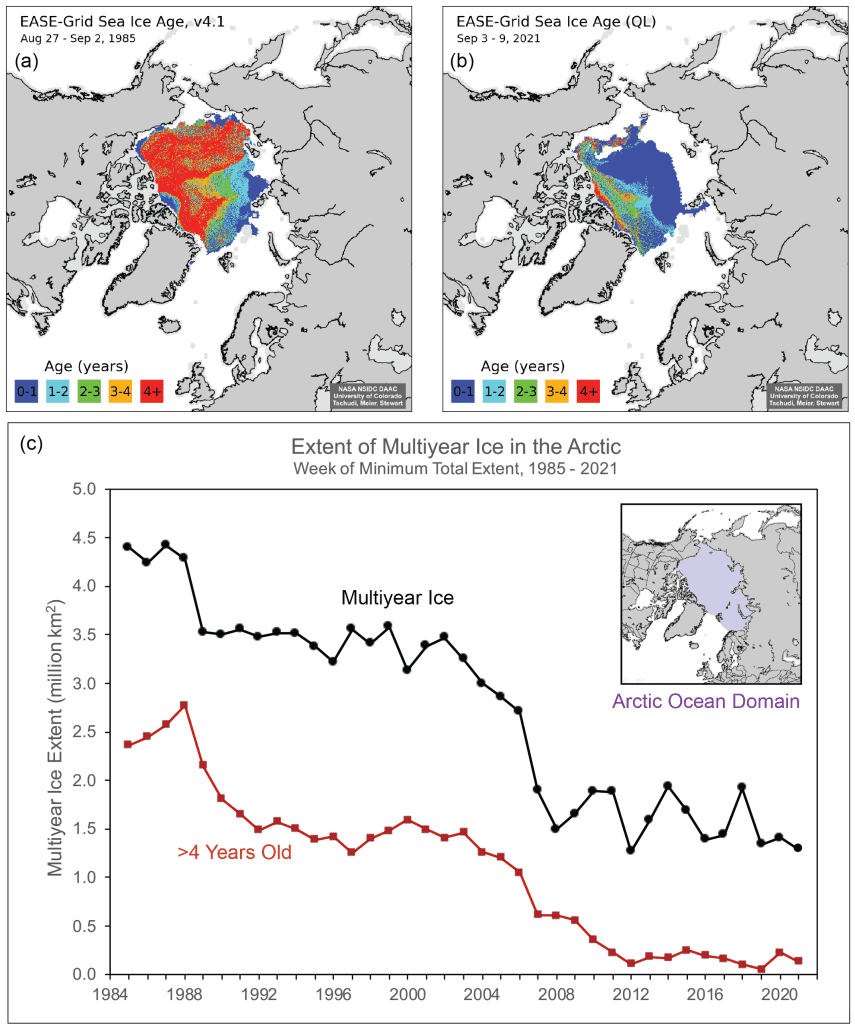
Sea ice drifts around the Arctic Ocean, forced by winds and ocean currents, growing and melting thermodynamically. Ice convergence can also lead to dynamic thickening (i.e., ridging and rafting) while ice divergence during winter exposes open water within which new ice can form. Age is a proxy for thickness as multiyear ice (ice that survives at least one summer melt season) grows thicker over successive winter periods. Age is here presented over the Arctic Ocean domain (Fig. 3, inset) for the period 1985-2021. In the week before the 2021 annual minimum extent, when the age values of the remaining sea ice are incremented by one year, the amount of multiyear ice remaining in the Arctic Ocean was the second lowest on record (above only 2012). The September multiyear sea ice extent declined from 4.40 million km2 in 1985 to 1.29 million km2 in 2021 (Fig. 3). Over the same period, the oldest ice (>4 years old) declined from 2.36 million km2 to 0.14 million km2. In the 37 years since records began in 1985, the Arctic Ocean has changed from a domain dominated by multiyear ice to one where first-year ice prevails. A younger ice cover implies a thinner, less voluminous ice pack.
Sea ice thickness and volume
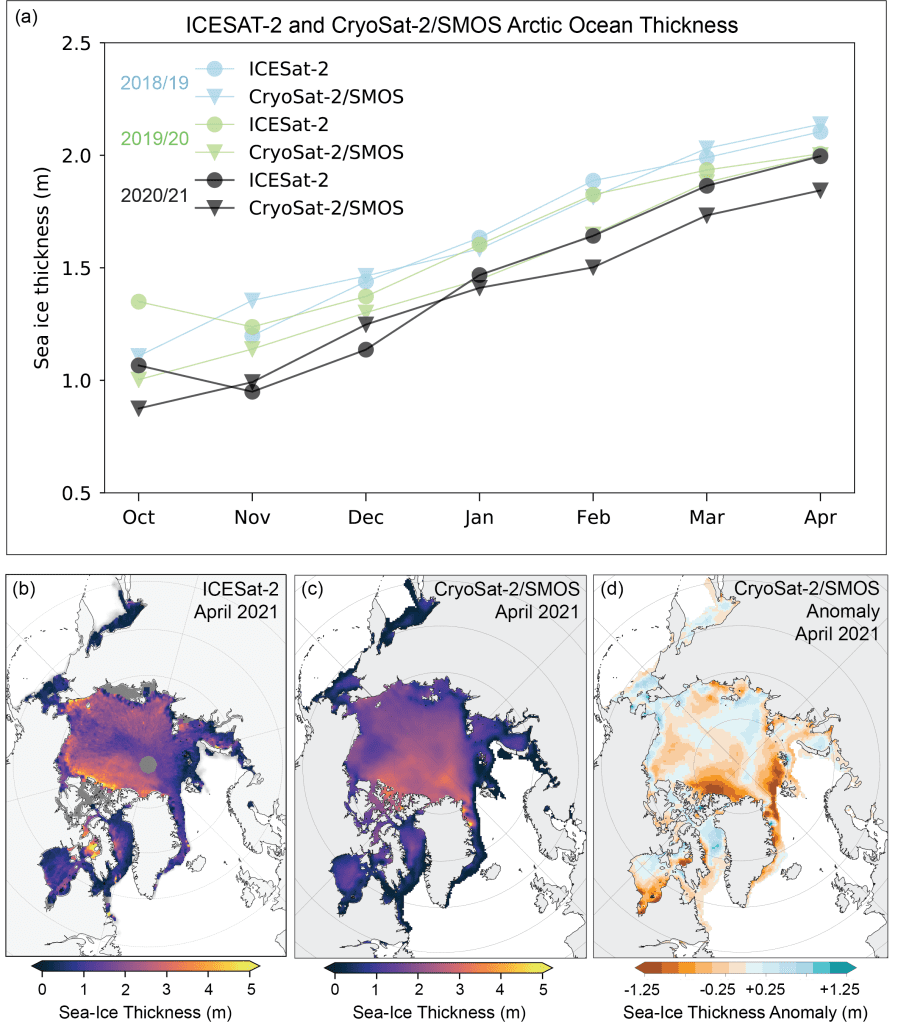
Sea ice thickness is an important indicator of overall ice conditions because it provides the third dimension of the ice cover. The ICESat-2 and CryoSat-2/SMOS satellites tracked the seasonal October to April growth over the past three years in which both products were available (Fig. 4a). The 2020/21 winter sea ice was the thinnest of the three years in both products, and the thinnest in the full CryoSat-2/SMOS record (starting in the 2010/11 winter, not shown). April 2021 sea ice thickness fields from ICESat-2 and CryoSat-2/SMOS (Fig. 4b,c) are generally consistent, but with some regional differences. Both show a typical geographic pattern with the thickest ice along the Canadian Archipelago and northern Greenland. However, comparing April 2021 to the average of previous years (2010-20) in the CryoSat-2/SMOS record (Fig. 4d), the ice along the Canadian Archipelago and northern Greenland is thinner than average, indicating a thinning of the thickest-ice region of the Arctic. Thicker-than-average ice in April 2021 is found in coastal areas, particularly along the Beaufort and Chukchi Seas coasts, likely due to the aforementioned advection of multiyear ice into the region. Differences in snow depth relative to the snow climatology used in the CryoSat-2/SMOS product may also account for some of the difference between years.
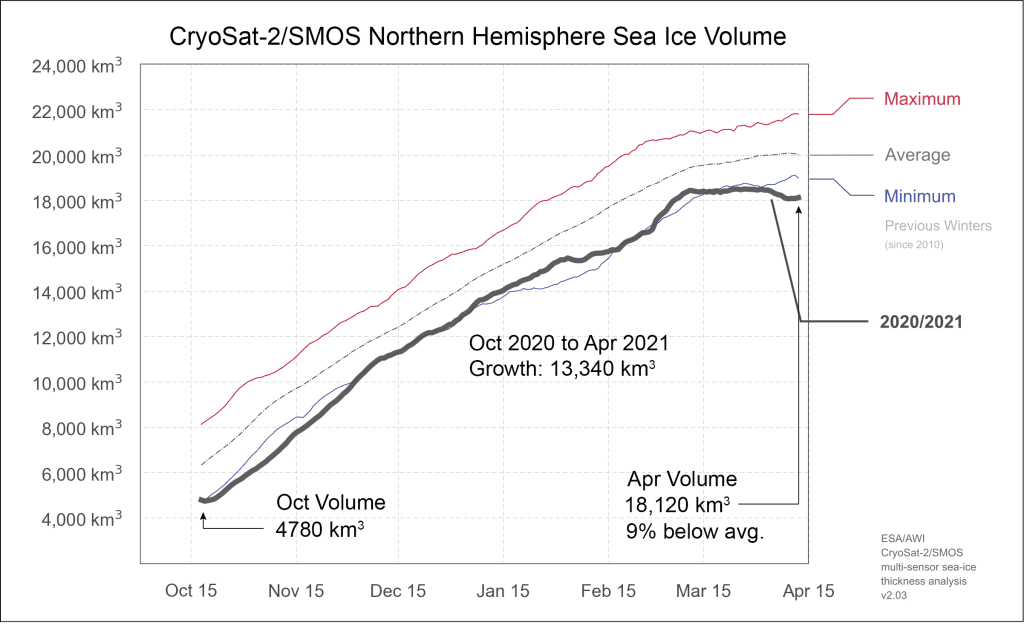
Sea ice thickness is integrated with ice concentration to provide winter volume estimates for the CryoSat-2/SMOS measurement time period. The seasonal time series (Fig. 5) indicates lower-than-average ice volume throughout the 2020/21 winter, with record-low conditions spanning from October to mid-November. Volume growth typically slows by early March as spring warming begins. In 2021, the volume growth was nearly flat for much of March and then experienced a slight decrease in volume during early April. While there may be regionally different reasons for this, a localized manifestation of this phenomenon was observed during the Nansen Legacy research cruises (direct observation from authors) in the northern Barents Sea where, despite continuous cold conditions during March, persistent presence of warm Atlantic water close to the sea surface prevented further ice growth. By the end of winter, ice volume in April 2021 was the lowest April volume within the 11-year record. This record suggests that while the rate of decline in September sea ice extent over the 2010-20 period has slowed compared to previous decades, the ice has continued to thin.
Methods and data
Sea ice extent values are from the NSIDC Sea Ice Index (Fetterer et al. 2017), based on passive microwave derived sea ice concentrations from the NASA Team algorithm (Cavalieri et al. 1996; Maslanik and Stroeve 1999). There are several other passive microwave derived products available (e.g., Ivanova et al. 2014), including the EUMETSAT OSI-SAF CCI climate data record (Lavergne et al. 2019). All products have some limitations and uncertainties (e.g., Kern et al. 2019), but overall, the trends agree well (Comiso et al. 2017).
Sea ice age data are from the EASE-Grid Sea Ice Age, Version 4 (Tschudi et al. 2019a) and Quicklook Arctic Weekly EASE-Grid Sea Ice Age, Version 1 (Tschudi et al. 2019b) archived at the NASA Snow and Ice Distributed Active Archive Center (DAAC) at NSIDC. Age is calculated via Lagrangian tracking of ice parcels using weekly sea ice motion vectors. Age is generally a proxy for thickness because older ice is typically thicker, via thermodynamic growth and potential dynamic thickening (i.e., ridging and rafting). Only the oldest age category is preserved for each grid cell.
Satellite altimetry has enabled the continuous retrieval of sea ice thickness and volume estimates over the entire Arctic basin during the freezing season, starting with the ESA CryoSat-2 radar altimeter, launched in 2010. This was followed in September 2018 by the launch of the NASA Ice, Cloud, and land Elevation 2 (ICESat-2) laser altimeter. Thus, there are now two independent altimetry-based estimates of thickness and volume.
Altimeter measurements have higher relative errors for thin ice because of the achievable precision of the elevation. Weekly CryoSat-2 estimates have been combined with thin ice (<1 m) estimates from the ESA Soil Moisture Ocean Salinity (SMOS) instrument, launched in 2009, to obtain an optimal estimate across thin and thick ice regimes (Ricker et al. 2017) on a 25 km resolution EASE2 grid. Optimal interpolation is used to fill in data gaps in the weekly CryoSat-2 fields and to merge the CryoSat-2 and SMOS estimates. When combined with sea ice concentration, the CryoSat-2/SMOS record of ice thickness is used to compute sea ice volume; data are available at ftp://ftp.awi.de/sea_ice/product/cryosat2_smos/.
ICESat-2 estimates here focus on an Inner Arctic Domain (Central Arctic, Beaufort, Chukchi, Laptev, E. Siberian Seas—the same domain as for Fig. 3 except without the Barents and Kara Seas) due to poorer knowledge of snow conditions in the more peripheral seas. The data used here are the gridded 25 km x 25 km monthly data produced in Petty et al. (2020), now using rel004 ATL10 freeboard and v1.1 NESOSIM snow loading (depth and density). Data are available at NSIDC: https://nsidc.org/data/IS2SITMOGR4/versions/1.
Acknowledgments
W. Meier thanks the NSIDC DAAC and the NASA ESDIS project for support. Sea ice age data were processed by J. S. Stewart (NSIDC). Thanks to J. Belter and T. Krumpen (Alfred Wegener Institute), and Nansen Legacy project members for information on winter/spring ice conditions from the IceBird and Nansen Legacy field campaigns, respectively.
References
Cavalieri, D. J., C.L. Parkinson, P. Gloersen, and H. J. Zwally, 1996 (updated yearly): Sea Ice Concentrations from Nimbus-7 SMMR and DMSP SSM/I-SSMIS Passive Microwave Data, Version 1. NASA National Snow and Ice Data Center Distributed Active Archive Center, Boulder, CO, USA, https://doi.org/10.5067/8GQ8LZQVL0VL. [Accessed 27 August 2021]
Comiso, J. C., W. N. Meier, and R. Gersten, 2017: Variability and trends in the Arctic sea ice cover: Results from different techniques. J. Geophys. Res., 122, 6883-6900, https://doi.org/10.1002/2017JC012768.
Fetterer, F., K. Knowles, W. N. Meier, M. Savoie, and A.K. Windnagel, 2017 (updated daily): Sea Ice Index, Version 3. NSIDC: National Snow and Ice Data Center, Boulder, CO, USA, https://doi.org/10.7265/N5K072F8. [Accessed 27 August 2021]
Ivanova, N., O. M. Johannessen, L. T. Pedersen, and R. T. Tonboe, 2014: Retrieval of Arctic sea ice parameters by satellite passive microwave sensors: A comparison of eleven sea ice concentration algorithms. IEEE Trans. Geosci. Rem. Sens., 52(11), 7233-7246, https://doi.org/10.1109/TGRS.2014.2310136.
Kern, S., T. Lavergne, D. Notz, L. T. Pedersen, R. T. Tonboe, R. Saldo, and A. M. Sørensen, 2019: Satellite passive microwave sea-ice concentration data set intercomparison: closed ice and ship-based observations. Cryosphere, 13, 3261-3307, https://doi.org/10.5194/tc-13-3261-2019.
Lavergne, T., and Coauthors, 2019: Version 2 of the EUMETSAT OSI SAF and ESA CCI sea-ice concentration climate data records. Cryosphere, 13, 49-78, https://doi.org/10.5194/tc-13-49-2019.
Maslanik, J., and J. Stroeve, 1999: Near-Real-Time DMSP SSMIS Daily Polar Gridded Sea Ice Concentrations, Version 1. NASA National Snow and Ice Data Center Distributed Active Archive Center, Boulder, CO, USA, https://doi.org/10.5067/U8C09DWVX9LM. [Accessed 27 August 2021]
Petty, A. A., N. T. Kurtz, R. Kwok, T. Markus, and T. A. Neumann, 2020: Winter Arctic sea ice thickness from ICESat-2 freeboards. J. Geophys. Res.-Oceans, 125, e2019JC015764, https://doi.org/10.1029/2019JC015764.
Ricker, R., S. Hendricks, L. Kaleschke, X. Tian-Kunze, J. King, and C. Haas, 2017: A weekly Arctic sea-ice thickness data record from merged CryoSat-2 and SMOS satellite data. Cryosphere, 11, 1607-1623, https://doi.org/10.5194/tc-11-1607-2017.
Tschudi, M., W. N. Meier, J. S. Stewart, C. Fowler, and J. Maslanik, 2019a: EASE-Grid Sea Ice Age, Version 4. [March, 1984-2020]. NASA National Snow and Ice Data Center Distributed Active Archive Center, Boulder, CO, USA, https://doi.org/10.5067/UTAV7490FEPB. [Accessed 1 September 2021]
Tschudi, M., W. N. Meier, and J. S. Stewart, 2019b: Quicklook Arctic Weekly EASE-Grid Sea Ice Age, Version 1. [March, 2021]. NASA National Snow and Ice Data Center Distributed Active Archive Center, Boulder, CO, USA, https://doi.org/10.5067/2XXGZY3DUGNQ. [Accessed 1 September 2021]
November 19, 2021