

T. A. Moon1,2, M. Tedesco3,4, J. E. Box5, J. Cappelen6, R. S. Fausto5, X. Fettweis7, N. J. Korsgaard5, B. D. Loomis8, K. D. Mankoff5, T. L. Mote9, A. Wehrlé10, and Ø. A. Winton5
1Cooperative Institute for Research in Environmental Sciences, University of Colorado Boulder, Boulder, CO, USA
2National Snow and Ice Data Center, Boulder, CO, USA
3Lamont-Doherty Earth Observatory, Columbia University, Palisades, NY, USA
4Goddard Institute of Space Studies, NASA, New York, NY, USA
5Geological Survey of Denmark and Greenland, Copenhagen, Denmark
6Danish Meteorological Institute, Copenhagen, Denmark
7SPHERES Research Unit, University of Liège, Liège, Belgium
8Goddard Space Flight Center, NASA, Greenbelt, MD, USA
9Department of Geography, University of Georgia, Athens, GA, USA
10Institute of Geography, University of Zurich, Zurich, Switzerland
Highlights
- Greenland ice sheet total mass change for 1 September 2020 to 31 August 2021 was -85 ± 16 Gt, 179 Gt less than the 2002-21 average of -264 ± 12 Gt yr-1.
- High variability characterized 2021 surface melting with a two-week long August period of increased melt and bare ice exposure contrasting with low June and July melt conditions. An overall average melt obscured strongly contrasting spatial and temporal melt patterns.
- On 14 August 2021, Greenland experienced the latest date of an extreme melt event (>50% area) within the 43-year satellite record, including the first reported rainfall at Summit Station, Greenland.
Introduction
The Greenland ice sheet covers ~1.63 million km2 and contains ice equivalent to 7.4 m of eustatic sea level rise (Morlighem et al. 2017). Following decades of relative stability, the ice sheet has now lost mass almost every year since 1998, with tied years of record ice loss in 2012 and 2019 (Mankoff et al. 2021). Ice loss is exposing land, adding substantial freshwater into the ocean, and raising sea levels globally (Moon et al. 2020; Mankoff et al. 2020a; IMBIE Team 2020).
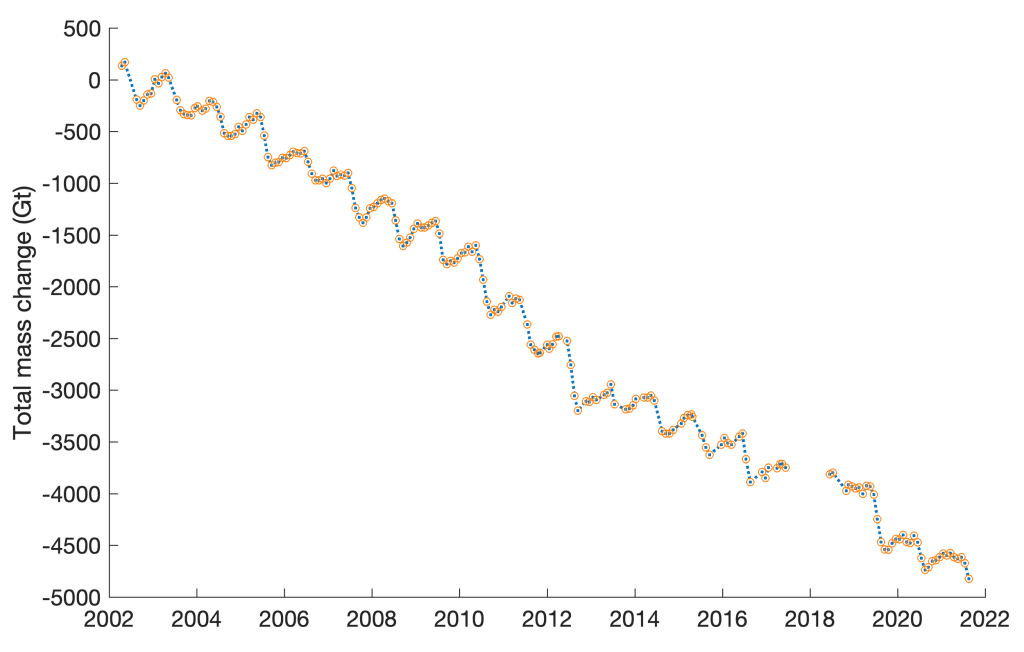
Total Greenland ice sheet mass balance is the sum of 1) the surface mass balance, which combines accumulated snow across the ice sheet with ice loss via surface melt and runoff, and 2) solid ice discharge via calving at tidewater glaciers. Surface melt in particular is sensitive to atmospheric and ice sheet surface conditions, and is a major component of ice loss (ablation). During the 2020-21 ice sheet balance year, spanning 1 September to 31 August, the total Greenland ice sheet mass change was -85 ± 16 Gt of ice as measured by the GRACE-FO satellite (Fig. 1). This is equivalent to ~0.2 mm of sea level rise, not including ongoing thermal expansion (IPCC 2021). The 2020-21 total mass balance year had 179 Gt less mass loss than the 2002-21 average of -264 ± 12 Gt yr-1.
Surface temperature, melt, and ablation
Surface temperature observations at 15 terrestrial DMI weather stations (with record start dates spanning from 1784 to 1991) recorded near or above average temperatures throughout the balance year. Temperature anomalies were generally highest in winter (December-February), exceeding one standard deviation at 11 of the 15 stations. A new summer (June-August) high temperature record was set at the Danmarkshavn station in northeast Greenland and July-only heat records were set at several other northeast stations. Tasiilaq, in southeastern Greenland, set a new August high temperature.
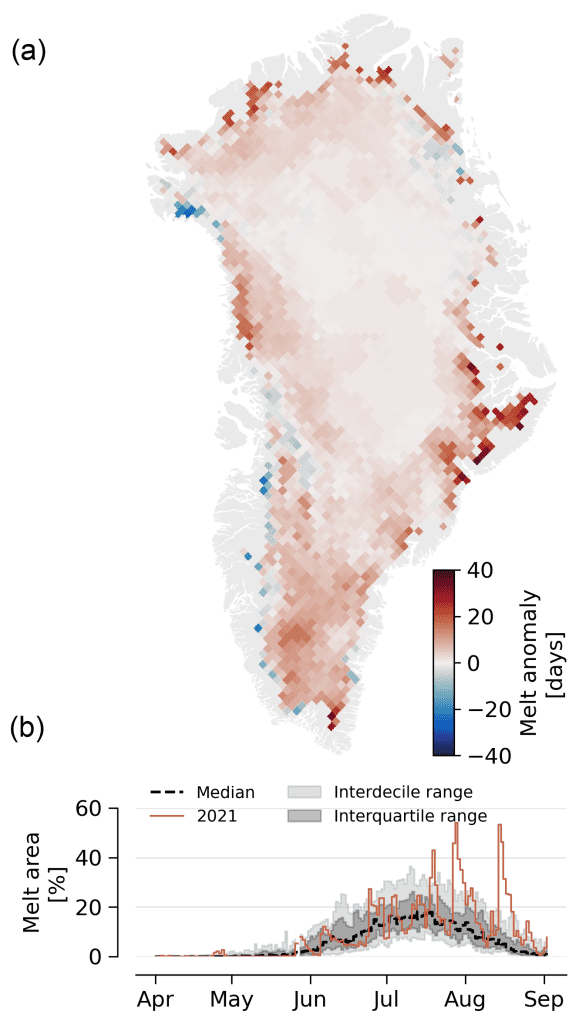
Except for an above-average melt event on 27 April, the ice sheet daily melt extent as measured by satellites remained low until 26 May and through mid-summer remained mostly within the 1981-2010 10th to 90th percentiles (Fig. 2). In situ, on-ice PROMICE automated weather stations recorded temperatures within ±1 standard deviation for June and July. Late July and August, however, included three extreme melt episodes. The first, on 19 July, had melt across 702,000 km2 (~43%) of the ice sheet surface. A second melt event on 28 July extended across 54% of the ice sheet surface, and a third melt episode concentrated on 14 August had 53% melt area and reached the highest ice sheet elevations (National Science Foundation’s (NSF) Summit Station, 3216 m). All PROMICE weather stations along the ice sheet periphery recorded above-average air temperatures during all three events.
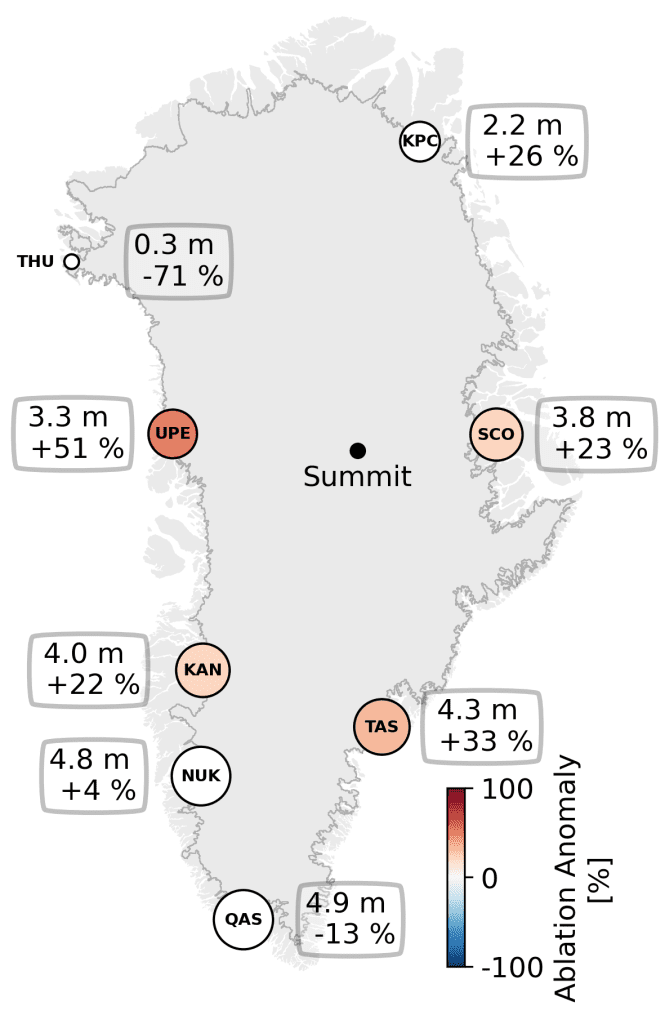
For the full ablation season, PROMICE ablation measurements around the ice sheet margin indicate significantly above-average ablation along the central western and eastern coasts (Fig. 3).
Albedo and bare ice area
Ice sheet reflectivity (albedo) strongly modulates surface melt. When the ice sheet surface is dark (low albedo) the surface absorbs more sunlight, leading to the possibility of earlier melt onset and/or enhanced melting. Contributors to low albedo include loss of snow cover revealing bare ice, snow grain growth, and organic and inorganic surface material like microbes or black carbon. In contrast, a bright surface, for example from fresh snow, increases albedo and reduces melt potential. The snow-covered to bare glacial ice transition produces a strong albedo shift, making bare ice area a useful observational metric (Wehrlé et al. 2021).
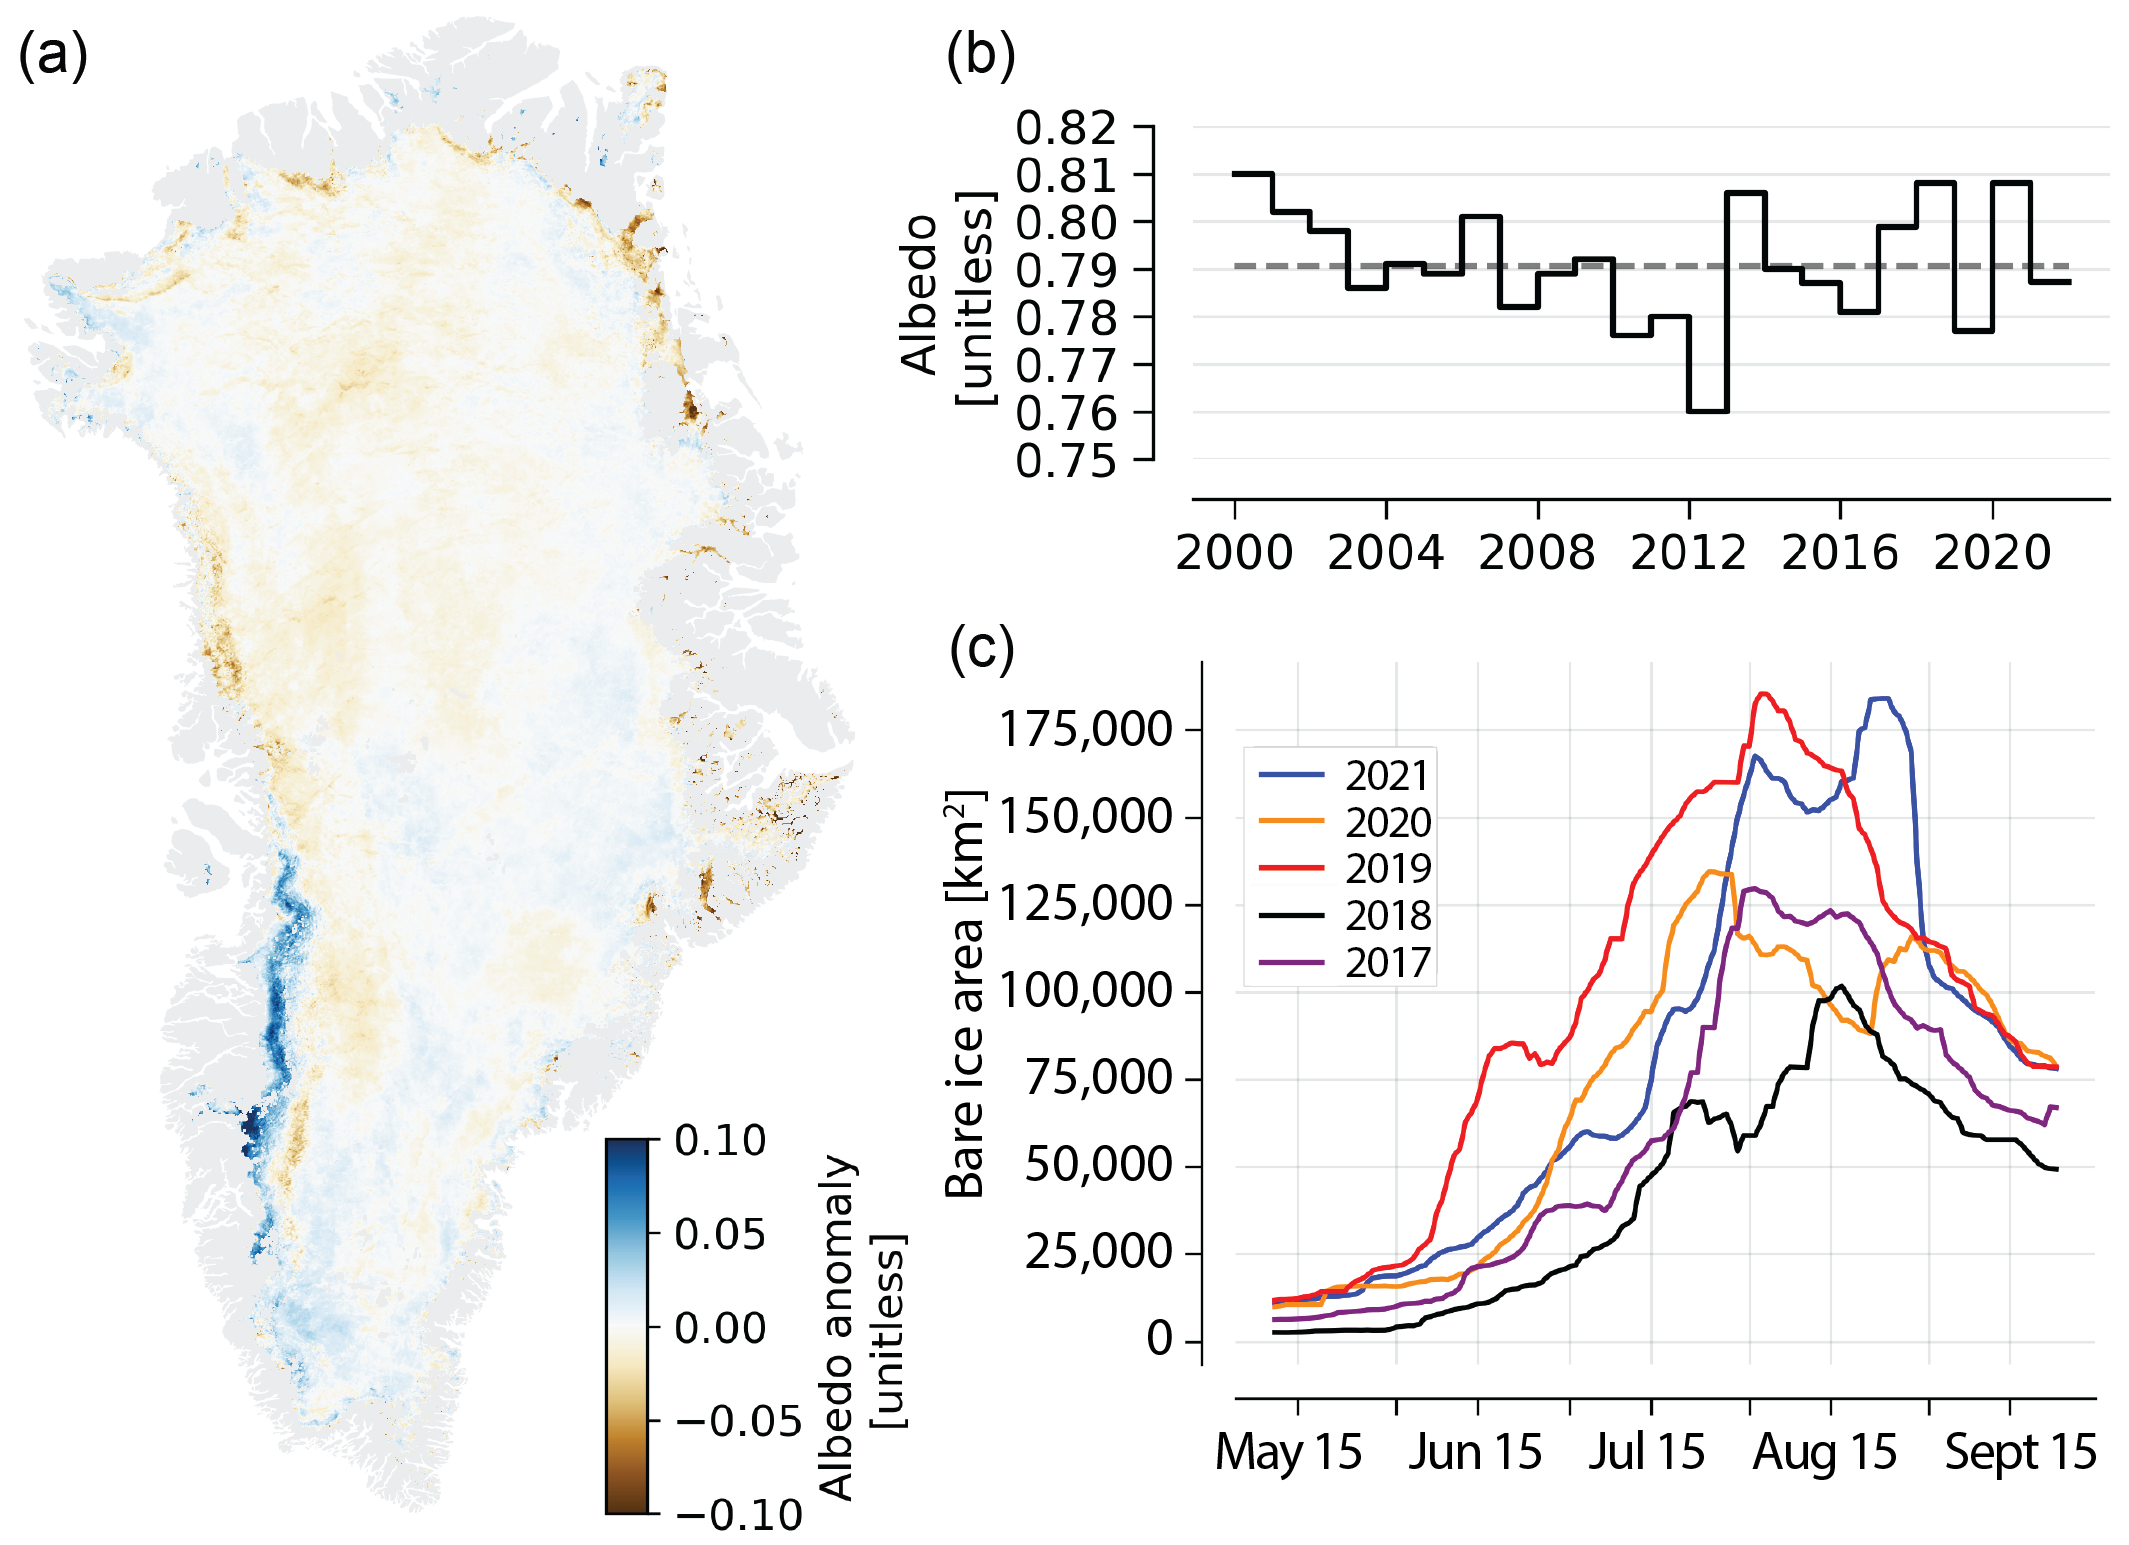
The average June through August 2021 ice sheet albedo was at the 2000-21 average, due in part to an above-average (bright) July, offset by a below-average (dark) August. Regionally, the southwest was brighter than normal from delayed melting (Fig. 4a,b) and darker than normal across the northern ice sheet. During mid-August, bare ice area (Fig. 4c) reached extremely low values equal to those in 2019, a record-tying ice loss year. August 2021 also had the latest peak in bare ice area during the past five years (2017-21). Note that local ablation (Fig. 3) and albedo anomalies (Fig. 4a) may not intuitively align due to factors such as summer snowfall, surface atmospheric conditions, extreme melt events, etc.
Solid ice loss and tidewater area change
Year-to-year variability in ice loss from calving is lower than surface melt variability (Mankoff et al. 2020b). Nonetheless, an inter-decadal ~10% discharge increase is apparent. For 1981-2010, the average total discharge was ~444 ± 47 Gt yr-1, while average discharge during 2010-19 was ~487 ± 46 Gt yr-1. As of November, solid ice discharge for 2021 reached an average of 497 ± 48 Gt yr-1, with the largest contributions from the southeast, followed by the northwest (Fig. 5a,c).
If solid ice loss through calving is more rapid than replacement from ice flow, the glacier front retreats and glacier area is lost. For 2020-21, net tidewater glacier surface area loss due to glacier front retreat was -18.9 km2 for 47 major and representative Greenland tidewater glaciers (Fig. 5b,c), substantially lower than the mean annual loss of -103.3 km2 for these glaciers since 2002 (Andersen et al. 2019).
Extreme August melt event
Atmospheric circulation strongly modulates surface melt via the thermal and radiative budgets. August 2021 had two notable atmospheric anomalies. In early August, persistent high-pressure conditions centered over the ice sheet promoted enhanced melting (see essay Surface Air Temperature). These conditions were similar to those that generated the 2012 and 2019 melt records but did not produce a 2021 extreme melt event. In mid-August, an atmospheric event associated with the transport of moisture at high elevations promoted the exceptional rainfall event at Summit. In this case, it was not an increase in solar radiation promoting melting but the heat and moisture influx. Though the near-surface processes that led to enhanced melting in early and mid-August 2021 were different, enhanced melting in both cases was associated with a disruption and increased sinuosity of the polar vortex.
Based on the 1978-present satellite record, the melt event centered on 14 August 2021 was the latest time during the ablation season that more than half of the ice sheet (>815,000 km2) experienced surface melt. Summer 2021 is only the second year on record (along with 2012) with more than one melt event exceeding this threshold. This was also the first time that rainfall was reported at NSF’s Summit Station (3216 m above sea level) since its operation started in 1989, though surface melt (without rainfall) was observed in 1995, 2012, and 2019. The 1995-to-present melt event frequency at Summit (4 events in 27 years) is in contrast to the average of one event per 153 years for the 10,000 years prior to 1950, derived from ice core data (Alley and Anandakrishnan 1995). Scientists are now installing rain gauges at interior ice sheet weather stations; rain gauges on a new-generation GC-Net station at South Dome (2850 m) recorded three distinct summer 2021 rainfall events.
Methods
Total mass change is measured indirectly by the GRACE (Gravity Recovery and Climate Experiment, 2002-17) and GRACE-FO (Follow On, 2018-present) satellite missions by detecting gravity anomalies. Technical Notes (TN) are hosted at https://podaac-tools.jpl.nasa.gov/drive/files/allData.
Direct weather observations are provided via 15 Danish Meteorological Institute (DMI) weather stations with records beginning from 1784 (Nuuk) to 1991 (Summit) and 8 automatic weather station transects from the Programme for Monitoring of the Greenland Ice Sheet (PROMICE) at the Geological Survey of Greenland and Denmark (GEUS). DMI stations are located on land, with most coastal and some within fjords, with Summit data provided by NOAA GEOSummit. PROMICE transects, located on the ice sheet, also provide surface ablation (following van As et al. 2016). Surface melt duration and extent measurements are derived from daily Special Sensor Microwave Imager/Sounder (SSMIS) 37 GHz, horizontally polarized passive microwave radiometer satellite data (Mote 2007).
NASA MODIS satellite data provide multi-decadal albedo monitoring (Box et al. 2017). The Sentinel-3 SICE product is now being used to monitor bare ice area (Kokhanovsky et al. 2020; Wehrlé et al. 2021).
PROMICE combines ice thickness estimates with ice velocity measurements based on Sentinel-1 satellite data to create a high temporal resolution solid ice discharge product integrated over Greenland (following Mankoff et al. 2020b).
Acknowledgments
Data from the Programme for Monitoring of the Greenland Ice Sheet (PROMICE) were provided by the Geological Survey of Denmark and Greenland (GUES) at http://www.promice.dk. T. Moon was supported by the University of Colorado Boulder Cooperative Institute for Research in Environmental Sciences (CIRES). M. Tedesco was supported by National Science Foundation ANS #1713072, National Science Foundation PLR-1603331, NASA MAP #80NSSC17K0351, NASA #NNX17AH04G, and the Heising-Simons Foundation. T. Mote was supported by National Science Foundation #1900324. Sentinel-3 SICE data processing via PolarView.org is made possible by the European Space Agency (ESA) Network of Resources. Summit Station is owned and operated by the National Science Foundation Office of Polar Programs with permission from the Government of Greenland.
References
Alley, R. B., and S. Anandakrishnan, 1995: Variations in melt-layer frequency in the GISP2 ice core: implications for Holocene summer temperatures in central Greenland. Ann. Glaciol., 21, 64-70, https://doi.org/10.3189/S0260305500015615.
Andersen, J. K., and Coauthors, 2019: Update of annual calving front lines for 47 marine terminating outlet glaciers in Greenland (1999-2018). GEUS Bull., 43, http://doi.org/10.34194/GEUSB-201943-02-02.
Box, J. E., D. van As, and K. Steffen, 2017: Greenland, Canadian and Icelandic land ice albedo grids (2000-2016). GEUS Bull., 38, 53-56, https://doi.org/10.34194/geusb.v38.4414.
IMBIE Team, 2020: Mass balance of the Greenland Ice Sheet from 1992 to 2018. Nature, 579, 233-239, http://doi.org/10.1038/s41586-019-1855-2.
IPCC, 2021: Climate Change 2021: The Physical Science Basis. Contribution of Working Group I to the Sixth Assessment Report of the Intergovernmental Panel on Climate Change [V. Masson-Delmotte and Co-editors], Cambridge University Press, in press.
Kokhanovsky, A., J. E. Box, B. Vandecrux, K. D. Mankoff, M. Lamare, A. Smirnov, and M. Kern, 2020: The determination of snow albedo from satellite measurements using fast atmospheric correction technique. Remote Sens., 12, 234, https://doi.org/10.3390/rs12020234.
Mankoff, K. D., and Coauthors, 2020a: Greenland liquid water discharge from 1958 through 2019. Earth Syst. Sci. Data, 12, 2811-2841, https://doi.org/10.5194/essd-12-2811-2020.
Mankoff, K. D., A. Solgaard, W. Colgan, A. P. Ahlstrøm, S. A. Khan, and R. S. Fausto, 2020b: Greenland ice sheet solid ice discharge from 1986 through March 2020. Earth Syst. Sci. Data, 12, 1367-1383, https://doi.org/10.5194/essd-12-1367-2020.
Mankoff, K. D., and Coauthors, 2021: Greenland ice sheet mass balance from 1840 through next week. Earth Syst. Sci. Data, 13, 5001-5025, https://doi.org/10.5194/essd-13-5001-2021.
Moon, T. A., A. S. Gardner, B. Csatho, I. Parmuzin, and M. A. Fahnestock, 2020: Rapid reconfiguration of the Greenland ice sheet coastal margin. J. Geophys. Res.-Earth, 125, e2020JF005585, https://doi.org/10.1029/2020JF005585.
Morlighem, M., and Coauthors, 2017: BedMachine v3: Complete bed topography and ocean bathymetry mapping of Greenland from multibeam echo sounding combined with mass conservation. Geophys. Res. Lett., 44(21), 11051-11061, https://doi.org/10.1002/2017GL074954.
Mote, T. L., 2007: Greenland surface melt trends 1973-2007: Evidence of a large increase in 2007. Geophys. Res. Lett., 34, L22507, https://doi.org/10.1029/2007GL031976.
van As, D., R. S. Fausto, J. Cappelen, R. S. van de Wa, R. J. Braithwaite, H. Machguth, and PROMICE project team, 2016: Placing Greenland ice sheet ablation measurements in a multi-decadal context. GEUS Bull., 35, 71-74, https://doi.org/10.34194/geusb.v35.4942.
Wehrlé, A., J. E. Box, A. M. Anesio, and R. S. Fausto, 2021: Greenland bare ice albedo from PROMICE automatic weather station measurements and Sentinel-3 satellite observations. GEUS Bull., 47, https://doi.org/10.34194/geusb.v47.5284.
November 17, 2021