
J. E. Overland1, E. Hanna2, I. Hanssen-Bauer3, S. -J. Kim4, J. E. Walsh5, M. Wang6, U. S. Bhatt7, R. L. Thoman8
1NOAA/Pacific Marine Environmental Laboratory, Seattle, WA, USA
2School of Geography and Lincoln Centre for Water and Planetary Health, University of Lincoln, Lincoln, UK
3Norwegian Meteorological Institute, Blindern, Oslo, Norway
4Korea Polar Research Institute, Incheon, Republic of Korea
5International Arctic Research Center, University of Alaska Fairbanks, Fairbanks, AK, USA
6Joint Institute for the Study of the Atmosphere and Ocean, University of Washington, Seattle, WA, USA
7Geophysical Institute, University of Alaska Fairbanks, Fairbanks, AK, USA
8NOAA, National Weather Service, Alaska Region, Anchorage, AK, USA
Highlights
- The average annual surface air temperature over land north of 60° N for October 2017-September 2018 was the second warmest (after 2015-16) in the observational record beginning in 1900. Arctic temperatures for the past five years (2014-18) all exceed previous records.
- Arctic air temperature continues to increase at double the rate of the global mean air temperature increase.
- Relatively warm autumn, winter and spring months were related to an influx of heat and moisture from the subarctic, facilitated by north-south wavy jet stream patterns.
- During summer, neutral temperature anomalies occurred across the central Arctic Ocean and, like summer 2016 and 2017, did not support rapid summer sea ice and ice sheet loss.
Arctic surface air temperature is an indicator of both regional and global climate change. Although there are year-to-year and regional differences in air temperatures driven by natural variability, the magnitude, year-to-year persistence, and Arctic-wide character of recent temperature increases is a major indicator of global climate change and the concentration of atmospheric greenhouse gases (Overland, 2009; Notz and Stroeve, 2016). Warming atmospheric temperatures also act as the driver of broader Arctic change in the terrestrial and ocean spheres. A linear relationship between global temperature change and Arctic sea ice area decline and suggest direct forcing (Mahlstein and Knutti, 2012). Tundra and glacier responses also appear as forced changes from temperature increases. We report on the spatial and temporal variability of Arctic air temperatures during the period October 2017 through September 2018, the 12-month period since the end of the previous reporting period in Arctic Report Card 2017.
Mean Annual Land Surface Air Temperature
At +1.7° C, the mean annual surface air temperature (SAT) anomaly for October 2017-September 2018 for land stations north of 60° N is the second highest value (after 2016) in the record starting in 1900 (Fig. 1). Currently, the Arctic is warming at more than twice the rate of global mean temperatures; a phenomenon known as Arctic Amplification (Fig. 1). Recorded annual mean Arctic temperatures over the past five years (2014-18) all exceed previous records.
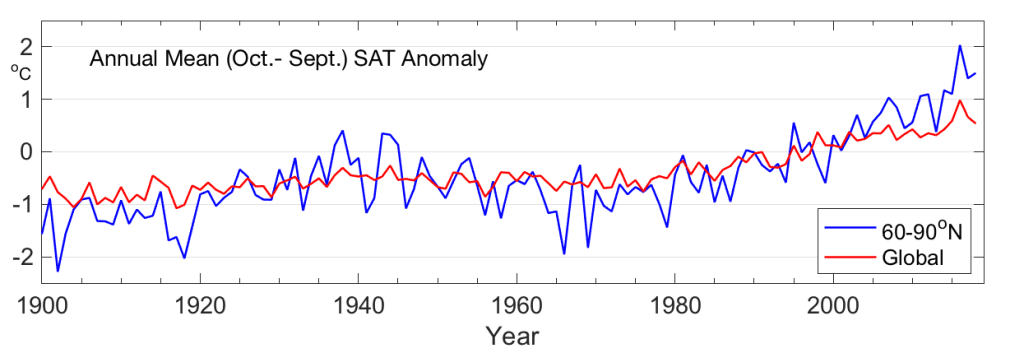
Currently there is no consensus on understanding the full reasons for Arctic amplification. Proposed mechanisms for Arctic amplification include: reduced summer albedo due to sea ice and snow cover loss; the increase of total water vapor content in the Arctic atmosphere; changes in cloudiness, and changes in pollution (Pithan and Mauritsen, 2014; Kim et al., 2017; Acosta Navarro et al., 2016; Dufour et al., 2016).
Air Temperature Variation
Seasonal air temperature variations are divided into autumn 2017 (October, November, December [OND]), and winter (January, February, March [JFM]), spring (April, May, June [AMJ]), and summer (July, August, September [JAS]) of 2018 (Fig. 2). These seasonal SAT divisions are chosen to coincide with the seasonal cycles of key Arctic variables: summer sea ice minimum occurs in September and autumn cooling continues through December.

All autumn, winter and spring months showed extensive central Arctic warm temperatures, often more than +4° C above the long-term norms (1981-2010). Large scale weather patterns in the central Arctic, such as the Arctic Oscillation (AO), were generally weak, while those of the subarctic (North Atlantic Oscillation [NAO] and Pacific North American [PNA]) had large values and month to month variability. As a result, large amounts of heat and moisture were transported northward into the Arctic. These weather patterns contributed to especially warm conditions between Greenland and Svalbard and in the Chukchi Sea. Summer 2018, similar to 2016 and 2017, had near-average air temperatures (relative to the 1981-2010 climatology) associated with low pressure systems and extensive cloudiness. Details about the seasonal air temperature variations in 2018 are provided below.
Autumn 2017 (OND). A broad swath of extreme warm temperature anomalies (> +4° C) stretched across the central Arctic (Fig. 2a). The warmest temperature extremes, north of Bering Strait and near the North Pole on the Atlantic side, were due to a combination of local heating from extensive open water and advection of warm air from the Pacific and Atlantic oceans (see subarctic weather patterns, below). Over the land area, the extreme warm temperature anomalies over a large portion eastern Russia made the autumn 2017 the warmest season observed (Fig. 2a). The North Slope and western Alaska had the warmest autumn of record (since 1925). In Svalbard the temperature anomaly relative to 1981-2010 was +5° C. Eastern Asia and eastern North America had extensive spells of cold weather in December.
Winter 2018 (JFM). Winter continued with a similar central Arctic and regional temperature pattern as autumn (Fig. 2b), but the temperature anomaly over most of the land area tended to be near neutral. The northern Bering Sea and Svalbard were particularly warm, and contributed to low sea ice (see essay on Sea Ice). The temperature anomaly over Svalbard in January and February exceeded +7° C at most stations. Europe had particularly cold conditions in March, referred to as the “beast from the east.” Finland and Norway had the coldest March during the last 5 years, northern Greenland was warm in February, and the UK had the coldest March day in 100 years.
Spring 2018 (AMJ). Spring (Fig. 2c) showed warm temperature anomalies especially in the East Siberian Sea, as also seen during 2017. This regional warming supported early sea ice loss in the Chukchi Sea (see essay on Sea Ice). Europe was particularly warm, while Iceland had cold and rainy conditions (Trausti Jonsson, Icelandic Met Office, pers. comm.) In May 2018, the mean temperature in Finland of +11.6° C was the highest in the instrumental record (dating from the early 1900s), which exceeds the previous record from 1963 by 0.5° C (Timo Vihma, Finnish Meteorological Institute, pers. comm.). The mean May temperature for Norway was the highest in the time series which starts in 1900, and 1.7° C above the previous record (from 2013). May 2018 was also record warm at all regular Svalbard meteorological stations, including the composite series from Longyearbyen, starting in 1898 (Nordli et al., 2014).
Summer 2018 (JAS). Like summer 2016 and 2017, summer 2018 contrasted with the warm conditions observed in much of the previous decade (Fig. 2d). Neutral anomalies occurred across the central Arctic in summer 2018, which did not support continued overall rapid summer sea ice loss (see essay on Sea Ice). The July temperature anomalies for the Spitsbergen stations Longyearbyen and Ny-Alesund were below +1° C, while the precipitation was record high. The east Siberian and Beaufort Seas were 3° C colder in July 2018 than in 2017. June and July 2018 Greenland temperatures were typically within 0.5 to 1° C over the long-term (1961-90) monthly means; not a notably warm summer by recent standards (see essay on Greenland). Scandinavia and eastern Asia had extensive warm spells. In July, the average temperature anomaly for Norway was +4° C while the precipitation anomaly was -40%. Norway and Sweden had extensive forest fires. Seoul in eastern Asia experienced a heat wave with 39° C during August.
Geopotential Heights and Resulting Regional Temperature Patterns
Atmospheric temperatures and pressures in 2018 provided additional evidence in support of Arctic-mid-latitude weather connections (see Frostbites essay on Mid-latitude Weather).
Warm temperature conditions in the Arctic in autumn 2017 through spring 2018 had a contribution from southerly winds (from the south) that advected warm moist air into the Arctic from the Atlantic and Pacific. This transport of warm, moist air was related to an active subarctic jet stream weather pattern that formed due to weak Arctic Oscillation (AO) conditions in the central Arctic during October through April (http://www.cpc.ncep.noaa.gov/products/precip/CWlink/daily_ao_index/ao.shtml). Weather patterns in the subarctic driven by the North Atlantic Oscillation (NAO) and Pacific North American (PNA) climate modes were active in 2018. The NAO was strongly positive December through June (except March), which resulted in deep Icelandic low pressures that drove a strong southerly wind pattern extending into the Arctic. These hemispheric atmospheric patterns are characterized by their wavy nature around a latitude circle and are quantified by the number of wave features at a given time along a latitudinal path.
Figure 3a shows the persistent pattern in the geopotential height field (used to characterize atmospheric wind circulation) for autumn months. Winds tend to follow the contours of geopotential heights counter-clockwise around low values. Autumn is characterized by a wave number three pattern (Fig. 3a) shown by the three centers of low geopotential height (dark purple regions). The southerly winds on the east side of each low geopotential height region brought warm air into the Arctic (north of Barents Sea, over Alaska, and on the west side of Greenland). From December 2017 to early January 2018, cold air from the Arctic was delivered to eastern Canada and USA resulting in extreme cold spells (Fig. 3a; see essay on Mid-latitude Weather). The rest of 2018 has shown greater month-to-month variability in wavy weather patterns.
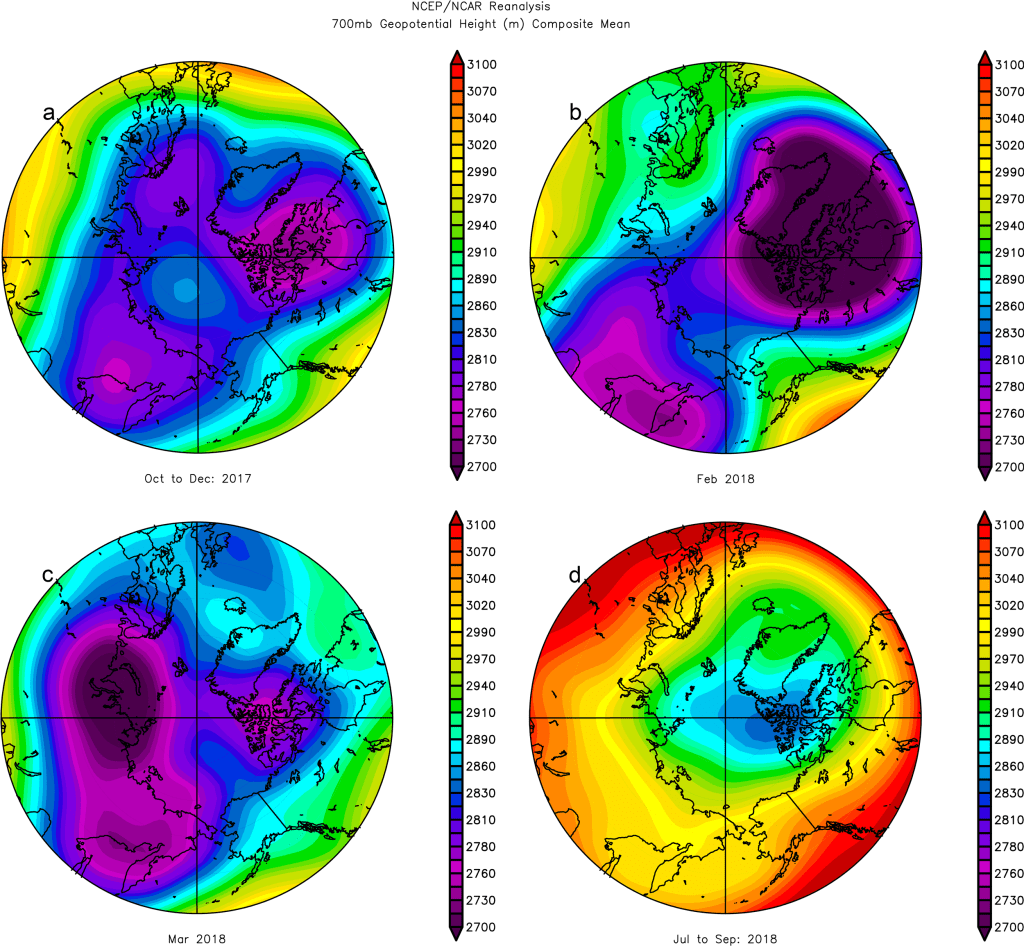
In February, there was a reduction in low pressure zones and a shift to a wave number two pattern (Fig 3b). Strong warm winds from the south over the Bering Sea related to a strong wavy jet stream pattern over Alaska that greatly retarded sea ice extent (see essay on Sea Ice) and moved warm air northward along the date line into the central Arctic. In March (Fig. 3c) the large scale pattern shifted to a wave number one pattern with low geopotential heights over Asia and western Russia and higher geopotential heights over North America and Greenland. The gradient between geopotential heights in central Eurasia and Scandinavia produced strong northerly winds and severe cold weather over Europe, a weather abnormality called the “Beast from the East” (see essay on Mid-latitude Weather).
Summer was characterized by low geopotential heights in the central Arctic (Fig 3d), which prevented atmospheric mid-latitude heat from penetrating into the central Arctic. This condition in summer 2018 differed from previous years and associated low sea-ice summers and contributed to a slowing of the sea ice loss in summer 2018 (see essay on Sea Ice). Low central Arctic pressure also resulted in widespread cloud cover as seen in satellite observations that limited the solar heating of the lower atmosphere in the central Arctic. Again, this is a pattern differed from recent previous years and was instead similar to the predominant pattern in 1996, which was a high summer sea ice extent year.
References
Acosta Navarro, J. C., V. Varma, I. Riipinen, Ø. Seland, A. Kirkevåg, H. Struthers, T. Iversen, H. -C. Hansson, and A. M. L. Ekman, 2016: Amplification of Arctic warming by past air pollution reductions in Europe. Nat. Geosci., 9, 277-281.
Dufour, A., O. Zolina, and S. K. Gulev, 2016: Atmospheric moisture transport to the Arctic. J. Clim., 29, 5061-5081.
Kim, B. -M., S. -W. Son, S. -K. Min, J. -H. Jeong, S. -J. Kim, X. Zhang, T Shim, and J. -H. Yoon, 2014: Weakening of the stratospheric polar vortex by Arctic sea-ice loss. Nat. Commun., 5, 4646, doi: 10.1038/ncomms5646.
Kim, B. -M., J. -Y. Hong, S. -Y. Jun, X. Zhang, H. Kwon, S. -J. Kim, J. -H. Kim, S. -W. Kim, and H. -K. Kim, 2017: Major cause of unprecedented Arctic warming in January 2016: Critical role of Atlantic windstorm. Sci. Rep., 7, 40051, doi: 10.1038/srep40051.
Mahlstein, I., and R. Knutti, 2012: September Arctic sea ice predicted to disappear near 2° C global warming above present. J. Geophys. Res. Atmos., 117, D06104, doi: 10.1029/2011JD016709.
Nordli, Ø., R. Przybylak, A. E. J. Ogilvie, and K. Isaksen, 2014: Long-term temperature trends and variability on Spitsbergen: The extended Svalbard Airport temperature series, 1898-2012. Polar Res., 33(1), 21349, doi: 10.3402/polar.v33.21349.
Notz, D., and J. Stroeve, 2016: Observed Arctic sea-ice loss directly follows anthropogenic CO2 emission. Science, 354, 747-750, doi: 10.1126/science.aag2345.
Overland, J. E., 2009: The case for global warming in the Arctic, in Influence of Climate Change on the Changing Arctic and Sub-Arctic Conditions. J. C. J. Nihoul and A. G. Kostianoy, Eds., Springer, pp. 13-23.
Pithan, F., and T. Mauritsen, 2014: Arctic amplification dominated by temperature feedbacks in contemporary climate models. Nat. Geosci., 7, 181-184, doi: 10.1038/ngeo2071.
November 13, 2018