

M. Tedesco1,2, J. E. Box3, J. Cappelen4, R. S. Fausto3, X. Fettweis5, J. K. Andersen3, T. Mote6, C. J. P. P. Smeets7, D. van As3, R. S. W. van de Wal7
1Lamont Doherty Earth Observatory of Columbia University, Palisades, NY, USA
2NASA Goddard Institute of Space Studies, New York, NY, USA
3Geological Survey of Denmark and Greenland, Copenhagen, Denmark
4Danish Meteorological Institute, Copenhagen, Denmark
5University of Liege, Liege, Belgium
6Department of Geography, University of Georgia, Athens, GA, USA
7Institute for Marine and Atmospheric Research Utrecht, Utrecht University, Utrecht, The Netherlands
Highlights
- Estimates of the spatial extent of melt across the Greenland ice sheet (GrIS) were unexceptional for most of the summer (i.e., June, July, August) melt season of 2018.
- Surface ice mass balance for the 2017/18 season was below or near the long-term mean (relative to the period 1961-90), consistent with a snow cover that survived late into the spring and average/low surface melting during summer.
- Summer 2018 albedo (a measure of surface reflectivity), averaged over the whole ice sheet, tied with the record high set in 2000 for the 2000-18 period. Relatively high albedo was associated with the reduced surface melting and extended survival of the snow cover, which reduced the exposure of darker, bare ice.
- Surface air temperatures set new high records in winter (up to +14.4° C above the mean) and low records in summer (-46.3° C at Summit).
The Greenland ice sheet plays a crucial role on our planet and in the Arctic. The high albedo (i.e., the fraction of incident solar radiation reflected by a surface) of the ice sheet contributes to modulating the amount of solar energy absorbed by the Earth and controls atmospheric circulation because of its location and topography. Moreover, Greenland represents a major contributor to current and projected sea level rise, through surface runoff and calving.
Surface Melting
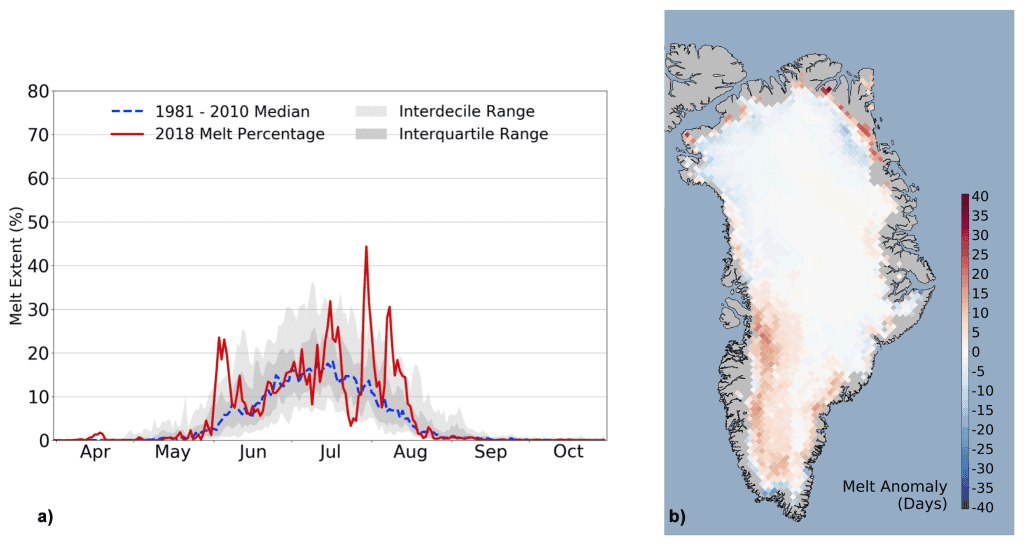
Estimates of the spatial extent of melt across the Greenland ice sheet (GrIS) were unexceptional for most of summer melt season of 2018. Observations derived from brightness temperatures (a measure of a body’s natural radiance) measured by the Special Sensor Microwave Imager/Sounder (SSMIS) passive microwave radiometer (e.g., Mote, 2007; Tedesco et al., 2013), indicated that melt extent exceeded (i.e., conditions were warmer) by one standard deviation in early June and again briefly in late July and early August (Fig. 1a). During the middle of the season, from mid-June to mid-July, the spatial extent of melting remained largely within the interquartile range of the 1981-2010 mean. The spatial extent of melt for the period of June, July, and August (JJA) 2018 was above average on only 26% of the summer days. During the same period of 2017, another low melt year, only 16% of days were above the average. Surface melt reached its maximum extent in 2018 (44%) on 31 July (Fig. 1a), compared to an average maximum extent of 39.8% (standard deviation of 14.9%) over the summer. Compared to previous summers, melt duration was within ±5 days of the mean for most of the ice sheet. There were notable exceptions in the southwest portion and along a thin margin in the northeast of the ice sheet, where melting was more frequent than the 1981-2010 mean (Fig. 1b) by more than 5 days.
Surface Ice Mass Balance
Net ice ablation (i.e., loss) in 2018, measured at 18 Program for Monitoring of the Greenland Ice Sheet (PROMICE, https://www.promice.dk/home.html) sites, was on average the lowest during the 2008-18 observational period (Fig. 2a). The southern and northern Greenland ice sheet margin (sites KPC: 79.91° N, 24.08° W; THU: 76.39° N, 68.26° W; and QAS: 61.03° N, 46.84° W) experienced the most negative anomalies (least ablation) spanning 1.3-1.9 standard deviations below the 2008-18 mean, while ablation at the other sites was within 1 standard deviation. The observed ablation values from the lower PROMICE stations, referenced to the 1961-90 climate-standard period, showed that anomalies at the KPC and THU sites were the most negative (least ablation), beyond methodological uncertainty (van As et al., 2016). Only two of eight sites (NUK: 64.48° N, 49.53° W and KAN: 67.12° N, 50.18° W) experienced above-average ablation, though not beyond methodological uncertainty.
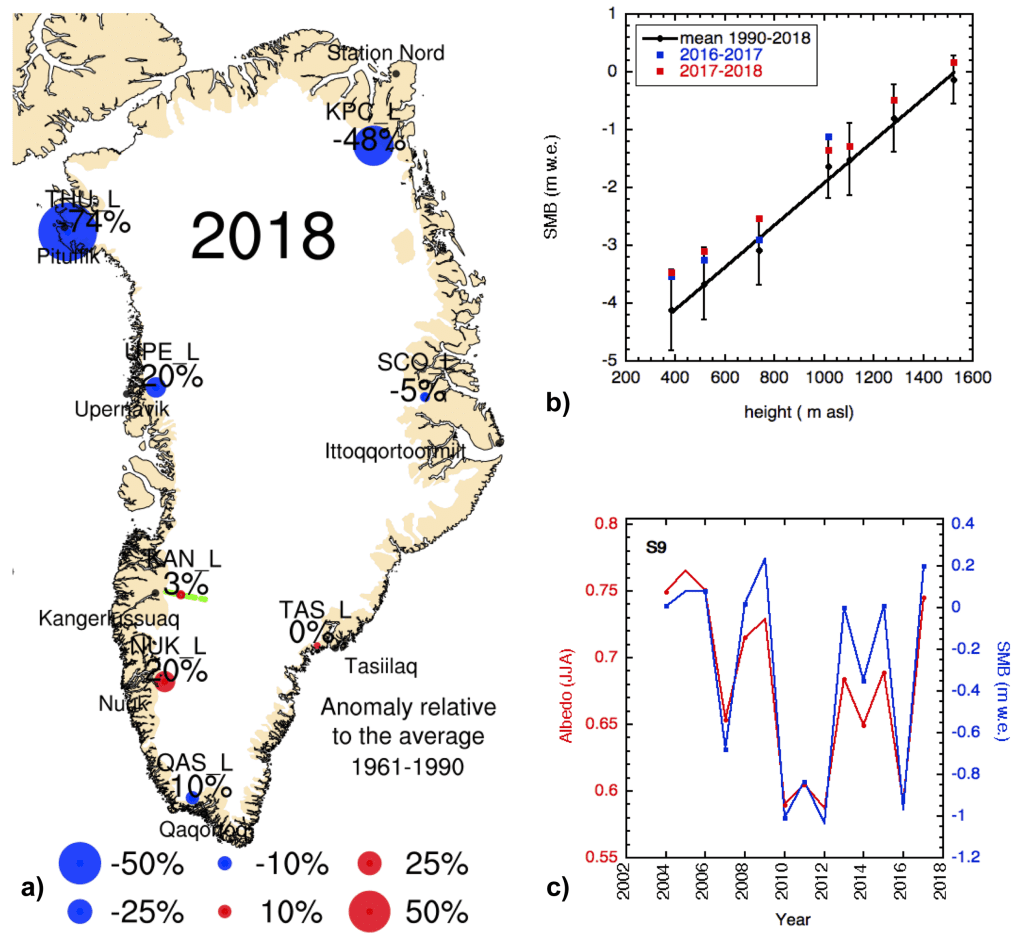
The mass balance year 2017/18 along the K-transect (van de Wal et al., 2012) is characterized by moderate ablation over the entire ablation region (e.g., where net mass loss occurs). All sites show a surface mass balance within one standard deviation from the 1990-2018 mean, with a tendency of ablation being below the mean (Fig. 2b). The average surface mass balance over the K-transect for 2017/18 is nearly identical to the average over the season 2016/17. Overall, surface ice mass balance for the 2017/18 season was below or near the long-term mean (relative to the period 1961-90), consistent with a snow cover that survived late into the spring and average/low surface melting during summer.
Total Ice Mass Balance
GRACE satellite data can be used to estimate monthly changes in the total mass of the Greenland ice sheet, as done in the past (e.g., Tedesco et al., 2017). However, the NASA GRACE mission, which started in 2002, ended in October 2017. Hence, there are no data available on the total mass balance for the 2017/18 season. The GRACE Follow On (GRACE-FO, https://gracefo.jpl.nasa.gov/) mission was launched on 22 May 2018. Data acquired since its launch are currently under review for quality control. The May 2018 launch means that no data are available from space between October 2017 and May 2018. Processing of the GRACE-FO dataset will provide estimates of total mass change anomalies for the summer of 2018 and will be calibrated to data acquired by GRACE.
Albedo
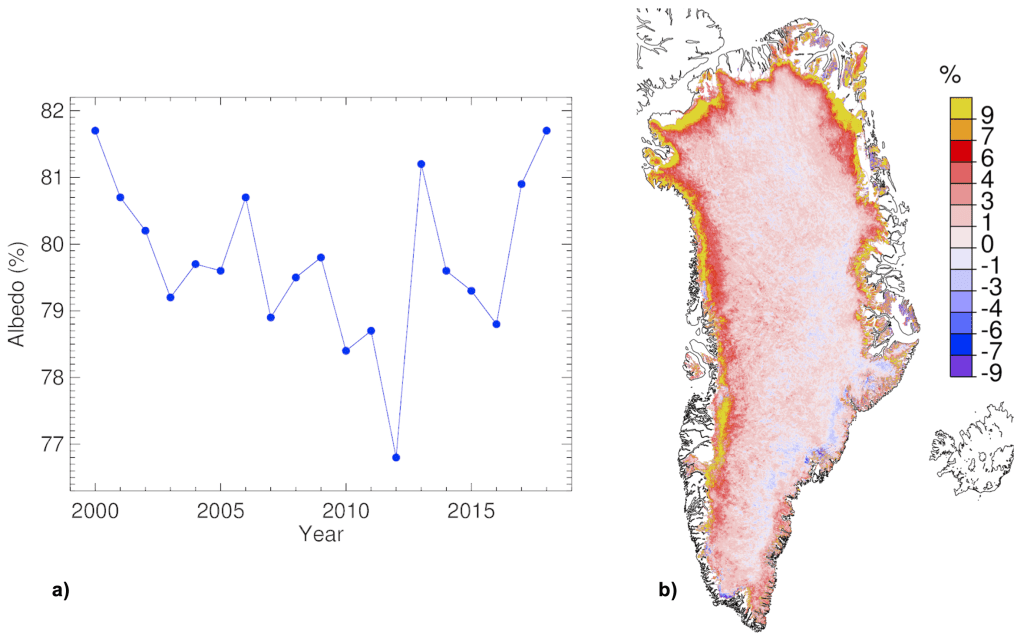
The summer (JJA) 2018 albedo averaged over the whole Greenland ice sheet was 81.7% (Fig. 3a), as estimated from the Moderate Resolution Imaging Spectroradiometer (MODIS; after Box et al., 2017). The 2018 summer albedo is tied with 2000 for the highest value recorded during the 19-year MODIS period of observation (i.e., 2000-18). The months of June and July had record high albedo. The high albedo anomalies along most of the coastline (Fig. 3b) are consistent with reduced melting in summer 2018, which resulted in late surviving snow over the darkest bare ice areas. The minimum average summer albedo was recorded in 2012 (76.8%), the year of record maximum melt extent. Albedos have been relatively high since 2012. Consistently with MODIS estimates, measurements at the S9 K-transect station show higher than usual albedo values (Fig. 2c), which are also strongly correlated with the surface mass balance values measured at the same location. In summary, summer 2018 albedo, averaged over the whole ice sheet, was relatively high for the 2000-18 period, matching the value of the record high set in 2000.
Surface Air Temperature
Measurements at 20 weather stations of the Danish Meteorological Institute (DMI, Cappelen, in prep.) indicate widespread above or near-average air temperatures for autumn 2017 and winter 2017/18, relative to the average for the period 1981-2010. Some record highs were set for winter and also in some individual winter months (Table 1). At Station Nord, the world’s northernmost station, temperatures at Kap Morris Jesup were remarkably warm in February, reaching up to +14.4° C above the mean; an absolute temperature of +6.2° C was reached on 25 February. Spring 2018 was generally near average except in some places along eastern Greenland, where temperatures were above normal. Summer 2018 was generally colder or near average. A new record-breaking high temperature of +17° C was measured at Kap Morris Jesup on 3 August, surpassing the previous one of +15.4° C set on 5 August 1991. At Summit, the highest point on the ice cap, autumn 2018 was the third warmest, after 1993 and 2002. A new record-breaking cold temperature record, -46.3° C, was measured at Summit on 9 May, close to the previous one of -45.6° C set on 1 May.
| Station Name, Start Year, Latitude, Longitude |
SON 2017 |
DJF 17/18 |
MAM 2018 |
JJA 2018 |
Station Name, Start Year, Latitude, Longitude |
SON 2017 |
DJF 17/18 |
MAM 2018 |
JJA 2018 |
||
|---|---|---|---|---|---|---|---|---|---|---|---|
| Pituffik/Thule AFB 1948, 76.5° N, 68.8° W |
Anomaly [°C] |
1.4 | 2.7 | -0.9 | -0.4 | Ivittuut/Narsarsuaq 1873, 61.2° N, 45.4° W |
Anomaly [°C] |
0.9 | 0.3 | 0.1 | -0.8 |
| z-score | 0.9 | 0.9 | -0.8 | -0.4 | z-score | 0.9 | 0.2 | -0.1 | -0.3 | ||
| Max Year | 2010 | 1986 | 1953 | 1957 | Max Year | 2010 | 2010 | 2010 | 2016 | ||
| Min Year | 1964 | 1949 | 1992 | 1996 | Min Year | 1874 | 1984 | 1989 | 1873 | ||
| Station Nord 1961, 81.6° N, 16.7° W |
Anomaly [°C] |
2.2 | 6.3 | 0.6 | -1.1 | Qaqortoq 1807, 60.7° N, 46.1° W |
Anomaly [°C] |
0.7 | -0.2 | -0.3 | -0.4 |
| z-score | 1.2 | 2.7 | 0.6 | -0.8 | z-score | 1.0 | 0.2 | -0.3 | -0.2 | ||
| Max Year | 2016 | 2018 | 2006 | 2003 | Max Year | 2010 | 2010 | 1932 | 1929 | ||
| Min Year | 1989 | 1967 | 1961 | 1970 | Min Year | 1874 | 1863 | 1811 | 1811 | ||
| Upernavik 1873, 72.8° N, 56.1° W |
Anomaly [°C] |
0.7 | 2.2 | -0.2 | -1.6 | Danmarkshavn 1949, 76.8° N, 18.7° W |
Anomaly [°C] |
4.4 | 5.0 | -0.4 | -0.9 |
| z-score | 0.7 | 0.7 | -0.2 | -0.7 | z-score | 2.6 | 2.5 | -0.1 | -1.2 | ||
| Max Year | 2010 | 1947 | 1932 | 2012 | Max Year | 2016 | 2018 | 1976 | 2016 | ||
| Min Year | 1917 | 1983 | 1896 | 1873 | Min Year | 1971 | 1967 | 1966 | 1955 | ||
| Kangerlussuaq 1949, 67.0° N, 50.7° W |
Anomaly [°C] |
0.7 | -0.2 | -0.2 | -0.2 | Ittoqqortoormiit 1949, 70.5° N, 22.0° W |
Anomaly [°C] |
3.6 | 3.7 | 1.7 | -0.6 |
| z-score | 0.4 | -0.2 | -0.1 | -0.5 | z-score | 2.2 | 1.7 | 1.2 | 0.4 | ||
| Max Year | 2010 | 1986 | 2016 | 1960 | Max Year | 2016 | 2014 | 1996 | 2016 | ||
| Min Year | 1982 | 1983 | 1993 | 1983 | Min Year | 1951 | 1966 | 1956 | 1955 | ||
| Ilulissat 1807, 69.2° N, 51.1° W |
Anomaly [°C] |
0.5 | 1.0 | 0.5 | -1.6 | Tasiilaq 1895, 65.6° N, 37.6° W |
Anomaly [°C] |
1.6 | 1.8 | 0.9 | 0.2 |
| z-score | 0.8 | 0.6 | 0.3 | -0.7 | z-score | 1.5 | 1.1 | 0.5 | 0.0 | ||
| Max Year | 2010 | 1929 | 1847 | 1960 | Max Year | 1941 | 1929 | 1929 | 2016 | ||
| Min Year | 1837 | 1863 | 1813 | 1863 | Min Year | 1917 | 1918 | 1899 | 1983 | ||
| Aasiaat 1958, 68.7° N, 52.8° W |
Anomaly [°C] |
0.8 | 1.8 | 0.9 | -0.8 | Prins Christian Sund 1958, 60.1° N, 42.2° W |
Anomaly [°C] |
1.3 | -0.5 | 0.1 | 0.3 |
| z-score | 0.9 | 0.2 | 0.3 | -0.7 | z-score | 1.4 | -0.4 | 0.1 | 0.1 | ||
| Max Year | 2010 | 2010 | 2016 | 2012 | Max Year | 2010 | 2010 | 2005 | 2010 | ||
| Min Year | 1986 | 1984 | 1993 | 1972 | Min Year | 1982 | 1993 | 1989 | 1970 | ||
| Nuuk 1784, 64.2° N, 51.7° W |
Anomaly [°C] |
0.6 | -0.8 | 0.4 | 0.2 | Summit 1991, 72.6° N, 38.5° W |
Anomaly [°C] |
2.7 | -0.8 | 0.0 | 0.3 |
| z-score | 0.8 | -0.1 | 0.1 | 0.3 | z-score | 1.2 | -0.2 | 0.0 | 0.1 | ||
| Max Year | 2010 | 2010 | 1932 | 2012 | Max Year | 2002 | 2010 | 2016 | 2012 | ||
| Min Year | 1811 | 1818 | 1802 | 1819 | Min Year | 2009 | 1993 | 1992 | 1992 | ||
| Paamiut 1958, 62.0° N, 49.7° W |
Anomaly [°C] |
1.0 | 0.4 | 0.1 | 0.2 | ||||||
| z-score | 0.9 | -0.1 | 0.0 | 0.2 | |||||||
| Max Year | 2010 | 2010 | 2005 | 2010 | |||||||
| Min Year | 1982 | 1984 | 1993 | 1969 | |||||||
Consistent with net ablation observations and with DMI measurements, summer temperatures were below the 2008-18 average at all PROMICE sites by more than one standard deviation along the northern, north-western, and north-eastern slopes. July 2018 was the coldest in the 2008-18 period along the northern, north-western, and southern ice sheet ablation area. Out of all Jan-Aug 2018 station-months, 28% of monthly temperatures were more than one standard deviation below average, and only 3% were over one standard deviation above average.
Marine Terminating Glaciers
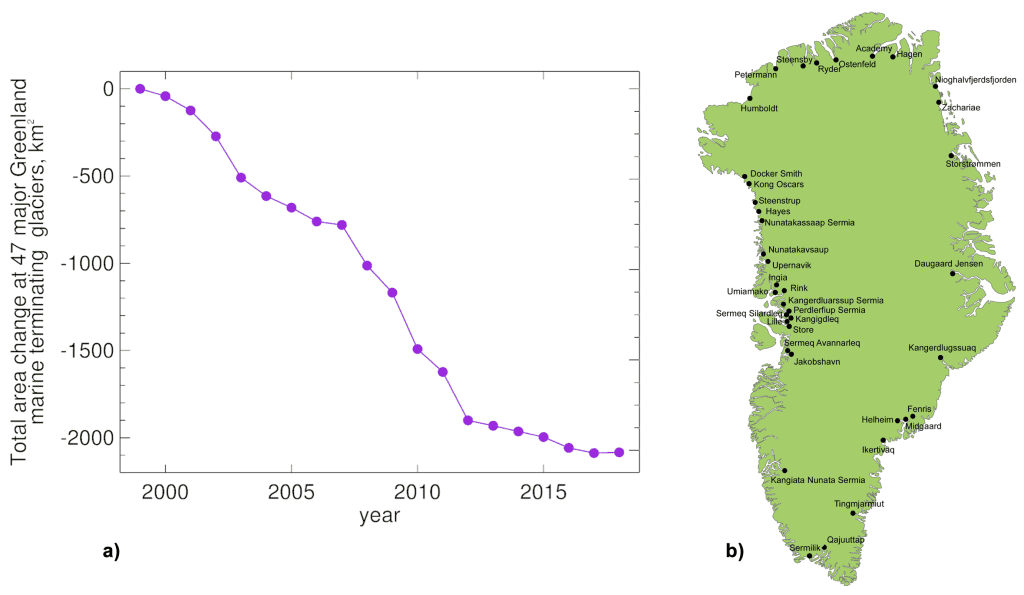
Marine-terminating glaciers are the outlets by which the Greenland ice sheet discharges ice mass to the ocean. When in balance, the rate of iceberg calving (by area) is balanced by the seaward ice flow. Glacier area measurements have been measured by Sentinel-2, LANDSAT and ASTER satellite imagery since 1999 (Box and Hansen, 2015). The 2017/18 net area change of the 47 surveyed glaciers, relative to the previous year, is +4.1 km2 and stands alone as the only year in the survey with an area gain (Fig. 4a). The next closely ranked year is 2006/07, when the net loss was -19.8 km2. The 2017/18 annual area change is 113.8 km2 less than the annual area loss per year averaged over the 19-year period of record (-109.7 km2 per year, 1999/2000 to 2017/18). Among the surveyed glaciers (Fig. 4b), 21 retreated and 12 advanced. The area changes at the remaining 14 glaciers were within ±0.2 km2. The largest single glacier area change in 2017/18 was an area loss at the Northwest Greenland Humboldt Glacier (-13.3 km2), followed by Kangerlussuaq Glacier (-8.1 km2) in East Greenland). Meanwhile, Petermann Glacier advanced (+19.1 km2), similar to the previous year (+11.5 km2). Greenland’s largest ice producer, Jakobshavn Glacier, continued its retreat by losing a front area of 2.6 km2 relative to the previous year. Helheim Glacier advanced 10.6 km2.
References
Box, J. E., and K. Hansen, 2015: Survey of Greenland glacier area changes. PROMICE Newsletter, 8, December 2015, http://promice.org/Newsletter.html.
Box, J. E., D. van As, and K. Steffen, 2017: Greenland, Canadian and Icelandic land ice albedo grids (2000-2016). Geol. Surv. Den. Greenl. Bull., 38, 53-56.
Cappelen, J. (Ed.), 2019: Greenland – DMI Historical Climate Data Collection 1784-2018. DMI Report 19. (in preparation)
Mote, T., 2007: Greenland surface melt trends 1973-2007: Evidence of a large increase in 2007. Geophys. Res. Lett., 34, L22507.
Nghiem, S. V., D. K. Hall, T. L. Mote, M. Tedesco, M. R. Albert, K. Keegan, C. A. Shuman, N. E. DiGirolamo, and G. Neumann, 2012: The extreme melt across the Greenland ice sheet in 2012. Geophys. Res. Lett., 39, L20502, doi: 10.1029/2012GL053611.
Tedesco, M., X. Fettweis, T. Mote, J. Wahr, P. Alexander, J. Box, and B. Wouters, 2013: Evidence and analysis of 2012 Greenland records from spaceborne observations, a regional climate model and reanalysis data. Cryosphere, 7, 615-630.
Tedesco, M., J. E. Box, J. Cappelen, R. S. Fausto; X. Fettweis, K. Hansen, T. Mote, I. Sasgen, C. J. P. P. Smeets, D. van As, R. S. W. van de Wal, and I. Velicogna, 2017: Greenland Ice Sheet [in Arctic Report Card 2017], https://www.arctic.noaa.gov/Report-Card.
van As, D., R. S. Fausto, J. Cappelen, R. S. W. Van de Wal, R. J. Braithwaite, H. Machguth, and PROMICE project team, 2016: Placing Greenland ice sheet ablation measurements in a multi-decadal context. Geol. Surv. Den. Greenl. Bull., 35, 71-74.
van de Wal, R. S. W., W. Boot, C. J. P. P. Smeets, H. Snellen, M. R. van den Broeke, and J. Oerlemans, 2012: Twenty-one years of mass balance observations along the K-transect, West-Greenland. Earth Syst. Sci. Data, 4, 31-35, doi: 10.5194/essd-4-31-2012.
November 14, 2018