
M. -L. Timmermans1, C. Ladd2
1Yale University, New Haven, CT, USA
2Pacific Marine Environmental Laboratory, NOAA, Seattle, WA, USA
Highlights
- August mean sea surface temperatures (SSTs) show statistically significant warming trends for 1982-2018 in most regions of the Arctic Ocean that are ice-free in August.
- Spatial patterns of August 2018 SST anomalies relative to the 1982-2010 August mean are linked to regional variability in sea-ice retreat, regional air temperature, and advection of waters from the Pacific and Atlantic oceans.
- Northern Barents Sea August mean SSTs show statistically significant cooling trends for 1982-2018, a result of sea ice conditions and ocean heat transport unique to this region.
Summer sea surface temperatures (SST) in the Arctic Ocean are driven mainly by the amount of incoming solar radiation absorbed by the sea surface. Solar warming of the Arctic surface ocean is influenced by the distribution of sea ice (with greater warming occurring in ice-free regions), cloud cover, water color, and upper-ocean stratification. In the Barents and Chukchi seas, there is an additional source of ocean heat contributed by the advection of warm water from the North Atlantic and North Pacific oceans, respectively. Arctic SSTs are an essential indicator of the role of the ice-albedo feedback mechanism in any given melt season. As the area of sea ice cover decreases, more incoming solar radiation is absorbed by the ocean and the warmer ocean, in turn, melts more sea ice. In addition, marine ecosystems are influenced by SST, which affects timing and developmental cycles of primary and secondary production as well as available habitat for individual species.
SST data presented here are from the NOAA Optimum Interpolation (OI) SST Version 2 product (OISSTv2), which is a blend of in situ and satellite measurements from December 1981 to present (Reynolds et al., 2002, 2007). Compared to in situ temperature measurements, the OISSTv2 product showed average correlations of about 80%, with an overall cold SST bias of -0.02° C (Stroh et al., 2015). August SSTs provide the most appropriate representation of Arctic Ocean summer SSTs because they are not affected by the cooling and subsequent sea-ice growth that typically takes place in the latter half of September.
Mean SSTs in August 2018 in ice-free regions ranged from ~0° C in some regions to as high as +11° C in the southern Chukchi and Barents seas (Fig. 1a). Compared to the 1982-2010 August mean, anomalously warm SSTs in August 2018 (around 1-3° C warmer than the 1982-2010 average) were observed in the Beaufort, Chukchi, Laptev, and southern Barents seas (Fig. 1b). Anomalously warm SSTs on the ice-free side of the 2018 August mean sea-ice edge are linked to anomalously early local sea ice retreat, which facilitated direct solar heating of the exposed surface waters (Fig. 1b). Conversely, the southern boundary of the Beaufort Sea in 2018 was marked by anomalously cool August SSTs (around 1-2° C cooler than the 1982-2010 average). These low SSTs are associated with unusually cool August 2018 air temperatures along the entire southern Beaufort Sea (see essay on Surface Air Temperature) and the persistence of sea ice in the region, maintained by northerly August winds in the region (see essay on Sea Ice). These factors were distinct from August 2017 conditions (milder air temperatures were recorded in August 2017; Arctic Report Card 2017 Surface Air Temperature), with the entire Beaufort Sea region exhibiting cooler August SSTs (up to 3.5° C cooler) in 2018 compared to 2017 (Fig. 1c).
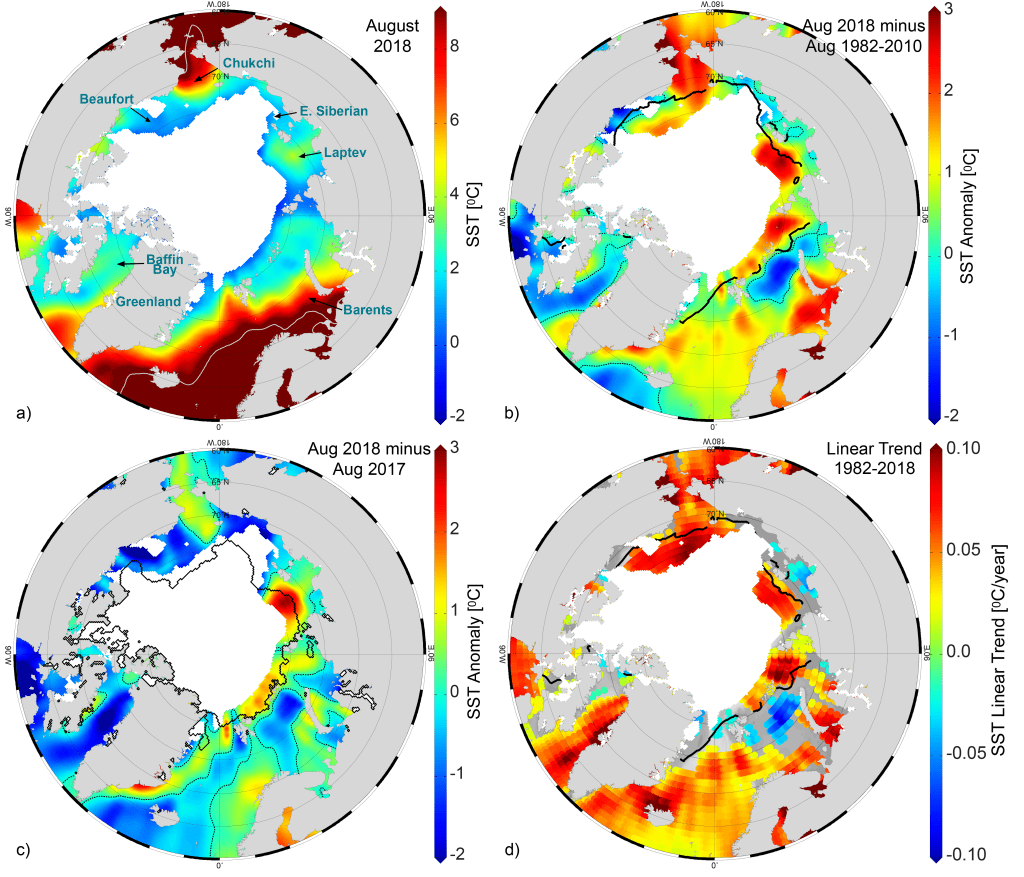
Mean August SSTs from 1982-2018 show warming trends over much of the Arctic Ocean; statistically significant (at the 95% confidence interval) linear warming trends of up to +1° C decade-1 are observed (Figs. 1d and 2). These warming trends coincide with declining trends in summer sea-ice extent (including late-season freeze-up and early melt, e.g., Parkinson, 2014), increased solar absorption (e.g., Timmermans et al., 2018), and increased vertical ocean heat transport (e.g., Lind et al., 2018). A marked exception to the prevalent August SST warming trend is the cooling trend (-0.06±0.03° C/yr) in the northern Barents Sea (Figs. 1d and 2). Related to this, the northern Barents Sea exhibited notably cool August 2018 SSTs, characterized by temperatures 1-2° C cooler than the 1982-2010 average (Fig. 1b), with August 2018 SSTs also around 1°C cooler than August 2017 (Fig. 1c). A statistically significant cooling trend in the northern Barents Sea is only observed for the months of August and September, with most other months (January to June) characterized by statistically significant warming trends (+0.03±0.01 °C/yr) over the same region. The result is that annually-averaged northern Barents Sea SSTs exhibit a warming trend (see e.g., Barton et al., 2018). A coupled ice-ocean numerical model study reveals subtle variability in spatial and seasonal trends in the Barents Sea region that appears to depend upon the interplay between sea-ice changes, local solar absorption and lateral ocean heat transport (Long and Perrie, 2017). These complex relationships in this important Arctic gateway region merit further study.

References
Barton, B. I., Y. Lenn, and C. Lique, 2018: Observed Atlantification of the Barents Sea causes the Polar Front to limit the expansion of winter sea ice. J. Phys. Oceanogr., 48, 1849-1866, doi: 10.1175/JPO-D-18-0003.1.
Fetterer, F., K. Knowles, W. Meier, M. Savoie, and A. K. Windnagel, 2017, updated daily: Sea Ice Index, Version 3. Boulder, Colorado USA. NSIDC: National Snow and Ice Data Center, doi: 10.7265/N5K072F8.
Lind, S., R. B. Ingvaldsen, and T. Furevik, 2018: Arctic warming hotspot in the northern Barents Sea linked to declining sea-ice import. Nat. Clim. Change, 8(7), 634-639, doi: 10.1038/s41558-018-0205-y.
Long, Z., and W. Perrie, 2017: Changes in ocean temperature in the Barents Sea in the twenty-first century. J. Clim., 30, 5901-5921, doi: 10.1175/JCLI-D-16-0415.1.
Parkinson, C. L., 2014: Spatially mapped reductions in the length of the Arctic sea ice season. Geophys. Res. Lett., 41, 4316-4322, doi: 10.1002/2014GL060434.
Reynolds, R. W., N. A. Rayner, T. M. Smith, D. C. Stokes, and W. Wang, 2002: An improved in situ and satellite SST analysis for climate. J. Clim., 15, 1609-1625.
Reynolds, R. W., T. M. Smith, C. Liu, D. B. Chelton, K. S. Casey, and M. G. Schlax, 2007: Daily high-resolution-blended analyses for sea surface temperature. J. Clim., 20, 5473-5496. (Data available at https://www.esrl.noaa.gov/psd/data/gridded/data.noaa.oisst.v2.html.)
Stroh, J. N., G. Panteleev, S. Kirillov, M. Makhotin, and N. Shakhova, 2015: Sea-surface temperature and salinity product comparison against external in situ data in the Arctic Ocean. J. Geophys. Res. Oceans, 120, 7223-7236, doi: 10.1002/2015JC011005.
Timmermans, M. -L., J. Toole, R. Krishfield, 2018: Warming of the interior Arctic Ocean linked to sea ice losses at the basin margins. Sci. Adv., 4(8) eaat6773, doi: 10.1126/sciadv.aat6773.
November 13, 2018