

D. Perovich1, W. Meier2, M. Tschudi3, S. Farrell4, S. Hendricks5, S. Gerland6, C. Haas5, T. Krumpen5, C. Polashenski1,7, R. Ricker5, M. Webster8
1Thayer School of Engineering, Dartmouth College, Hanover, NH, USA
2National Snow and Ice Data Center, Boulder, CO, USA
3Aerospace Engineering Sciences, University of Colorado, Boulder, CO, USA
4NOAA Earth System Science Interdisciplinary Center, University of Maryland, College Park, MD, USA
5Alfred Wegener Institute, Helmholtz Centre for Polar and Marine Research, Bremerhaven, Germany
6Norwegian Polar Institute, Fram Centre, Tromsø, Norway
7ERDC – CRREL, 72 Lyme Road, Hanover, NH, USA
8NASA Goddard Space Flight Center, Greenbelt, MD, USA
Highlights
- The Arctic sea ice cover continues the declining trends in the summer maximum and winter minimum extents. In 2018, the summer extent was the sixth lowest and the winter extent was the second lowest in the satellite record (1979-2018).
- There was the dearth of ice in the Bering Sea through the 2017/18 ice growth season.
Sea Ice Extent
Arctic sea ice cover varies substantially over the year, with end-of-winter ice cover generally being two to three times as large as at the end of summer. Sea ice is an important element of the Arctic system: (1) acting as a barrier between the underlying ocean and the atmosphere, (2) limiting the amount of absorbed solar energy during the summer due to its high albedo, (3) providing a habitat for biological activity, and (4) limiting human access to the Arctic Ocean. Sea ice extent has been monitored by passive microwave instruments on satellite platforms since 1979, providing a 39-year long perspective on changing coverage over the last several decades. The months of March and September are of particular interest in sea ice time-series because they represent typical Arctic sea ice maximum and minimum extents, respectively. Figure 1 maps monthly average ice extents in March and September 2018.
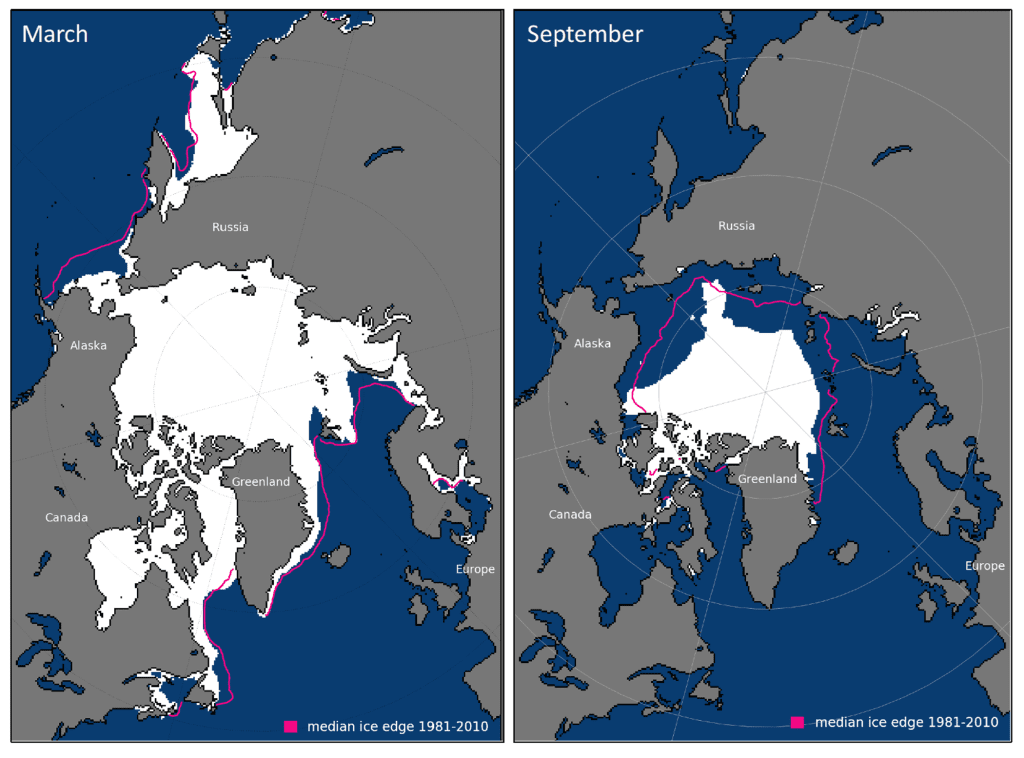
Sea ice extent estimates are based on products from by the National Snow and Ice Data Center (NSIDC) Sea Ice Index (Fetterer et al., 2012) from NASA gridded sea ice concentration fields (Cavalieri et al., 1996; Maslanik and Stroeve, 1999; Meier et al., 2012). The sea ice cover reached a winter maximum value extent of 14.48 million km2, on 17 March 2018. This was 7.3% below the 1981-2010 average and was the second lowest maximum extent recorded. The past four years (2015-18) have the four lowest maximums in the satellite record. The sea ice cover reached a minimum annual extent of 4.59 million km2 on 19 September and 23 September 2018. This was tied for the sixth lowest extent of the satellite record with 2008 and 2010 and was 1.63 million km2 (26%) less than the 1981-2010 average minimum ice extent. The 12 lowest extents in the satellite record have occurred in the last 12 years. The September ice extent has not returned to pre-2007 levels. The minimum occurred nine days later than the 1981-2010 median minimum date of 14 September and the 23 September minimum ties with 1997 for the latest minimum.
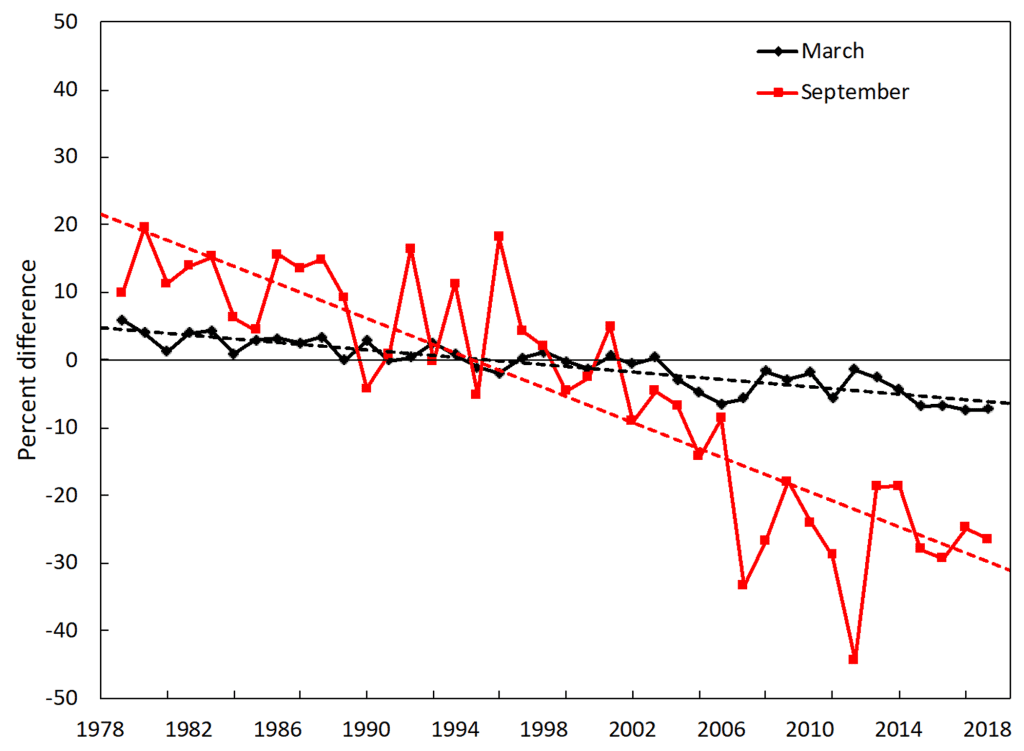
Observations of Arctic sea ice extent have shown decreasing trends in all months and virtually all regions (Meier et al., 2012). The September monthly average trend for the entire Arctic Ocean is now -12.8% per decade relative to the 1981-2010 average (Fig. 2). Trends are smaller during March (-2.7% per decade), but the decrease is statistically significant. In 2018, 9.89 million km2 of ice was lost between the March maximum and September minimum extent.
A notable feature of the 2018 summer melt season was the dispersed nature of parts of the ice cover. In particular, the pattern of sea ice loss resulted in an isolated patch of ice along the Alaskan coast that persisted through the summer despite being a few hundred kilometers from the main ice pack. In addition, a narrow band of ice extending from the main ice pack into the East Siberian Sea persisted through the summer. Both of these features were likely the result of concentrations of multiyear ice surrounded by thinner first-year ice.
Age of the Sea Ice
The age of sea ice is another descriptor of the state of the sea ice cover that serves as an indicator of physical ice properties, such as surface roughness, melt pond coverage and thickness (Tschudi et al., 2016) (Fig.3). The age of the ice is determined using satellite observations and drifting buoy records to track ice parcels over several years (Tschudi et al., 2010; Maslanik et al., 2011). This method has been used to provide a record of the age of the ice since the early 1980s (Tschudi et al., 2015).
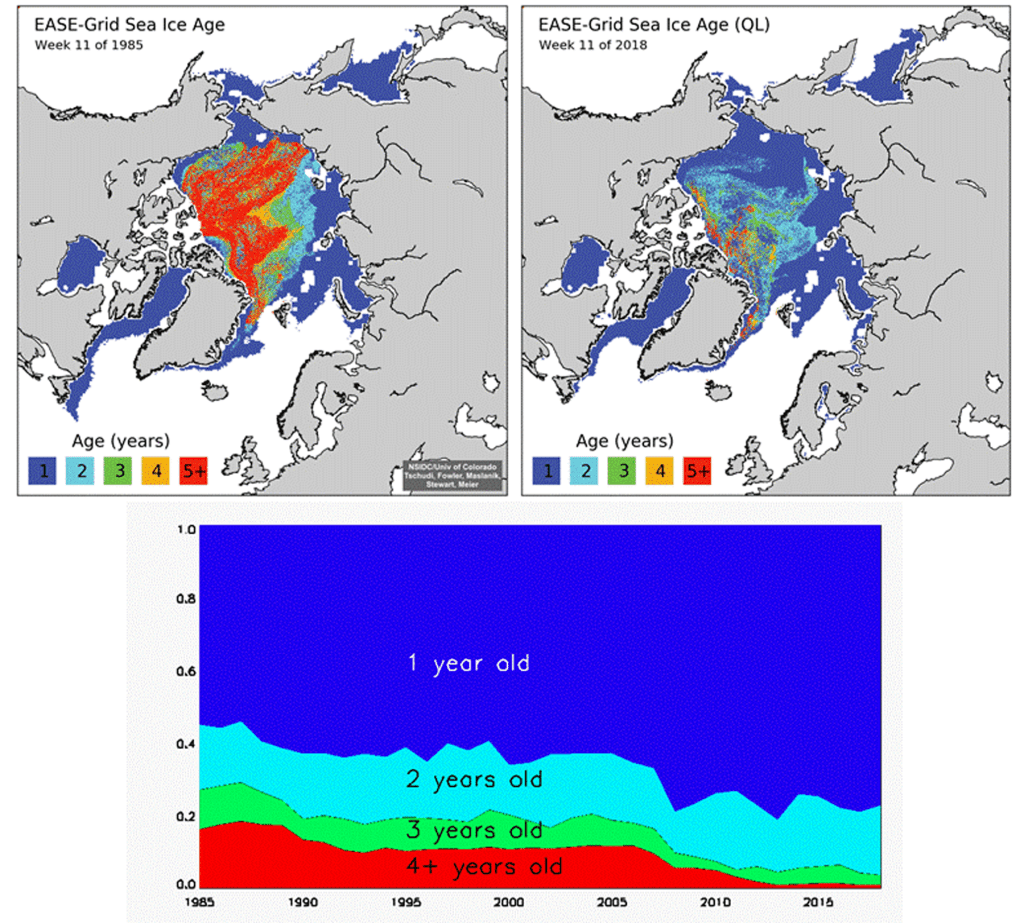
Older ice tends to be thicker and is thus more resilient to changes in atmospheric and oceanic heat content compared to younger, thinner ice. The oldest ice (>4 years old) continues to make up a small fraction of the Arctic ice pack in March, when the sea ice extent has been at its maximum in most years of the satellite record. In 1985, the oldest ice comprised 16% of the ice pack (Fig. 3a), whereas in March of 2018 old ice only constituted 0.9% of the ice pack (Fig.3b). Therefore, the oldest ice extent declined from 2.54 million km2 in March 1985 to 0.13 million km2 in March 2018, representing a 95% reduction.
First-year ice now dominates the ice cover, comprising ~77% of the March 2018 ice pack compared to about 55% in the 1980s. Given that older ice tends to be thicker, the sea ice cover has transformed from a strong, thick pack in the 1980s to a more fragile, younger. thinner, and more mobile pack in recent years (Fig. 3c). The thinner, younger ice is more vulnerable to melting out in the summer and has contributed to the decreasing trend in the minimum ice extent.
Sea Ice Thickness
The ESA CryoSat-2 radar altimeter completed its 8th year of operation since its launch in 2010, providing large-scale sea ice thickness observations between October and April (Laxon et al., 2013). The recent launch of NASA’s ICESat-2, a laser-based altimeter, will enhance large-scale measurements of sea ice thickness.
The CryoSat-2 observed a mean sea-ice thickness of 2.14 meters in the Arctic Basin (see insert in Fig. 4b) at the end of the 2017/18 winter season in April. This value is marginally lower than the average value measured over in the 2010-18 CryoSat-2 record (2.19 m), which ranges from 2.03 m to 2.29 m thickness. Figure 4a shows the mean sea-ice thickness anomaly for the winter of 2017/18 and indicates that thicknesses were above average in the East Siberian Sea shelf areas, coinciding with an elevated rate of ice convergence in early winter. In general, the eastern part of the Arctic basin shows above-average thicknesses with thinner ice in Fram Strait, Beaufort Sea, and Bering Strait.
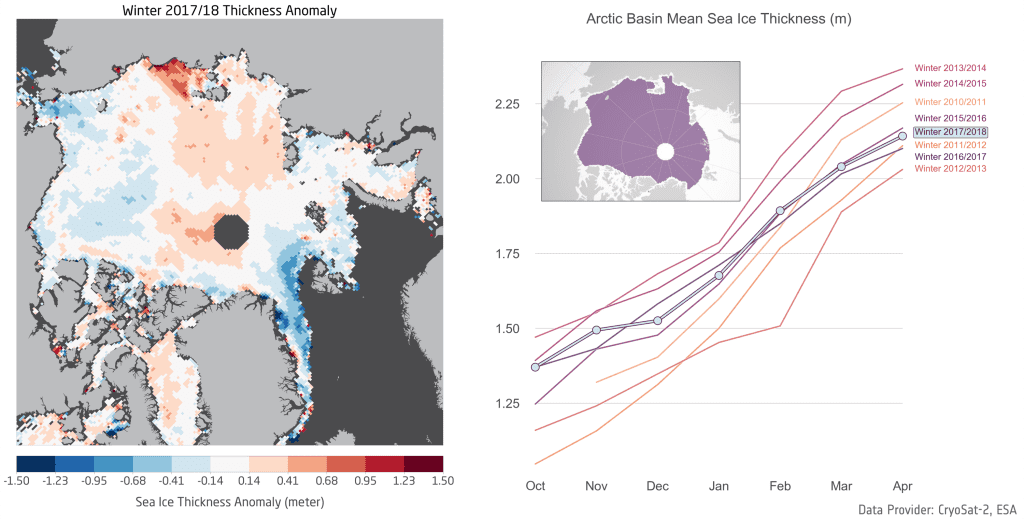
The evolution of monthly mean thickness in comparison to the previous winters is shown in Fig. 4b. The thickness increase from October 2017 through April 2018 was less than normal, resulting in a relative decline in mean thicknesses over the winter. Ice volume estimates representative of ice extent and concentration in the central Arctic verify the below average ice volume gain over this interval. The total volume gain amounted to only 7.31 thousand km3 compared to the 2010-18 average of 7.73 thousand km3.
Snow Depth
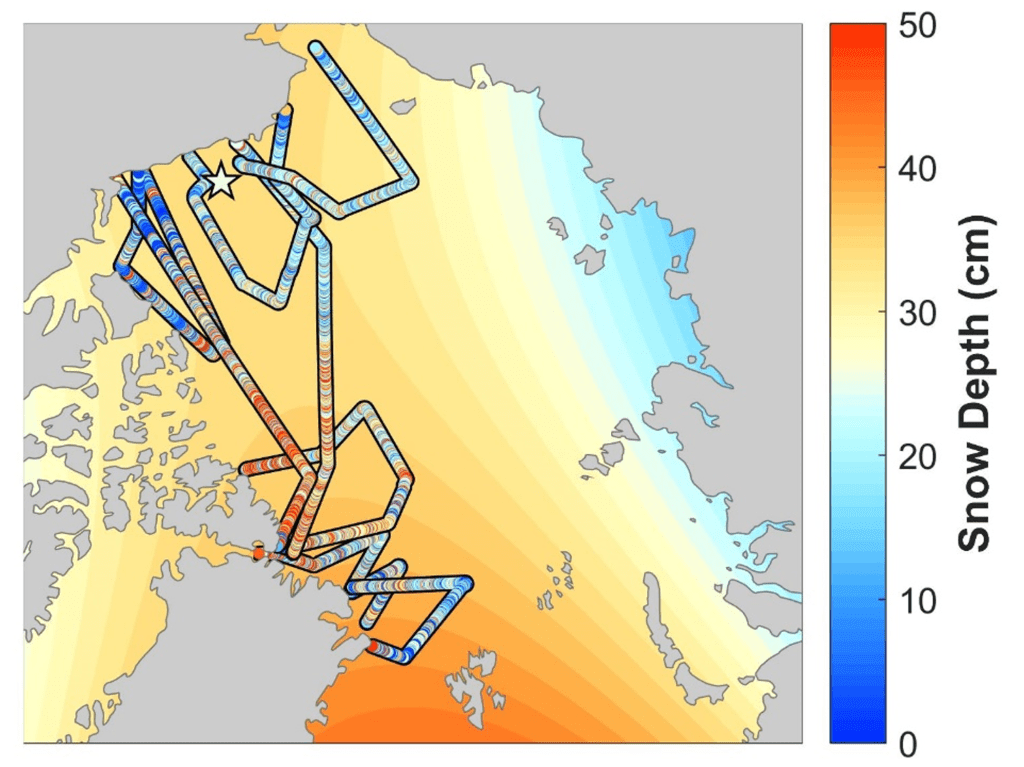
Snow depth plays an important role in the evolution of the sea ice cover, acting as a thermal insulator and an excellent reflector of sunlight. It is also critical to the derivation of ice thickness from CryoSat-2 and IceSat-2. Snow depth distributions measured during March and April 2018 from NASA’s Operation IceBridge show a spatial gradient of thick snow on multiyear ice north of Greenland and the Canadian Archipelago and thin snow on seasonal ice in the Beaufort and Chukchi seas (Fig. 5). Field observations in the Beaufort Sea showed an average snow depth of 12 cm and 39 cm on first-year and multiyear ice, respectively.
Winter Bering Sea
One of the more remarkable features of Arctic sea ice over the past year was the dearth of ice in the Bering Sea through the 2017-18 ice growth season. The Bering Sea supports a vibrant sea ice-ecosystem with abundant seals, birds, and other pelagic species that critically depend on the timing of sea ice formation and retreat. It is also an important commercial fishing region. Ice typically begins to form in the Bering around the beginning of October, expands through the winter and then melts away through the spring. By the end of June most or all of the Bering ice has typically melted out (Fig. 6).
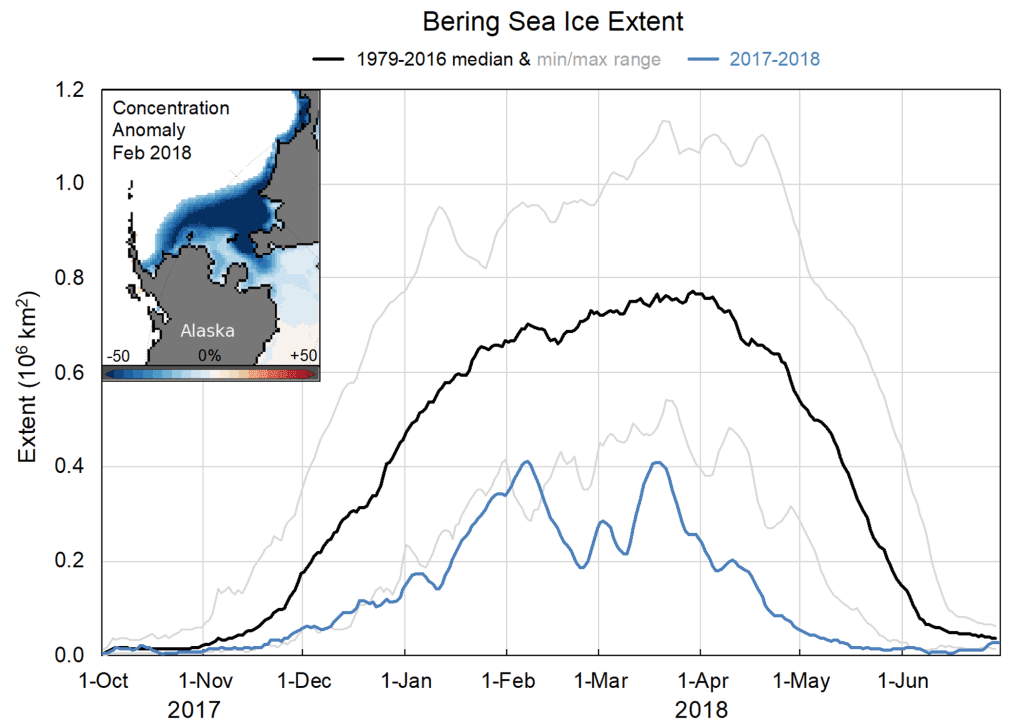
For virtually the entire 2017-2018 Bering Sea ice season, the extent was at a record low (Fig. 6). During February, typically the height of the winter season, the Bering Sea actually lost significant ice cover. From 7 February to 23 February 2018, ice extent decreased by ~215,000 km2, dropping from ~59% to only ~26% of normal (relative to the 1979-2016 median). The Bering Sea ice cover remained extremely low until mid-March, when extent increased over a couple of weeks, though it still remained at record low levels until the season spring decline began.
Anomalously warm sea surface temperatures (SSTs) persisted in the Bering Sea from September 2017 through 2018 (NOAA’s Optimum Interpolation Version 2 SST: https://www.esrl.noaa.gov/psd/map/clim/sst.shtml) and air temperatures were also well above average (NCEP/NCAR Reanalysis: https://www.esrl.noaa.gov/psd/cgi-bin/data/composites/printpage.pl). A key factor in the low Bering Sea ice was persistent southerly circulation that brought warm air and surface waters from the south and pushed sea ice that formed northward (see essay on Surface Air Temperature). Moorings measuring ocean currents and heat fluxes detected very warm water in the region in summer 2017, which likely pre-conditioned the waters for a late start to the freeze-up season (see essay on Sea Surface Temperature). The low winter and spring ice conditions allowed for early absorption of solar insolation by the ocean and warming of the surface waters. These warm ocean waters may have contributed to early summer ice loss in 2018 in the Chukchi and Beaufort seas, as the ocean heat melted ice. However, the ice loss in Chukchi slowed during July during a period of cool air temperatures in the region.
References
Cavalieri, D. J., C. L. Parkinson, P. Gloersen, and H. J. Zwally, 1996, updated yearly: Sea Ice Concentrations from Nimbus-7 SMMR and DMSP SSM/I-SSMIS Passive Microwave Data, Version 1. Boulder, CO USA. NASA National Snow and Ice Data Center Distributed Active Archive Center, doi: 10.5067/8GQ8LZQVL0VL.
Fetterer, F., K. Knowles, W. Meier, and M. Savoie, 2002, updated 2012: Sea Ice Index, National Snow and Ice Data Center. Digital media, Boulder, CO.
Laxon, S. W., K. A. Giles, A. L. Ridout, D. J. Wingham, R. Willatt, R. Cullen, R. Kwok, A. Schweiger, J. Zhang, C. Haas, S. Hendricks, R. Krishfield, N. Kurtz, S. Farrell, and M. Davidson, 2013: CryoSat-2 estimates of Arctic sea ice thickness and volume. Geophys. Res. Lett., 40, 732-737, doi: 10.1002/grl.50193.
Maslanik, J., and J. Stroeve, 1999, updated daily: Near-Real-Time DMSP SSMIS Daily Polar Gridded Sea Ice Concentrations, Version 1. Boulder, Colorado USA. NASA National Snow and Ice Data Center Distributed Active Archive Center, doi: 10.5067/U8C09DWVX9LM.
Maslanik, J., J. Stroeve, C. Fowler, and W. Emery, 2011: Distribution and trends in Arctic sea ice age through spring 2011. Geophys. Res. Lett., 38, L13502, doi: 10.1029/2011GL047735.
Meier, W. N., J. Stroeve, A. Barrett, and F. Fetterer, 2012: A simple approach to providing a more consistent Arctic sea ice extent time series from the 1950s to present. Cryosphere, 6, 1359-1368, doi: 10.5194/tc-6-1359-2012.
Tschudi, M. A., J. C. Stroeve, and J. S. Stewart, 2016: Relating the age of Arctic sea ice to its thickness, as measured during NASA’s ICESat and IceBridge Campaigns. Remote Sens., 8(6), 457, doi: 10.3390/rs8060457.
Tschudi, M. A., C. Fowler, J. A. Maslanik, and J. A. Stroeve, 2010: Tracking the movement and changing surface characteristics of Arctic sea ice. IEEE J. Sel. Top. Appl. Earth Obs. Remote Sens., 3, 536-540, doi: 10.1109/JSTARS.2010.2048305.
Tschudi, M., C. Fowler, and J. Maslanik, 2015: EASE-Grid Sea Ice Age, Version 2. NASA National Snow and Ice Data Center Distributed Active Archive Center, Boulder, CO, doi: 10.5067/1UQJWCYPVX61.
Warren, S., I. Rigor, N. Untersteiner, V. F. Radionov, N. N. Bryazgin, Y. I. Aleksandrov, and R. Colony, 1999: Snow depth on Arctic sea ice. J. Clim., 12, 1814-1829.
November 13, 2018