

M. -L. Timmermans1 and Z. Labe2,3
1Yale University, New Haven, CT, USA
2Atmospheric and Oceanic Sciences Program, Princeton University, Princeton, NJ, USA
3Geophysical Fluid Dynamics Laboratory, NOAA, Princeton, NJ, USA
Highlights
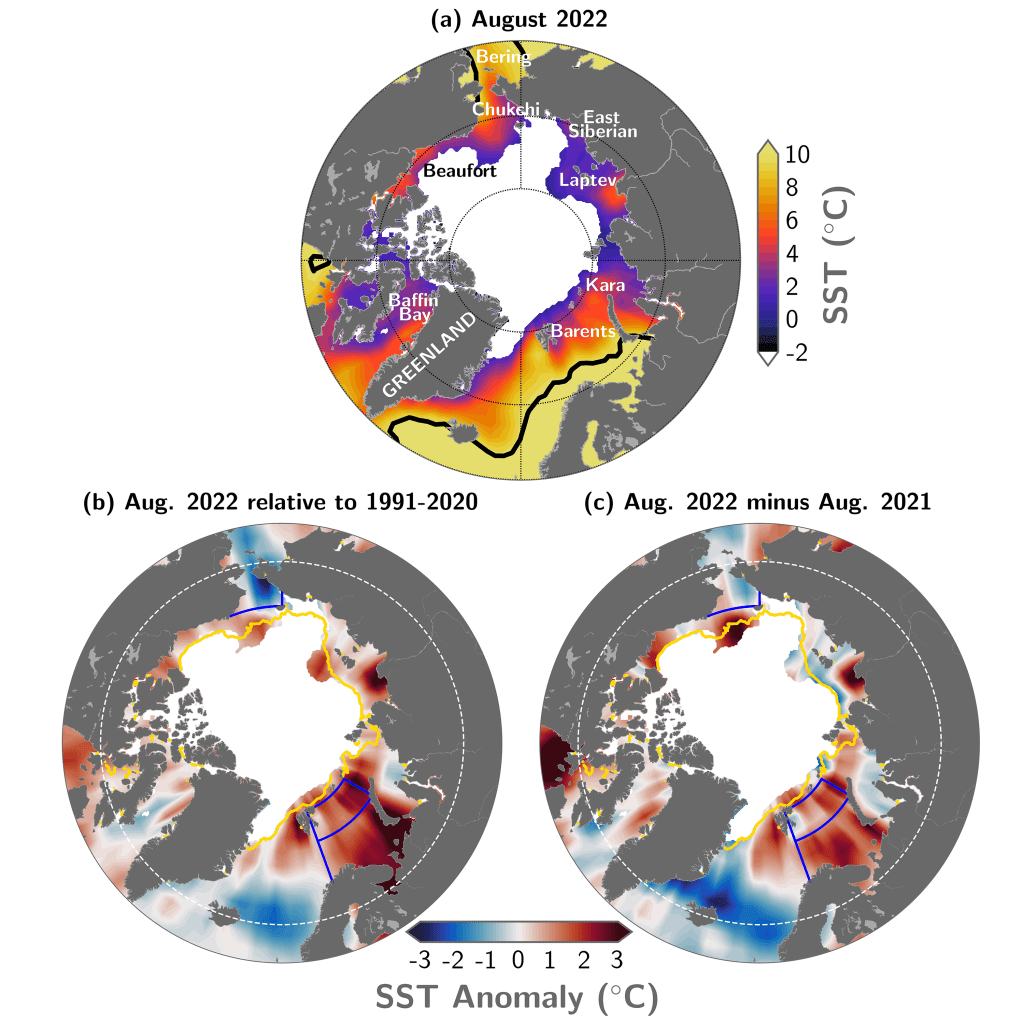
- August 2022 mean sea surface temperatures (SSTs) were ~2-3°C warmer than 1991-2020 August mean values in the Barents and Laptev Seas.
- Anomalously cool August 2022 SSTs (~3°C cooler) were observed in the Chukchi Sea.
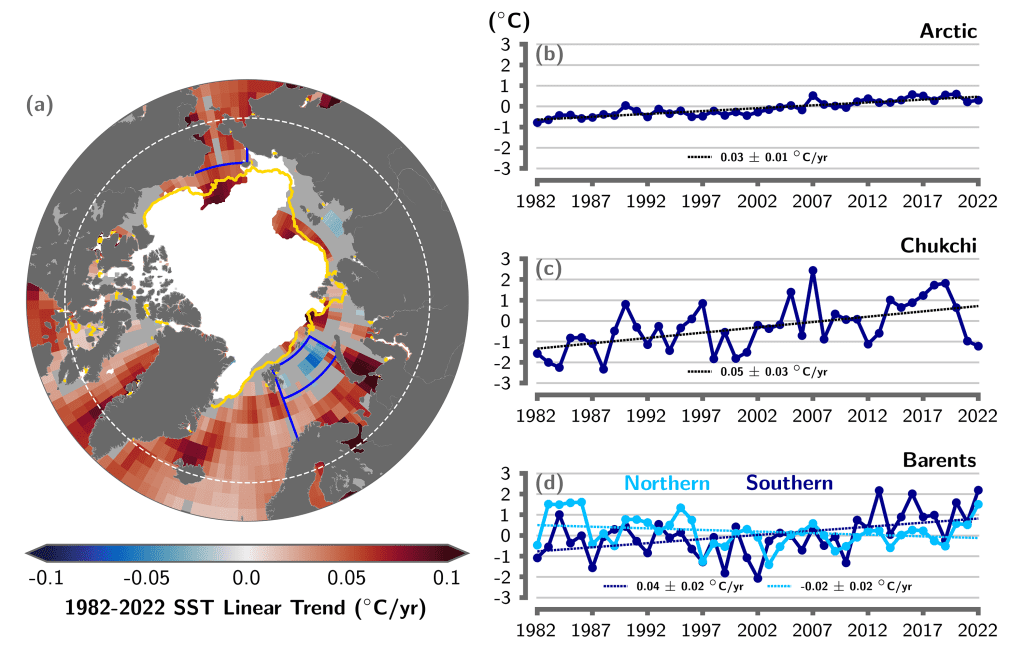
- August mean SSTs show warming trends for 1982-2022 in most regions of the Arctic Ocean that are ice-free in August, with the northern Barents Sea being a notable exception.
Arctic Ocean sea surface temperatures (SSTs) in the summer (June-August) are driven by the amount of incoming solar radiation absorbed by the sea surface and by the flow of warm waters into the Arctic from the North Atlantic and North Pacific Oceans. Solar warming of the Arctic Ocean surface is influenced by the distribution of sea ice (with greater warming occurring in ice-free regions), cloud cover, and upper-ocean stratification. Discharge of relatively warm Arctic river waters can provide an additional source of heat to the surface of marginal seas.
Arctic SST is an essential indicator of the role of the ice-albedo feedback cycle in any given summer sea ice melt season. As the area of sea ice cover decreases, more incoming solar radiation is absorbed by the darker ocean surface and, in turn, the warmer ocean melts more sea ice. In addition, higher SSTs are associated with delayed autumn freeze-up and increased ocean heat storage throughout the year. Marine ecosystems are also influenced by SSTs, which affect the timing and development of production cycles (see essay Primary Productivity), as well as available habitat.
The SST data presented here are monthly mean values for August (1982-2022) (see Reynolds et al. 2002, 2007), and comparisons are made to the 1991-2020 baseline period. August mean SSTs provide the most appropriate representation of Arctic Ocean summer SSTs because sea-ice extent is near a seasonal low at this time of year, and there is not the influence of surface cooling and subsequent sea-ice growth that takes place in the latter half of September.
August 2022 mean SSTs were as warm as ~12°C in the southern Barents Sea and reached values as warm as ~6°C in other marginal regions of the Arctic basin (northern Barents, Chukchi, Beaufort, East Siberian, Kara, and Laptev Seas, Fig. 1a). August 2022 mean SSTs were notably warm (around 2-3°C warmer than the 1991-2020 August mean) in the Barents and Laptev Seas, and cool in the Chukchi Sea (around 3°C cooler than the 1991-2020 mean, Fig. 1b). In assessing these regional differences, it is important to note that SSTs exhibit significant variability from year to year. For example, there were considerably warmer SSTs in the Barents Sea and cooler SSTs in the waters off eastern Greenland in August 2022 compared to August 2021, with differences of up to 3°C in each case (Fig. 1c) (see also Timmermans and Labe 2021).
The August 2022 anomalously warm SSTs in the Barents Sea, which were also observed in June and July (Fig. 2), aligned with anomalously warm June-August 2022 surface air temperatures over northern Eurasia (see essay Surface Air Temperature). The early timing of seasonal sea-ice retreat from the Barents Sea, with sea ice almost entirely absent from the region by June 2022 (Fig. 2a), also links to warm SSTs via the ice-albedo feedback (see essay Sea Ice).
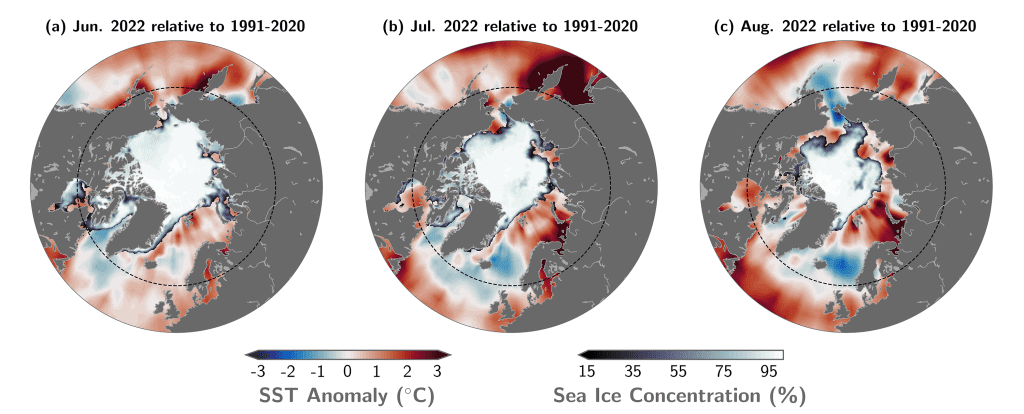
The August 2022 anomalously cool SSTs in the Chukchi Sea are commensurate with below normal surface air temperatures in the region in June-August 2022 (see essay Surface Air Temperature). The persistence of a tongue of late-season sea ice near the coast where the East Siberian Sea meets the Chukchi Sea is further consistent with these anomalously cool SSTs (Fig. 2 and see essay on Sea Ice). Conversely, to the north of this region of cool SSTs, sea-ice extent was below normal and SSTs were anomalously warm (Fig. 2b).
Mean August SST warming trends from 1982 to 2022 persist over much of the Arctic Ocean, with statistically significant (at the 95% confidence interval) linear warming trends in most regions, except the Laptev, East Siberian, and northern Barents Seas (Fig. 3a). Mean August SSTs for the entire Arctic (the Arctic Ocean and marginal seas north of 65° N) exhibit a linear warming trend of +0.03 ± 0.01°C/yr (Fig. 3b). Even while anomalously cool SSTs in the Chukchi Sea were prominent in the August 2022 SST field (Fig. 1b), SSTs show a linear warming trend over 1982-2022 of +0.05 ± 0.03°C/yr (Fig. 3c) for this region. The cooling trend in mean August SSTs in the northern Barents Sea (Fig. 3d) remains an exception. This cooling trend has been notably influenced by anomalously warm SSTs in that sector of the Barents Sea in the 1980s and 90s (Fig. 3d), although anomalously warm SSTs in recent years in the region continue to have an influence on reversing the overall trend.
Methods and data
The SST data presented here are a blend of in situ and satellite measurements from August 1982 to August 2022, taken from the monthly mean NOAA Optimum Interpolation (OI) SST Version 2 product (OISSTv2; Reynolds et al. 2002, 2007). NOAA OISSTv2 data are provided by the NOAA PSL, Boulder, Colorado, USA, from their website at https://psl.noaa.gov [accessed 6 September 2022], which can be retrieved at https://downloads.psl.noaa.gov/Datasets/noaa.oisst.v2/ (Reynolds et al. 2007). In the Arctic Ocean overall, the OISSTv2 product has been found to exhibit a cold bias (i.e., underestimate SST) of up to 0.5°C compared to in situ measurements (Stroh et al. 2015). The OISSTv2 product uses a simplified linear relationship with sea-ice concentration to infer SST under sea ice (Reynolds et al. 2007), which means SSTs may be too cool by up to 0.2°C where there is sea-ice cover. We focus primarily on waters that are ice free in August, although this uncertainty can be reflected in trends and variability in the vicinity of the sea-ice edge. The period 1991-2020 is used as the climatological reference for the June, July, and August means. We note here that there is an update to the OISSTv2 product. This updated version 2.1 employs a different method than version 2 for setting a proxy SST in sea-ice covered regions, applied only after January 2016 (in addition to some other differences that are not specific to the polar regions). See Huang et al. (2021) for a description. In our examination of trends in the Arctic Ocean (based on monthly means), we require a product that estimates SST in the presence of sea ice in the same way over the full duration of the record. Otherwise, estimated trends might be artifacts of the change in methodology part way through the record. For this reason, we choose to continue to use the monthly OISSTv2.
Sea ice concentration data are the NOAA/NSIDC Climate Data Record of Passive Microwave Sea Ice Concentration, Version 4 and Near-Real-Time NOAA/NSIDC Climate Data Record of Passive Microwave Sea Ice Concentration, Version 2 (Peng et al. 2013; Meier et al. 2021a,b), where a threshold of 15% concentration is used to calculate sea ice extent.
Acknowledgments
M. -L. Timmermans acknowledges support from the National Science Foundation Office of Polar Programs, and the Office of Naval Research. Z. Labe acknowledges support under award NA18OAR4320123 from the National Oceanic and Atmospheric Administration, U.S. Department of Commerce.
References
Huang, B., C. Liu, V. Banzon, E. Freeman, G. Graham, B. Hankins, T. Smith, and H. Zhang, 2021: Improvements of the Daily Optimum Interpolation Sea Surface Temperature (DOISST) Version 2.1. J. Climate, 34(8), 2923-2939, https://doi.org/10.1175/JCLI-D-20-0166.1.
Meier, W. N., F. Fetterer, A. K. Windnagel, and J. S. Stewart, 2021a: NOAA/NSIDC Climate Data Record of Passive Microwave Sea Ice Concentration, Version 4. [1982-2021]. Boulder, Colorado USA. NSIDC: National Snow and Ice Data Center, accessed 10 September 2022, https://doi.org/10.7265/efmz-2t65.
Meier, W. N., F. Fetterer, A. K. Windnagel, and J. S. Stewart, 2021b: Near-Real-Time NOAA/NSIDC Climate Data Record of Passive Microwave Sea Ice Concentration, Version 2. [1982-2021], accessed 10 September 2022, https://doi.org/10.7265/tgam-yv28.
Peng, G., W. N. Meier, D. J. Scott, and M. H. Savoie, 2013: A long-term and reproducible passive microwave sea ice concentration data record for climate studies and monitoring. Earth Syst. Sci. Data, 5, 311-318, https://doi.org/10.5194/essd-5-311-2013.
Reynolds, R. W., N. A. Rayner, T. M. Smith, D. C. Stokes, and W. Wang, 2002: An improved in situ and satellite SST analysis for climate. J. Climate, 15, 1609-1625, https://doi.org/10.1175/1520-0442(2002)015<1609:AIISAS>2.0.CO;2.
Reynolds, R. W., T. M. Smith, C. Liu, D. B. Chelton, K. S. Casey, and M. G. Schlax, 2007: Daily high-resolution-blended analyses for sea surface temperature. J. Climate, 20, 5473-5496, https://doi.org/10.1175/2007JCLI1824.1, and see http://www.esrl.noaa.gov/psd/data/gridded/data.noaa.oisst.v2.html.
Stroh, J. N., G. Panteleev, S. Kirillov, M. Makhotin, and N. Shakhova, 2015: Sea-surface temperature and salinity product comparison against external in situ data in the Arctic Ocean. J. Geophys. Res.-Oceans, 120, 7223-7236, https://doi.org/10.1002/2015JC011005.
Timmermans, M. -L., and Z. M. Labe, 2021: Sea surface temperature. Arctic Report Card 2021, T. A. Moon, M. L. Druckenmiller, and R. L. Thoman, Eds., https://doi.org/10.25923/2y8r-0e49.
November 22, 2022