

T. J. Ballinger1, J. E. Overland2, M. Wang2,3, J. E. Walsh1, B. Brettschneider4, R. L. Thoman1,5, U. S. Bhatt6, E. Hanna7, I. Hanssen-Bauer8, and S. -J. Kim9
1International Arctic Research Center, University of Alaska Fairbanks, Fairbanks, AK, USA
2Pacific Marine Environmental Laboratory, NOAA, Seattle, WA, USA
3Cooperative Institute for Climate, Ocean, and Ecosystem Studies, University of Washington, Seattle, WA, USA
4National Weather Service Alaska Region, NOAA, Anchorage, AK, USA
5Alaska Center for Climate Assessment and Policy, University of Alaska Fairbanks, Fairbanks, AK, USA
6Geophysical Institute, University of Alaska Fairbanks, Fairbanks, AK, USA
7Department of Geography and Lincoln Climate Research Group, Lincoln, UK
8Norwegian Meteorological Institute, Oslo, Norway
9Korea Polar Research Institute, Incheon, Republic of Korea
Highlights
- Annual water year (October 2021-September 2022) surface air temperatures (north of 60° N) were the sixth warmest dating back to 1900.
- Winter (January-March) 2022 was characterized by above-normal (≥3°C) air temperature anomalies in the Eurasian Arctic and Arctic Ocean contrasted by below-normal (≤-2°C) air temperature anomalies over most of the North American high latitudes.
- An extensive region of low pressure in the eastern Arctic supported warm Eurasian and Arctic Ocean winter temperatures, while low pressure across the Alaska Arctic and northern Canada sustained warm summer temperatures over the Beaufort Sea and Canadian Archipelago.
Over recent decades, Arctic air temperatures have warmed at a greater rate relative to global means. This amplified regional warming, known as Arctic Amplification (AA), is associated with various localized land-ocean-sea ice interactions and large-scale atmospheric and oceanic energy transports (Previdi et al. 2021). AA is a well-established phenomenon that is connected to changes in Arctic weather and climate extremes that impact the region’s climate system (Walsh et al. 2020). Recent research has emphasized that the magnitude of AA is sensitive to multiple constraints, including how the southern limit of the Arctic region is defined, which datasets (i.e., observational versus modeled) are analyzed, and what time periods are considered (England et al. 2021; Chylek et al. 2022; Rantanen et al. 2022). As examples, Chylek et al. (2022) and Rantanen et al. (2022) showed that land and ocean areas poleward of 60° N have warmed ~2-3 faster than the global mean during the last three decades.
As a long-standing practice in the Arctic Report Card, this year’s Surface Air Temperature essay examines Arctic annual temperatures for northern lands (60-90° N), and includes ocean and total area (land and ocean) temperature estimates across this domain. A summary of seasonal air temperature anomalies is also discussed with an emphasis on patterns observed during the past year.
Arctic annual land and ocean temperatures
This past water year (October 2021-September 2022) marked the sixth warmest for Arctic Ocean and land areas north of 60° N since 1900 (Fig. 1a). Surface air temperatures were 0.73°C warmer than the 1991-2020 mean, continuing the common, recent pattern where annual temperatures have both exceeded the 30-year Arctic mean and been warmer than the global mean. Including the past year, the ten warmest years observed in the Arctic have all occurred since 2011 (Fig. 1a).
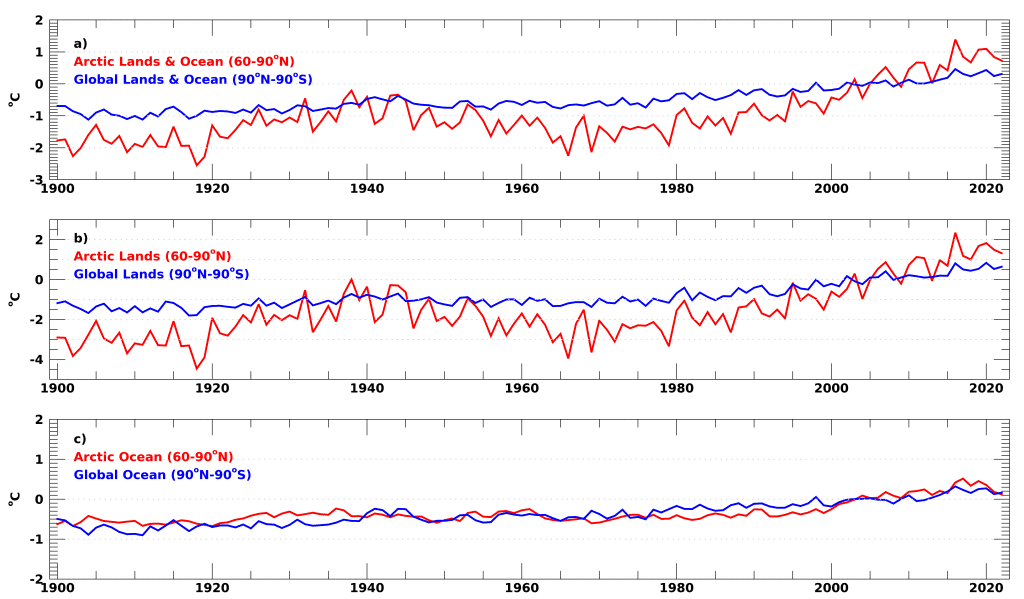
Considered independently, Arctic lands (Fig. 1b) and the Arctic Ocean (Fig. 1c) also experienced notable annual warm anomalies during 2022. Land temperatures were 1.31°C above the 1991-2020 mean, ranking fifth warmest, while this past year’s Arctic Ocean mean temperature anomaly (0.13°C) was the thirteenth warmest, both since 1900. Over the last half century, increased temperatures are apparent in both environments with greater year-to-year variability observed over land compared to the ocean due to thermal inertia and heat capacity differences between these environments.
Seasonal Arctic air temperatures in 2022
Arctic air temperature anomalies, compared to the 1991-2020 mean, are presented for seasons spanning the water year (October-September) defined as follows: autumn 2021 (October-December [OND]), winter (January-March [JFM]), spring (April-June [AMJ]) and summer (July-September [JAS]) 2022 (Fig. 2). These seasonal definitions also follow important annual cycles discussed in this year’s Arctic Report Card, including the Greenland Ice Sheet’s period of peak ablation during summer and the spring onset of snow and sea ice melt on the Arctic Ocean.
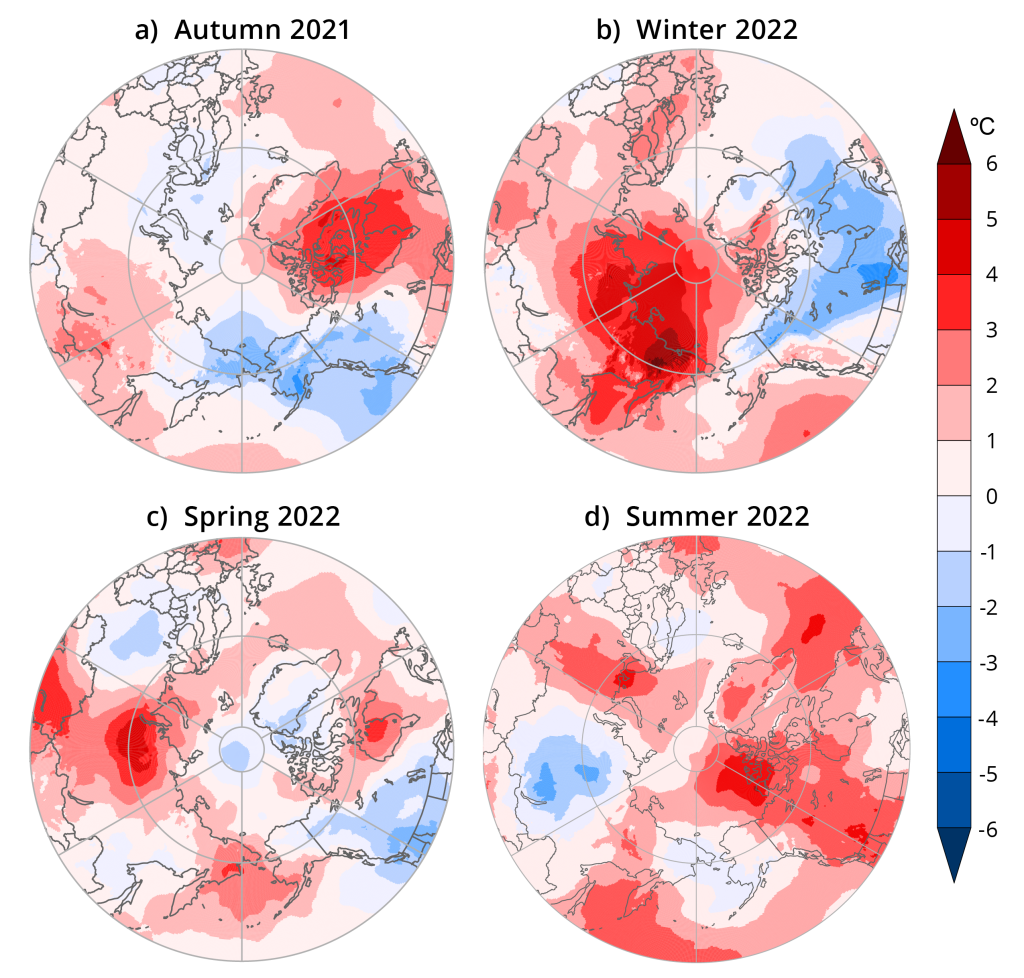
Autumn 2021. Warm air temperature anomalies of at least 1°C above the 1991-2020 mean spread over most of Arctic Canada, Greenland, and central Siberia (Fig. 2a). Broad warm anomalies of 3°C were found over Hudson Bay and the Canadian Archipelago to the north extending eastward over Baffin Bay and the northern Labrador Sea. These anomalies were supported by two sea-level pressure anomaly patterns. One of these patterns showed higher-than-normal pressure over the central Arctic and Greenland—with unusually strong Greenland Blocking in October—while the second pattern was characterized by below-normal pressure over the Beaufort Sea and Canadian Archipelago. These two patterns worked in tandem to transport warm, southerly air across this area and sustained above-normal air temperatures (Fig. 3a). In stark contrast to autumn 2020 (see Ballinger et al. 2021), the Arctic Ocean experienced near-normal autumn temperatures.
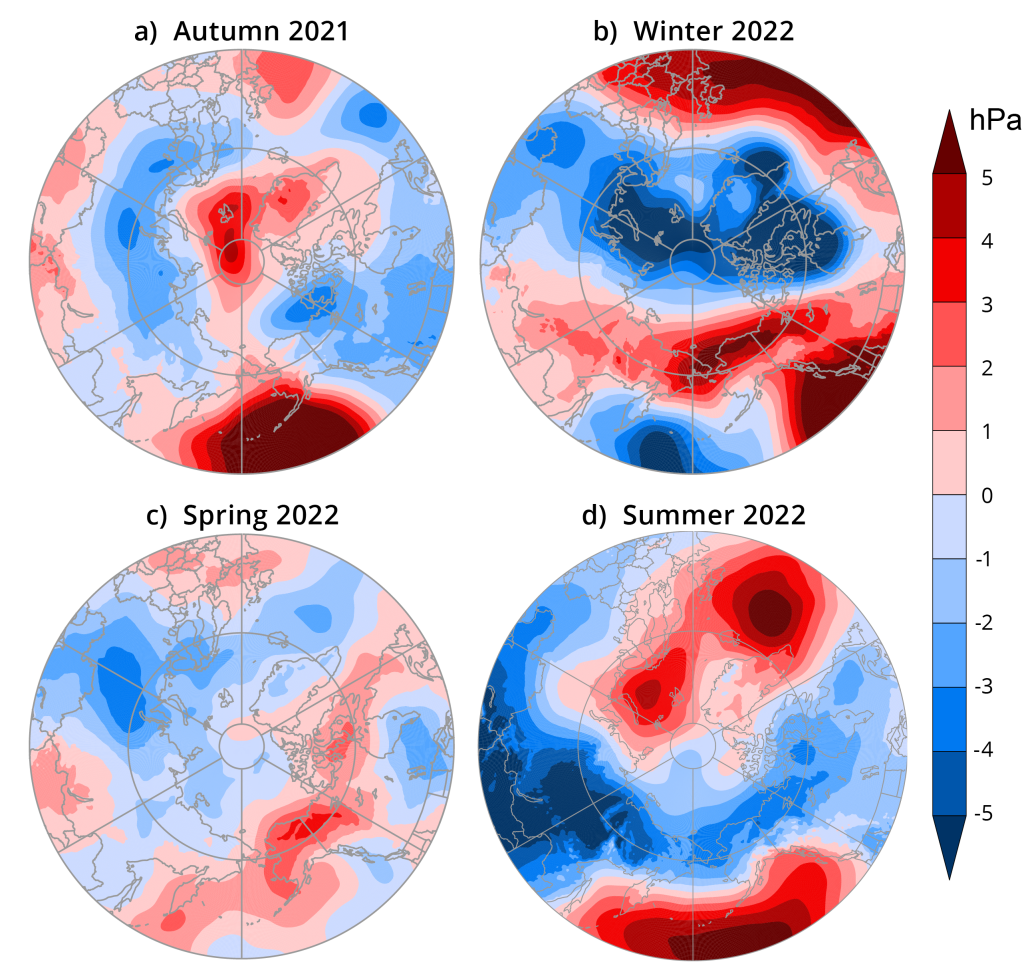
Cold anomalies stretched from Chukotka eastward across northwestern North America (Fig. 2a). Areas within the Chukchi Sea and northern Bering Sea and adjacent North Slope and southcentral Alaska saw the coldest seasonal temperature patterns (≤-2°C) in the Arctic. Colder-than-normal autumn air temperatures were associated with the development of relatively thicker sea ice compared to previous years (see essay Sea Ice). Record and near-record cold events were noted in western Alaska in November, including the lowest November mean temperature in the past 75 years at both King Salmon and Cold Bay, Alaska (NOAA NWS 2022). This stretch of cold temperatures was a result of northerly winds aided by the aforementioned negative pressure anomaly over the Beaufort Sea and Canadian Archipelago in tandem with a large high-pressure anomaly (≥5 hPa) in the North Pacific (Fig. 3a).
Winter 2022. A distinct, contrasting Eurasian-North American temperature dipole was present during winter of 2022 (Fig. 2b). This was characterized by above-normal air temperatures in the Eurasian Arctic and cold departures over the North American high latitudes, as a result of positive Arctic Oscillation/North Atlantic Oscillation conditions prevailing during much of this season. A large region of ≥3°C warm anomalies was concentrated on the central Arctic extending south to western Siberia and stretching across the continent. The above-average temperatures were associated with 4-5 hPa lower-than-normal surface pressure over the Barents and Kara Seas that facilitated warm airflow over land and ocean areas to the east (Fig. 3b) and coincided with positive precipitation anomalies over Norway (see essay Precipitation).
Contrasting winter cold temperature anomalies (≤-2°C) were noted over northern North America, extending from northeastern Alaska southeastward over Hudson Bay and Labrador Sea to the east (Fig. 2b). Colder-than-normal air temperatures over these areas were supported by low pressure north of Hudson Bay (≤-5 hPa) and a broad region of high pressure upstream extending eastward from central Siberia to western North America (Fig. 3b).
Spring 2022. Arctic Ocean air temperatures hovered around average, with relatively small air temperature anomalies over Arctic lands during spring of 2022 (Fig. 2c). This was typified by warm anomalies (≥1°C) in central and eastern Siberia and atop Hudson Bay. A small area of maximum Arctic air temperature anomalies (4-5°C) was found just west of the Ural Mountains associated with low pressure anomalies (≤-2 hPa) that transported warm air into the area (Fig. 3c). Record warm June-averaged air temperatures were found over Svalbard (5-6°C; Mamen et al. 2022). Similar to autumn of 2021, near-normal air temperatures were found over the Arctic Ocean. Negative temperature anomalies (≤-1°C) were dispersed over northwestern North America, northwestern Greenland and adjacent Ellesmere Island, and westernmost Eurasia.
Summer 2022. Summer air temperatures were described by multiple, regional warm anomalies (≥1°C), including over westernmost Eurasia, easternmost Eurasia, and the Beaufort Sea and Canadian Archipelago (Fig. 2d). Low pressure anomalies, suggestive of frequent storms, across Arctic Alaska and northern Canada supported the warm air temperatures in the latter areas. Similar to preceding autumn and spring temperature patterns, the central Arctic Ocean air temperatures remained near to slightly above-normal with some warm anomalies extending from coastal areas into the marginal seas. Cold anomalies were observed in central Eurasia and were associated with low pressure anomalies to the east that caused cold, northerly winds (Fig 3d).
Methods and data
The NASA Goddard Institute for Space Studies (GISS) surface temperature analysis version 4 (GISTEMP v4) is used to describe Arctic and global air temperatures since 1900 (Fig. 1). GISTEMP4 air temperatures over global lands are obtained from the NOAA Global Historical Climatology Network version 4 (GHCN v4) and global ocean surface temperatures originate from the NOAA Extended Reconstructed Sea Surface Temperature version 5 (ERSST v5) dataset. The process of merging these products to create the GISTEMP product is described in Hansen et al. (2010) and Lenssen et al. (2019). Past ARC SAT essays have used different versions of the CRUTEM product (e.g., Osborn et al. 2021). We elect to use GISTEMP this year as it has been shown to exhibit similar variability and trends as CRUTEM and analogous products that resolve multidecadal Arctic and global air temperatures (Rantanen et al. 2022), but has more thorough spatial coverage.
Seasonal air temperature and surface pressure plots are created from ERA5 reanalysis (Hersbach et al. 2020). Two-meter air temperatures in ERA5 exhibit a warm bias over the Arctic Ocean (Yu et al. 2021). Therefore, we elect to show 925 hPa level air temperatures (Fig. 2), which are constrained by aerial (e.g., radiosonde and aircraft) and satellite observations. We note that initial analyses found 925 hPa Arctic air temperatures from ERA5 to be consistent with other reanalyses in terms of their temporal variability and spatial patterns (not shown). All values and fields are presented as anomalies with respect to the 1991-2020 mean.
References
Ballinger, T. J., and Coauthors, 2021: Surface air temperature. Arctic Report Card 2021, T. A. Moon, M. L. Druckenmiller, and R. L. Thoman, Eds., https://doi.org/10.25923/53xd-9k68.
Chylek, P., C. Folland, J. D. Klett, M. Wang, N. Hengartner, G. Lesins, and M. K. Dubey, 2022: Annual mean Arctic amplification 1970-2020: Observed and simulated by CMIP6 climate models. Geophys. Res. Lett., 49, e2022GL099371, https://doi.org/10.1029/2022GL099371.
England, M. R., I. Eisenman, N. J. Lutsko, and T. J. W. Wagner, 2021: The recent emergence of Arctic amplification. Geophys. Res. Lett., 48, e2021GL094086, https://doi.org/10.1029/2021GL094086.
Hersbach, H., and Coauthors, 2020: The ERA5 global reanalysis. Q. J. Roy. Meteor. Soc., 146, 1999-2049, https://doi.org/10.1002/qj.3803.
Hansen, J., R. Ruedy, M. Sato, and K. Lo, 2010: Global surface temperature change. Rev. Geophys., 48, RG4004, https://doi.org/10.1029/2010RG000345.
Lenssen, N., G. Schmidt, J. Hansen, M. Menne, A. Persin, R. Ruedy, and D. Zyss, 2019: Improvements in the GISTEMP uncertainty model. J. Geophys. Res.-Atmos., 124, 6307-6326, https://doi.org/10.1029/2018JD029522.
Mamen, J., H. T. T. Tajet, and K. Tunheim, 2022: Klimatologisk månedsoversikt, June 2022, MET info no. 6/2022 (In Norwegian), ISSN 1894-759X.
NOAA National Weather Service (NWS), 2022: NOWData – NOAA Online Weather Data [Cold Bay Area & King Salmon Area], accessed 12 September 2022, https://www.weather.gov/wrh/Climate?wfo=afg.
Osborn, T. J., P. D. Jones, D. H. Lister, C. P. Morice, I. R. Simpson, J. P. Winn, E. Hogan, and I. C. Harris, 2021: Land surface air temperature variations across the globe updated to 2019: the CRUTEM5 dataset. J. Geophys. Res.-Atmos., 126, e2019JD032352, https://doi.org/10.1029/2019JD032352.
Previdi, M., K. L. Smith, and L. M. Polvani, 2021: Arctic amplification of climate change: a review of underlying mechanisms. Environ. Res. Lett., 16, 093003, https://doi.org/10.1088/1748-9326/ac1c29.
Rantanen, M., A. Y. Karpechko, A. Lipponen, K. Nordling, O. Hyvärinen, K. Ruosteenoja, T. Vihma, and A. Laaksonen, 2022: The Arctic has warmed nearly four times faster than the globe since 1979. Commun. Earth Env., 3, 168, https://doi.org/10.1038/s43247-022-00498-3.
Walsh, J. E., T. J. Ballinger, E. S. Euskirchen, E. Hanna, J. Mård, J. E. Overland, H. Tangen, and T. Vihma, 2020: Extreme weather and climate events in northern areas: A review. Earth-Sci. Rev., 209, 103324, https://doi.org/10.1016/j.earscirev.2020.103324.
Yu, Y., W. Xiao, Z. Zhang, X. Cheng, F. Hui, and J. Zhao, 2021: Evaluation of 2-m air temperature and surface temperature from ERA5 and ERA-I using buoy observations in the arctic during 2010-2020. Remote Sens., 13, 2813, https://doi.org/10.3390/rs13142813.
November 14, 2022