
H. Epstein1, U. Bhatt2, M. Raynolds3, D. Walker3, B. Forbes4, G. Phoenix5, J. Bjerke6, H. Tømmervik6, S. -R. Karlsen7, R. Myneni8, T. Park8, S. Goetz9, G. Jia10
1Department of Environmental Sciences, University of Virginia, Charlottesville, VA, USA
2Geophysical Institute, University of Alaska Fairbanks, Fairbanks, AK, USA
3Institute of Arctic Biology, University of Alaska Fairbanks, AK, USA
4Arctic Centre, University of Lapland, Rovaniemi, Finland
5Department of Animal and Plant Sciences, University of Sheffield, Sheffield, UK
6Norwegian Institute for Nature Research, Tromsø, Norway
7Norut Northern Research Institute, Tromsø, Norway
8Department of Earth and Environment, Boston University, Boston, MA, USA
9School of Informatics, Computing, and Cyber Systems, Northern Arizona University, Flagstaff, AZ, USA
10Institute of Atmospheric Physics, Chinese Academy of Sciences, Beijing, China
Highlights
- The overall trend for the satellite record (1982-2017) is one of general greening; however, there are certain regions that exhibit browning, such as the Yukon-Kuskokwim Delta of western Alaska, the High Arctic of the Canadian Archipelago, and the northwestern and north-coastal Siberian tundra.
- Tundra greenness declined in 2017, relative to 2016, with a particularly sharp drop in the integrated growing-season value for Eurasia, which was coupled with a large decrease (24.6%) in Summer Warmth Index.
- Observations from the literature (field and other remote sensing data) across various spatial scales, from small plots to the circumpolar Arctic, continue to provide evidence for both greening and browning.
Arctic tundra vegetation has responded to dramatic environmental changes over the course of the last several decades. The overall tendency has been an increase in the above-ground quantity of live vegetation, commonly referred to as “greening.” However, vegetation changes do vary spatially, in both direction and magnitude, throughout the circumpolar Arctic and are not necessarily changing in a consistent fashion over time (e.g., Bhatt et al., 2013; Reichle et al., 2018). This variability suggests that there are complex interactions among the vegetation, atmosphere, ground (soils and permafrost), and grazing animals of the Arctic system. Changes in tundra vegetation can have important effects on carbon cycling and soil-atmosphere energy exchange (e.g., Treharne et al., 2016; Frost et al., 2018, Lafleur and Humphreys, 2018). The latter has implications for active layer depth and permafrost stability, thereby impacting Arctic landscapes. Changes in tundra vegetation can also have important effects on wildlife habitats. For instance, bird and mammal species have been shown to respond favorably (e.g., greater range and larger populations) to Arctic greening, including shrub expansion (e.g., Wheeler et al., 2018). Continued evaluation of the current state and dynamics of the circumpolar Arctic vegetation improves our understanding of these complex interactions and their impacts on the Arctic system and beyond.
There are a number of controls on inter-annual dynamics of tundra productivity, with summer air temperature the most widely acknowledged factor responsible for increases (greening) in tundra vegetation (Ackerman et al., 2018; Keenan and Riley, 2018; Myers-Smith and Hik, 2018; Weijers et al., 2018; Bjorkman et al., 2018). However, several reports have shown increased temperatures to have a detrimental (browning) or no effect on tundra vegetation (Lara et al., 2018; Maliniemi et al., 2018; Opala-Owczarek et al., 2018; Xu et al., 2018). Tundra browning has also been observed in response to extreme events, which include winter warming and snowmelt (followed by frost-drought), icing (e.g., rain-on-snow), mammalian herbivore population cycles (Olofsson et al., 2009), and insect outbreaks (Phoenix and Bjerke, 2016; Treharne et al., 2016). Precipitation and moisture availability are also important controls on tundra vegetation dynamics (Lara et al., 2018; Maliniemi et al., 2018; Opala-Owczarek et al., 2018; Wang et al., 2018; Bjorkman et al., 2018) and are linked to the effects of air temperature changes; increased temperatures may lead to reduced growing-season soil moisture and increased water stress in tundra plants (Ackerman et al., 2018; Keenan and Riley, 2018; Opala-Owczarek et al., 2018). Changes in the snow regime have been found to drive dynamics in tundra vegetation structure (e.g., height) and functioning (e.g., carbon cycling) (Christiansen et al., 2018; Maliniemi et al., 2018; Opala-Owczarek et al., 2018; Parmentier et al., 2018; Wang et al., 2018). Changes in the land cover also affect tundra greenness; reductions in cryogenic disturbances (e.g., frost circles) (Becher et al., 2018) and increased lake drainage (Lara et al., 2018) can both lead to greening.
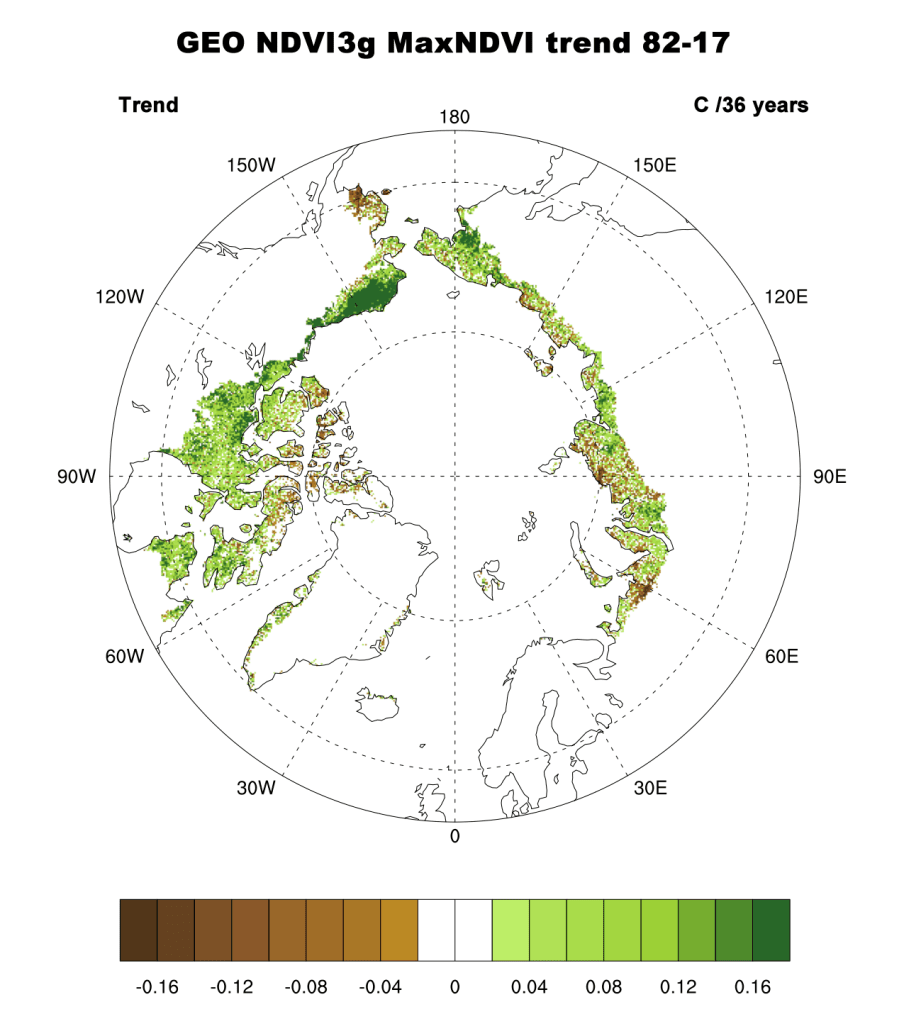
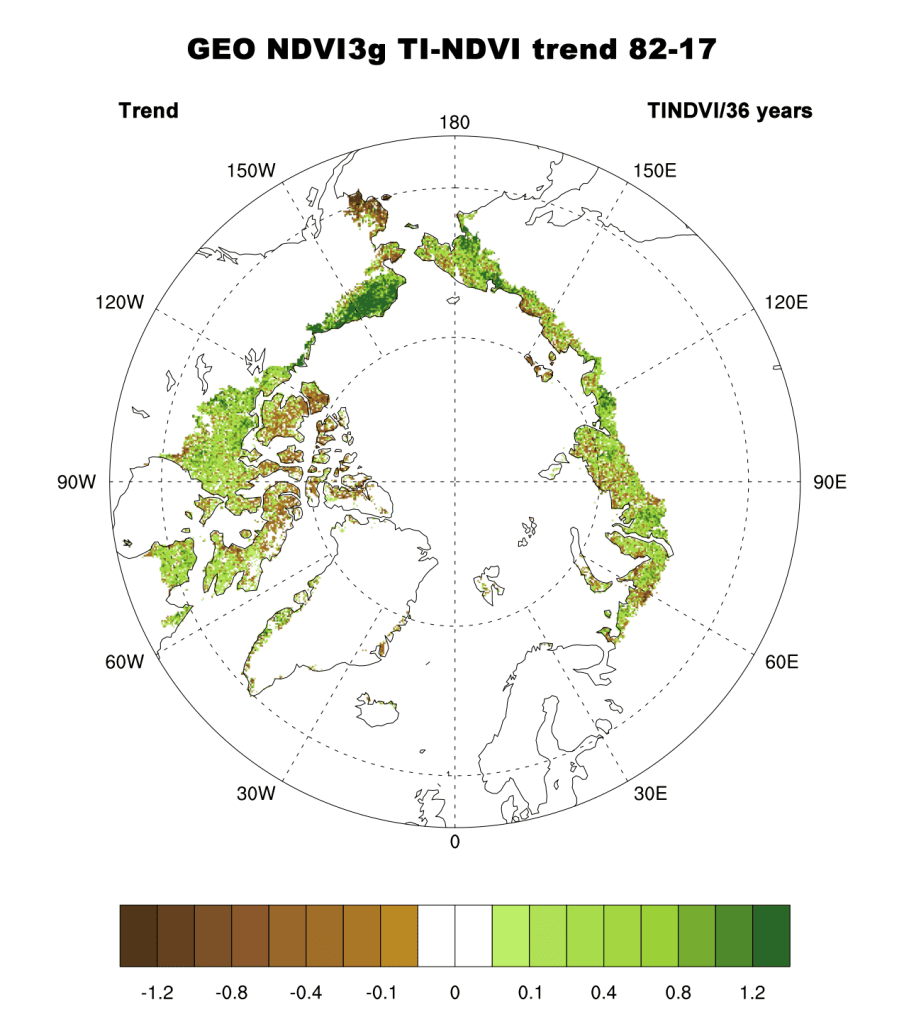
Arctic tundra vegetation, specifically the Normalized Difference Vegetation Index (NDVI), has been monitored continuously since 1982 via Earth-observing satellites with sub-daily return intervals. The data reported here are from the Global Inventory Modeling and Mapping Studies (GIMMS) 3g V1 dataset (GIMMS, 2013) and are based largely on the Advanced Very High Resolution Radiometer (AVHRR) sensors aboard NOAA satellites (Pinzon and Tucker, 2014). At the time of writing, the GIMMS3g V1 dataset was only available through 2017. The GIMMS product (at 1/12° resolution for this report) is a bi-weekly, maximum-value composited dataset of the NDVI, calculated from Earth-surface reflectances in the Red and Near Infrared wavelengths. NDVI is highly correlated with the quantity of above-ground vegetation (e.g., Raynolds et al., 2012; Karlsen et al., 2018), or the “greenness,” of the Arctic tundra. We use two metrics based on the NDVI: MaxNDVI and TI-NDVI. MaxNDVI is the peak NDVI value for the year (the peak of the growing season) and is related to yearly maximum above-ground vegetation biomass. TI (time-integrated) NDVI is the sum of the bi-weekly NDVI values for the growing season and is correlated with the total above-ground vegetation productivity. The mean NDVI values for Eurasian tundra are inherently substantially greater than those for the North American tundra. This is because most of the Eurasian tundra occurs at lower latitudes compared to the North American tundra and, hence, has greater NDVI.
Examining the overall trend in tundra greenness for the now 36-year record (1982-2017), it is apparent that the MaxNDVI and the TI-NDVI have increased throughout a majority of the geographic circumpolar Arctic tundra (Fig. 1a, b). Regions with the greatest increases in tundra greenness are the North Slope of Alaska, the Low Arctic (southern tundra subzones) of the Canadian tundra, and eastern Siberia. Tundra greenness has declined or shown “browning” on the Yukon-Kuskokwim Delta of western Alaska, the High Arctic of the Canadian Archipelago, and the northwestern and north-coastal Siberian tundra. Specific regions of greening and browning, measured by NDVI increases and decreases, respectively, tend to be consistent between MaxNDVI and TI-NDVI. However, decreases in TI-NDVI tend to be more spatially extensive than decreases in MaxNDVI.
Considering variability on a year-to-year basis, NDVI declined in 2017 from the prior year for both indices over North America and Eurasia (Fig. 2). This decline follows two years of increases in the NDVI, with particularly high NDVI values observed in 2016. TI-NDVI in Eurasia declined substantially from 2016 to 2017 (9.7%—2nd largest single-year decline in the record), whereas it declined 3.9% for North America. MaxNDVI in Eurasia declined by 1.9% compared to 4.2% for North America.
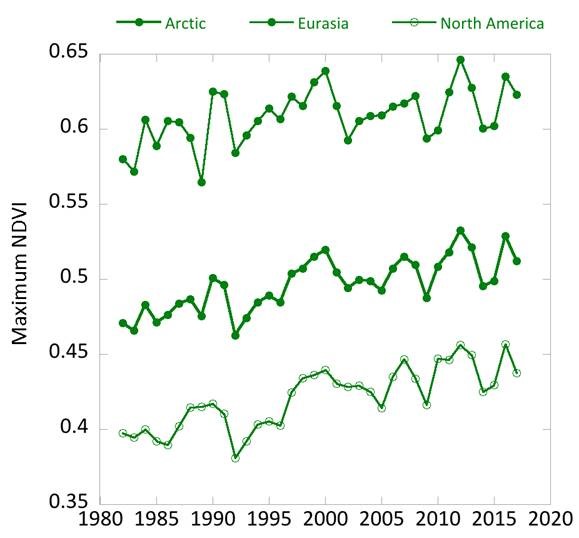
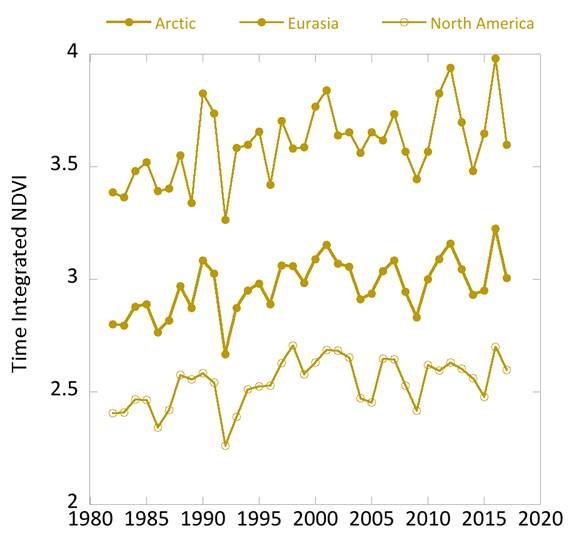
Despite the decline from 2016 to 2017, all of the NDVI values for 2017 were either equal to or greater than mean values for the 36-year record. MaxNDVI values for 2017 ranked 8th, 9th, and 8th for the Arctic, Eurasian Arctic, and North American Arctic, respectively. TI-NDVI values ranked 15th, 18th, and 13th for the Arctic, Eurasian Arctic, and North American Arctic, respectively. In order to compare NDVI changes with those of summer warmth (a key control of NDVI), we can use the remotely-sensed Land Surface Temperatures (LST), from the same sensors as those providing the NDVI values. The Summer Warmth Indices (SWI: sum of mean monthly temperatures >0° C) for the Arctic as a whole and for the North American Arctic were still relatively high, ranking 4th and 3rd, respectively, over the 36-year record. For the Eurasian Arctic, the SWI declined by 24.6% between 2016 and 2017, and the 2017 value was ranked 21st over the record.
References
Ackerman, D. E., D. Griffin, S. E. Hobbie, K. Popham, E. Jones, and J. C. Finlay, 2018: Uniform shrub growth response to June temperature on the North Slope of Alaska. Environ. Res. Lett., 13, 044013.
Becher, M., J. Olofsson, L. Berglund, and J. Klaminder, 2018: Decreased cryogenic disturbance: one of the mechanisms behind the vegetation change in the Arctic. Polar Biol., 41, 101-110.
Bhatt, U. S., D. A. Walker, M. K. Raynolds, P. A. Bieniek, H. E. Epstein, J. C. Comiso, J. E. Pinzon, C. J. Tucker, and I. V. Polyakov, 2013: Recent declines in warming and vegetation greening trends over pan-Arctic tundra. Remote Sens., 4, 4229-4254.
Bjorkman, A. D., et al., 2018: Plant functional trait change across a warming tundra biome. Nature, 562, 57-62, doi: 10.1038/s41586-018-0563-7.
Christiansen, C. T., M. J. Lafreniere, G. H. R. Henry, and P. Grogan, 2018: Long-term deepened snow promotes tundra evergreen shrub growth and summertime ecosystem net CO2 gain but reduces soil carbon and nutrient pools. Global Change Biol., 24, 3508-3525.
Frost, G. V., H. E. Epstein, D. A. Walker, G. Matyshak, and K. Ermokhina, 2018: Seasonal and long-term changes in active-layer temperatures after tall shrubland expansion and succession in arctic tundra. Ecosystems, 21, 507-520.
Global Inventory Modeling and Mapping Studies (GIMMS), 2013: Available online: http://gcmd.nasa.gov/records/GCMD_GLCF_GIMMS.html
Karlsen, S. R., H. B. Anderson, R. van der Wal, and B. B. Hansen, 2018: A new NDVI measure that overcomes data sparsity in cloud-covered regions predicts annual variation in ground-based estimates of high arctic plant productivity. Environ. Res. Lett., 13:025011.
Keenan, T. F., and W. J. Riley, 2018: Greening of the land surface in the world’s cold regions consistent with recent warming. Nature Clim. Change, 8, 825-828, doi: 10.1038/s41558-018-0258-y.
Lafleur, P. M., and E. R. Humphreys, 2018: Tundra shrub effects on growing season energy and carbon dioxide exchange. Environ. Res. Lett., 13, 055001.
Lara, M. J., I. Nitze, G. Grosse, P. Martin, and A. D. McGuire, 2018: Reduced arctic tundra productivity linked with landform and climate change interactions. Sci. Rep., 8, 2345.
Maliniemi, T., J. Kapfer, P. Saccone, A. Skog, and R. Virtanen, 2018: Long-term vegetation changes of treeless heath communities in northern Fennoscandia: Links to climate change trends and reindeer grazing. J. Veg. Sci., 29, 469-479.
Myers-Smith, I. H., and D. S. Hik, 2018: Climate warming as a driver of tundra shrubline advance. J. Ecol., 106, 47-560.
Olofsson J., L. Oksanen, T. Callaghan, P. E. Hulme, T, Oksanen, and O. Suominen, 2009: Herbivores inhibit climate-driven shrub expansion on the tundra. Global Change Biol., 15, 2681-2693.
Opala-Owczarek, M., E. Piroznikow, P. Owczarek, W. Szymanski, B. Luks, D. Kepski, M. Szymanowski, B. Wojtun, and K. Migala, 2018: The influence of abiotic factors on the growth of two vascular plant species (Saxifraga oppositifolia and Salix polaris) in the High Arctic. Catena, 163, 219-232.
Parmentier, F. -J., D. Rasse, M. Lund, J. W. Bjerke, B. G. Drake, S. Weldon, H. Tømmervik, and G. H. Hansen, 2018: Vulnerability and resilience of the carbon exchange of a subarctic peatland to an extreme winter event. Environ. Res. Lett., 13, 065009.
Phoenix, G. K., and J. W. Bjerke, 2016: Arctic browning: Extreme events and trends reversing arctic greening. Global Change Biol., 22, 2960-2962.
Pinzon, J., and C. Tucker, 2014: A non-stationary 1981-2014 AVHRR NDVI3g time series. Remote Sens., 6, 6929-6960, doi: 10.3390/rs6086929.
Raynolds M. K., D. A. Walker, H. E. Epstein, J. E. Pinzon, and C. J. Tucker, 2012: A new estimate of tundra-biome phytomass from trans-Arctic field data and AVHRR NDVI. Remote Sens. Lett., 3, 403-411.
Reichle, L. M., H. E. Epstein, U. S. Bhatt, M. K. Raynolds, and D. A. Walker, 2018: Spatial heterogeneity of the temporal dynamics of Arctic tundra vegetation. Geophys. Res. Lett., 45, 9206-9215, doi: 10.1029/2018GL078820.
Treharne, R., J. W. Bjerke, L. D. Emberson, H. Tømmervik, and G. K. Phoenix, 2016: Arctic browning: Vegetation damage and implications for carbon balance. Geophys. Res. Abstracts, 18, EGU2016-8838.
Wang, X., T. Wang, H. Guo, D. Liu, Y. T. Zhao, T. T. Zhang, Q. Liu, and S. L. Piao, 2018: Disentangling the mechanisms behind winter snow impact on vegetation activity in northern ecosystems. Global Change Biol., 24, 1651-1662.
Weijers, S., I. H. Myers-Smith, and J. Loeffler, 2018: A warmer and greener cold world: summer warming increases shrub growth in the alpine and high arctic tundra. Erdkunde, 72, 63-85.
Wheeler, H. C., T. T. Hoye, and J. -C. Svenning, 2018: Wildlife species benefitting from a greener Arctic are most sensitive to shrub cover at leading range edges. Global Change Biol., 24, 212-223.
Xu, X., W. J. Riley, C. D. Koven, and G. S. Jia, 2018: Observed and simulated sensitivities of spring greenup to preseason climate in northern temperate and boreal regions. J. Geophys. Res.–Biogeosci., 123, 60-78.
November 13, 2018