Official websites use .gov
A .gov website belongs to an official government organization in the United States.

Secure .gov websites use HTTPS
A lock ( ) or https:// means you’ve safely connected to the .gov website. Share sensitive information only on official, secure websites.

July 2016

Why is the Arctic So Sensitive to Climate Change and Why Do We Care?

That the Arctic should be especially sensitive to climate change was recognized in the 19th century. The primary reason for this sensitivity is that an initial warming (or cooling) sets in motion a chain of events that amplify the warming or cooling. This chain of events is known as the albedo feedback. Albedo is a measure of how white, or reflective, a surface is.

The Warmest January/February in the Arctic

The first two months of 2016 set new records in the Arctic, with the warmest January and February on record, and the lowest sea ice cover in February. The area-averaged temperature anomaly (between 66°N and 90°N) has reached a record of 5.8°C (10.4°F)…

River Discharge

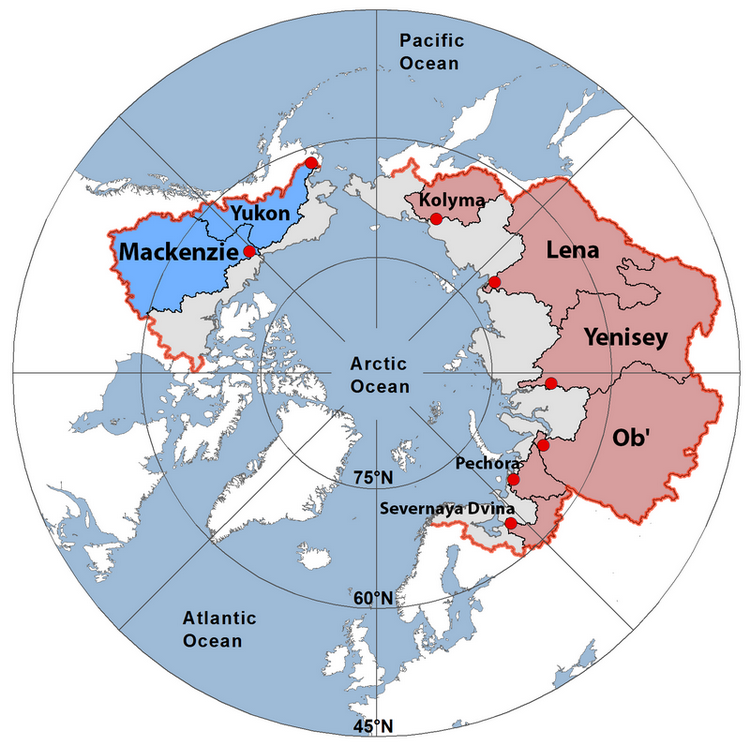
River discharge integrates hydrologic processes occurring throughout the surrounding landscape; consequently, changes in the discharge of large rivers can be a sensitive indicator of widespread changes in watersheds (Rawlins et al. 2010, Holmes et al. 2012).

Executive Summary

The Arctic Report Card (www.arctic.noaa.gov/reportcard/) considers a range of environmental observations throughout the Arctic, and is updated annually. As in previous years, the 2015 update to the Arctic Report Card highlights the changes that continue to occur in both the physical and biological components of the Arctic environmental system.

Greenland Ice Sheet

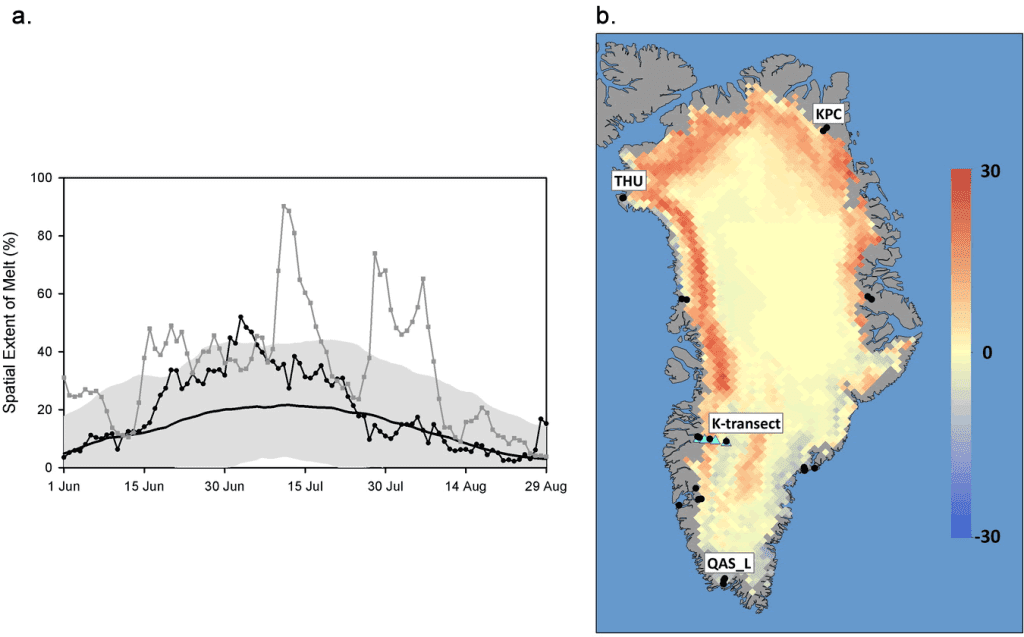
Estimates of the spatial extent of melting across the Greenland ice sheet in 2015, derived from spaceborne brightness temperatures recorded by the Special Sensor Microwave Imager/Sounder (SSMIS) passive microwave radiometer (e.g., Mote 2007; Tedesco 2007; Tedesco et al. 2013), show that melting occurred over more than half of the ice sheet for the first time since the exceptional melt events of July 2012…

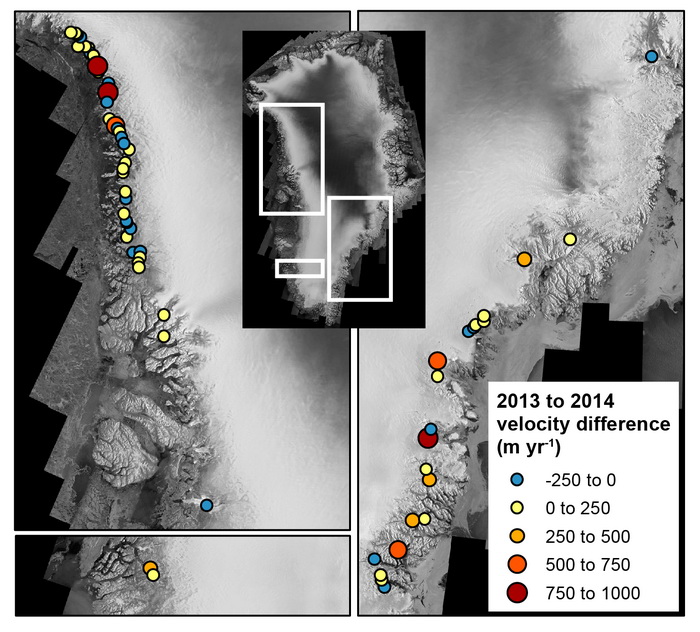
Greenland Ice Sheet Surface Velocity: New Data Sets

Ice loss from the Greenland Ice Sheet (see Fig. 3.4 in the essay on the Greenland Ice Sheet) is a principal source of sea level rise. During 2009-2012, the Greenland Ice Sheet lost ~380 Gt of ice per year, contributing ~1.05 mm yr-1 to sea level rise (Enderlin et al. 2014), compared with a global mean sea level rise of ~3.2 mm yr-1 during 1993-2010 (IPCC 2013). Ice loss occurs through two primary processes: (1) surface melt and runoff from across the ice sheet, and (2) calving of icebergs into the ocean from marine-terminating outlet glaciers.

Scroll to Top

Contact Our Team

Fill out the form below, and we will be in touch shortly.
Contact Information
Vehicle Information
Preferred Date and Time Selection