M. Tedesco1,2, J. E. Box3, J. Cappelen4, R. S. Fausto3, X. Fettweis5, K. Hansen4, T. Mote6, C. J. P. P. Smeets7, D. van As3, R. S. W. van de Wal7, J. Wahr8
1The City College of New York, New York, NY, USA
2Lamont Doherty Earth Observatory of Columbia University, Palisades, NY, USA
3Geological Survey of Denmark and Greenland, Copenhagen, Denmark
4Danish Meteorological Institute, Copenhagen, Denmark
5University of Liege, Liege, Belgium
6Department of Geography, University of Georgia, Athens, Georgia, USA
7Institute for Marine and Atmospheric Research Utrecht, Utrecht University, Utrecht, The Netherlands
8Department of Physics & Cooperative Institute for Research in Environmental Sciences, University of Colorado, Boulder, CO, USA
In memoriam. This essay is dedicated to the memory of John Wahr8 (June 1951 – November 2015) for his exceptional contribution to studying and promoting the understanding of the interactions between the solid layers of the Earth and the overlying atmosphere, oceans and ice sheets, and for his unique and outstanding human qualities.
Highlights
- Melt area in 2015 exceeded more than half of the ice sheet on July 4th for the first time since the exceptional melt events of July 2012, and was above the 1981-2010 average on 54.3% of days (50 of 92 days).
- The length of the melt season was as much as 30-40 days longer than average in the western, northwestern and northeastern regions, but close to and below average elsewhere on the ice sheet.
- Average summer albedo in 2015 was below the 2000-2009 average over the northwest and above the average over the southwest portion of the Greenland ice sheet. In July, albedo averaged over the entire ice sheet was lower than in 2013 and 2014, but higher than the lowest value on record observed in 2012.
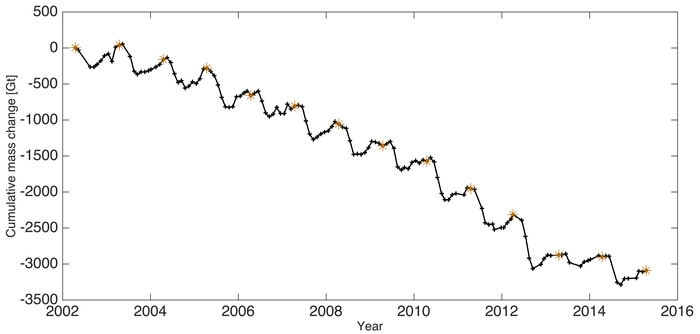
- Ice mass loss of 186 Gt over the entire ice sheet between April 2014 and April 2015 was 22% below the average mass loss of 238 Gt for the 2002- 2015 period, but was 6.4 times higher than the 29 Gt loss of the preceding 2013-2014 season.
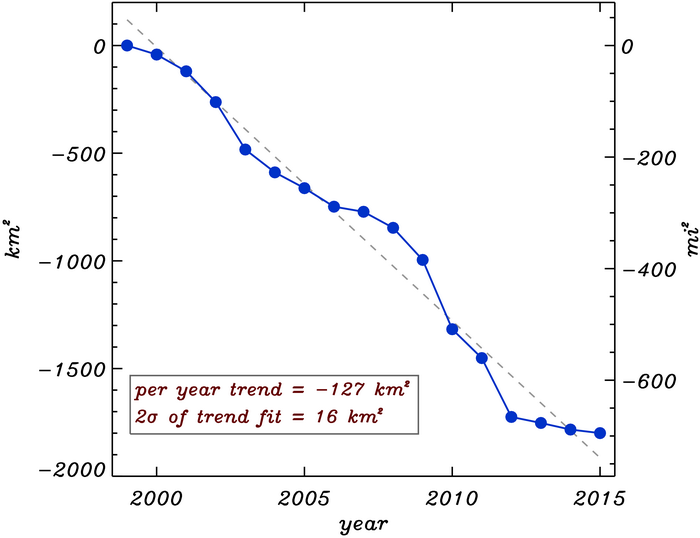
- The net area loss from marine-terminating glaciers during 2014-2015 was 16.5 km2. This was the lowest annual net area loss of the period of observations (1999-2015) and 7.7 times lower than the annual average area change trend of -127 km2.
Surface Melting
Estimates of the spatial extent of melting across the Greenland ice sheet in 2015, derived from spaceborne brightness temperatures recorded by the Special Sensor Microwave Imager/Sounder (SSMIS) passive microwave radiometer (e.g., Mote 2007; Tedesco 2007; Tedesco et al. 2013), show that melting occurred over more than half of the ice sheet for the first time since the exceptional melt events of July 2012 (Nghiem et al. 2012). The 2015 melt extent exceeded two standard deviations above the 1981-2010 average, reaching a maximum of 52% of the ice sheet area on 4 July (Fig. 3.1a). For comparison, melt extent in 2014 reached a maximum of 39% of the ice sheet area and ~90% in 2012.
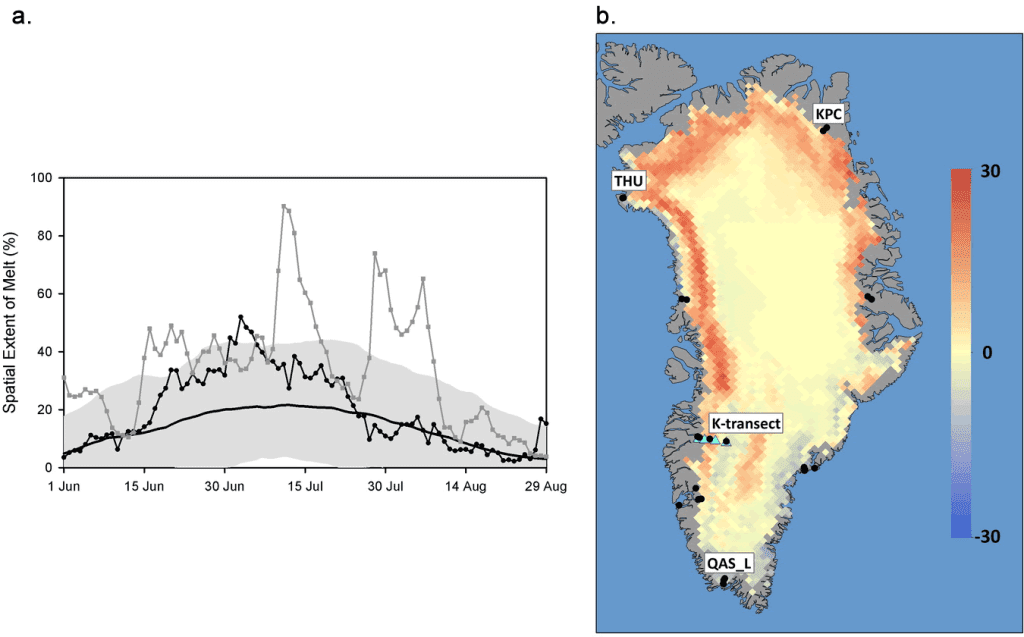
The number of melting days along the southwestern and southeastern margins of the ice sheet was close to or below the long-term average (Fig. 3.1b), with maximum negative anomalies (increased relative to the 1981-2010 average) being of the order of 5-10 days. In contrast, the number of melt days in the northeastern, western and northwestern regions, was up to 30-40 days above the 1981-2010 average and setting new records for meltwater production and runoff in the northwestern region (Tedesco et al. manuscript in preparation).
Surface Mass Balance
The surface mass balance for September 2014 through September 2015 measured along the southwestern portion of the ice sheet at the K-transect (Fig. 3.1b; van de Wal et al. 2005, 2012), was the third least negative since the beginning of the record in 1990; not since the 1991-1992 (when melting was low due to the Mount Pinatubo eruption) and 1995-1996 balance years has so little ice been lost (Fig. 3.2a). This is consistent with the negative anomalies detected by the SSMI/S along the southwestern portion of the ice sheet. Data from location S5 (~540 m a.s.l., 67.10°N, 50.09°W), in the ablation area, show that the melt season started approximately 15-20 days later than the 2008-2014 average, then decreased substantially near the end of July and remained low during August (Fig. 3.2b). At station S9 (~1500 m a.s.l. near the equilibrium line [the lowest altitude at which winter snow survives], 67.05°N, 48.25°W), melting ceased due to snowfall at the end of July and there was no melting during August (Fig. 3.2c).
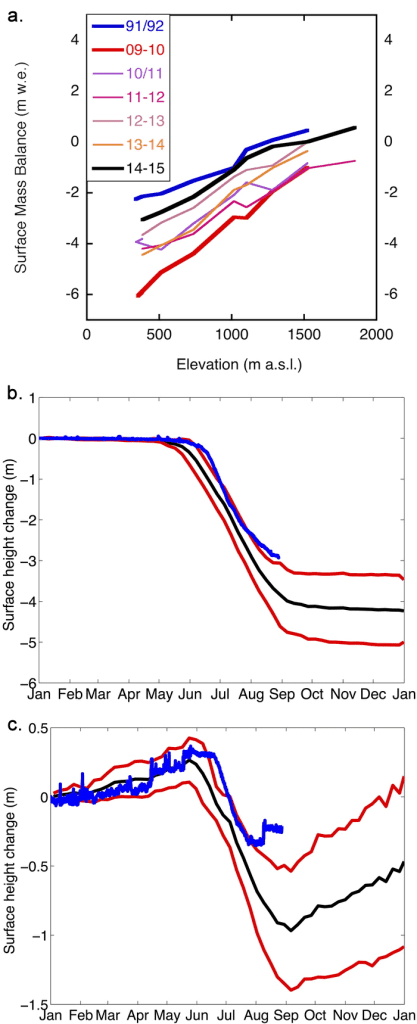

Anomalously low melt in 2015 with respect to the 2008-2014 average at PROMICE network stations (van As et al. 2011; Fausto et al. 2012) is consistent with the K-transect. At all PROMICE stations (Fig. 3.1b), ablation in summer 2015 was relatively low with respect to the 2008-2014 observational period, except at the most northerly latitudes (Kronprins Christian Land, KPC, 80°N, 25°W; Thule, THU, 76°N, 68°W), where melt totals were slightly above average. The highest recorded melt in 2015, 5.1 m on the Qassimiut lobe (QAS_L station, 61°N, 47°W), was little more than half the record-setting 9.3 m at that site in 2010 (Fausto et al. 2012).
Albedo
Albedo, a measure of surface reflectivity, is the ratio of reflected solar radiation to total incoming solar radiation. A relatively low albedo promotes increased melting, with net solar radiation being the major driver of summer surface melt over Greenland. Average albedo in summer 2015, derived from data collected by the Moderate-resolution Imaging Spectroradiometer (MODIS, after Box et al. 2012), was below the 2000-2009 average in the northwestern region and above the average in the southwestern region (Fig. 3.3a). This is consistent with the negative surface mass balance and melting day anomalies measured over the same region. The 2000-2009 reference period is used here because MODIS observations began in 2000. The trend of mean summer albedo over the entire ice sheet for the period 2000-2015 is -5.5±0.4% (Fig. 3.3b).
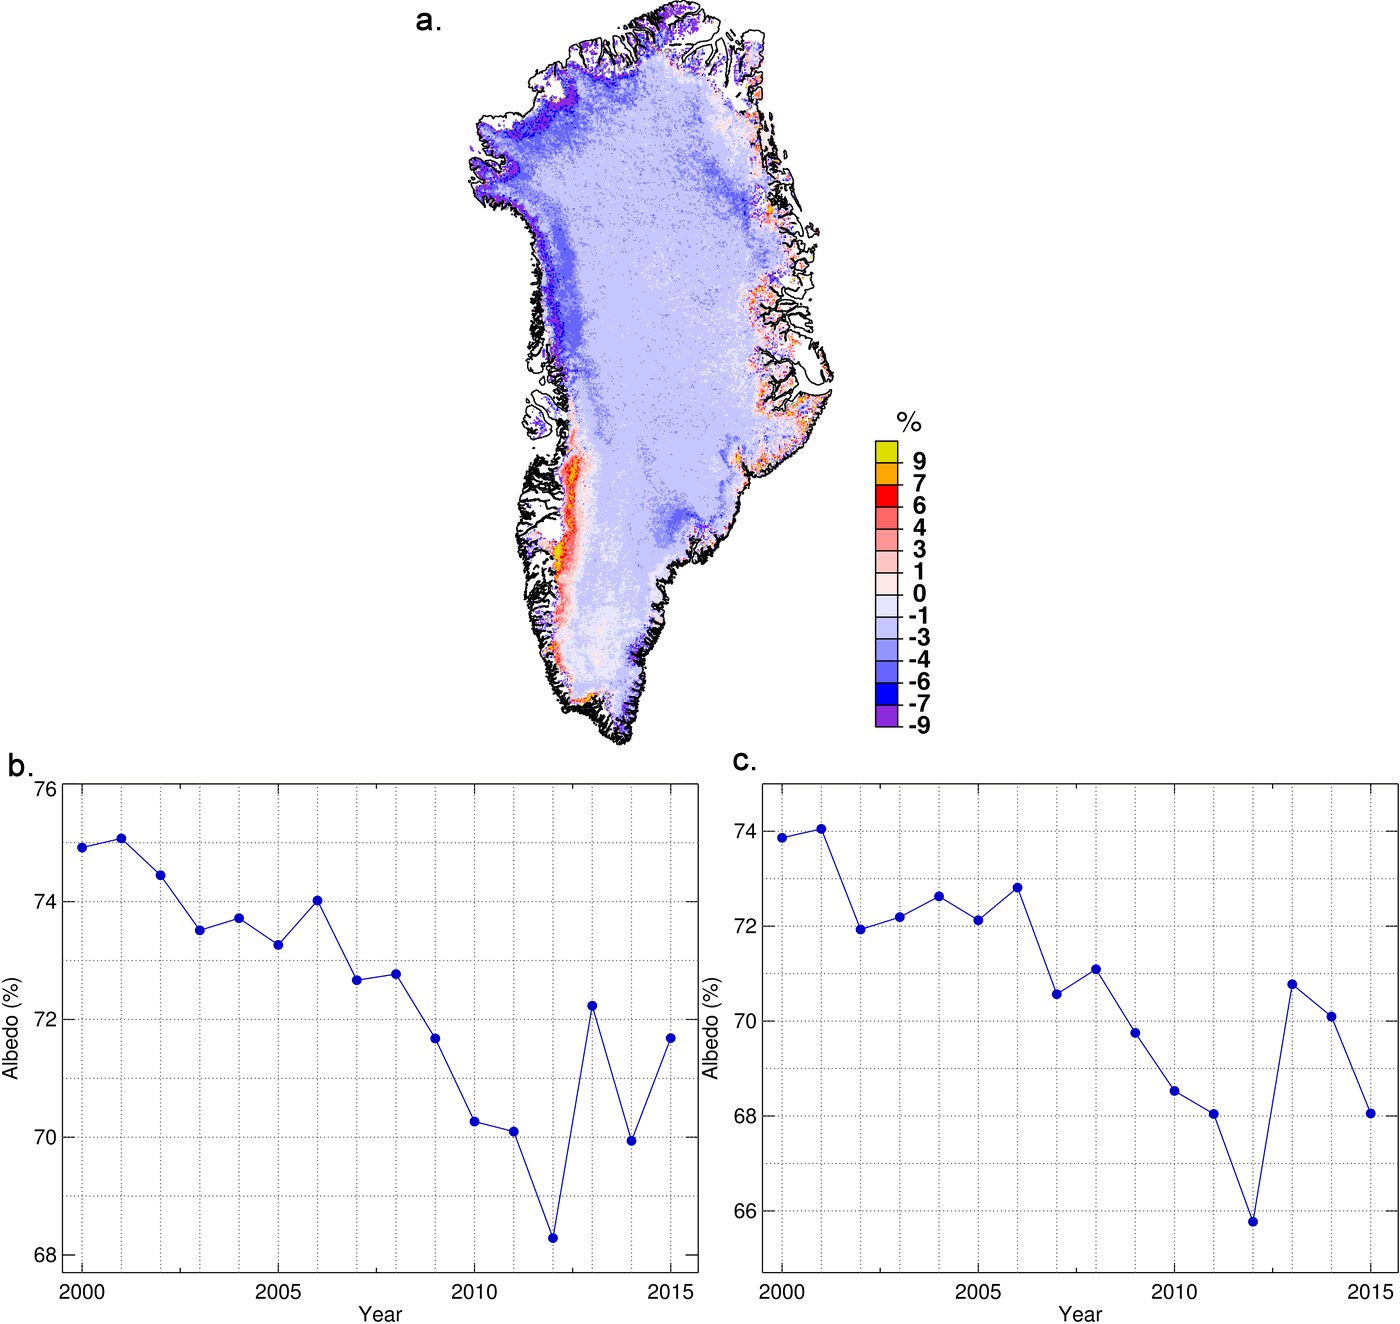

In July 2015, when extensive melting occurred (Fig. 3.1a), albedo averaged over the entire ice sheet was 68.1%, i.e., lower than the 2013 and 2014 values and higher than the lowest average July albedo of 65.8% recorded in 2012 (Fig. 3.3c). Albedo in July 2015 was anomalously low (as much as 15-20% below average) along the northwestern ice sheet and along the west coast, where large positive melting days anomalies were observed (Fig. 3.1b). But, over the entire summer, the albedo anomaly along the west coast was positive. The summer mean albedo in 2015 was higher than the albedo recorded in 2014 and close to the value recorded in 2013 (Fig. 3.3b), mostly because of the relatively short melt season and early snowfall in August.
Total Ice Mass
GRACE satellite data (Velicogna and Wahr 2013) are used to estimate monthly changes in the total mass of the Greenland ice sheet (Fig. 3.4). Between mid-April 2014 and mid-April 2015, roughly corresponding to the period between the beginning of the two consecutive melt seasons, the 186 Gt of ice loss was 22% lower than the average April-to-April mass loss (238 Gt) during 2002-2015. For comparison, since GRACE measurements began in 2002, the smallest April-to-April mass loss was 29 Gt during 2013-2014 and the largest was 562 Gt during 2012-2013.

Marine-terminating Glaciers
Marine-terminating glaciers are the outlets via which the inland ice sheet discharges to the ocean. When in balance, the rate of iceberg calving (by area) is balanced by the seaward flow of the ice (see the essay on Greenland Ice Sheet Surface Velocity: New Data Sets for further information on the velocity of these glaciers). Analysis of LANDSAT and ASTER imagery since 1999 of 45 of the widest and fastest-flowing marine-terminating glaciers reveals that they continue to retreat, although the rate of retreat has slowed since 2012 (Fig. 3.5). Between the end of the 2014 melt season and the end of the 2015 melt season, 22 of the 45 glaciers had retreated, but the advance of 9 relatively wide glaciers resulted in a low 1-year net area loss of 16.5 km2. This is the lowest annual net area loss in the 16-year period of observations (1999-2015) and 7.7 times lower than the annual average area change trend of -127 km2 (Fig. 3.5). The advance of Petermann Glacier (0.684 km advance across a width of 17.35 km gives an area increase of 11.87 km2) and Kangerdlugssuaq Glacier (1.683 km advance across a width of 6.01 km gives an area increase of 10.12 km2) contributed to the low net area loss of the 45 glaciers in 2014-2015.

Weather
Measurements at weather stations of the Danish Meteorological Institute (DMI, Cappelen 2015, Table 3.1) during spring 2015 indicate that temperatures at Nuuk (64.2°N,51.8°W), Paamiut (62.0°N, 49.7°W), Narsarsuaq (61.2°N,45.4°W), Qaqortoq (60.7°N, 46.0°W) and Prins Christian Sund (60.0°N,43.2°W) in south and southwest Greenland were 1.5 standard deviations below the 1981-2010 average, with temperature anomalies (relative to the 1981-2010 average) as much as -2.6°C at Narsarsuaq. The average May temperature at Danmarkshavn (76.8°N, 18.8°W) set a new record low, with a -4.6°C anomaly relative to the 1981-2010 average. These widespread low temperatures are consistent with the strong negative spring temperature anomaly centered over Greenland (see Fig. 1.2c in the essay on Air Temperature). Danmarkshavn also experienced the warmest January on record, with a +7.7 °C anomaly relative to the 1981-2010 average. Summer average temperature anomalies were positive at most stations around the Greenland coastline, with anomalies exceeding one standard deviation at Pituffik (76.5°N, 68.8°W, +1.2ºC), Upernavik (72.8°N, 56.2°W, +1.2°C), Nuuk (64.2°N, 51.8°W, +1.1°C) and Danmarkshavn (+0.9 °C). A new record August low temperature of -39.6 °C occurred on August 28 at Summit (3216 m a.s.l., 72.5796°N, 38.4592°W).
| Location | First year of record |
Statistics | SON | DJF | MAM | JJA |
|---|---|---|---|---|---|---|
| Pituffik/Thule AFB 76.5°N 68.8°W |
1948 | Anomaly (°C) | 1.3 | -1.4 | 0.7 | 1.2 |
| St. Deviation (SD) | 0.9 | -0.6 | 0.2 | 1.2 | ||
| Max. Year | 2010 | 1986 | 1953 | 1957 | ||
| Min. Year | 1964 | 1949 | 1992 | 1996 | ||
| Upernavik 72.8°N 56.2°W |
1873 | Anomaly (°C) | 1.2 | -0.5 | -0.8 | 1.2 |
| SD | 1.0 | 0.0 | -0.5 | 1.5 | ||
| Max. Year | 2010 | 1947 | 1932 | 2012 | ||
| Min. Year | 1917 | 1983 | 1896 | 1922 | ||
| Kangerlussuaq 67.0°N 50.7°W |
1949 | Anomaly (°C) | -0.6 | -2.9 | -2.4 | 0.2 |
| SD | -0.3 | -0.9 | -0.9 | 0.1 | ||
| Max. Year | 2010 | 1986 | 2005 | 2014 | ||
| Min. Year | 1982 | 1983 | 1993 | 1983 | ||
| Ilulissat 69.2°N 51.1°W |
1873 | Anomaly (°C) | 0.5 | -2.2 | -1.2 | -0.2 |
| SD | 0.6 | -0.4 | -0.5 | 0.4 | ||
| Max. Year | 2010 | 1929 | 1932 | 1960 | ||
| Min. Year | 1884 | 1884 | 1887 | 1972 | ||
| Aasiaat 68.7°N 52.8°W |
1951 | Anomaly (°C) | 0.8 | -1.6 | -0.6 | 1.0 |
| SD | 0.9 | -0.6 | -0.4 | 0.9 | ||
| Max. Year | 2010 | 2010 | 2010 | 2012 | ||
| Min. Year | 1986 | 1984 | 1993 | 1972 | ||
| Nuuk 64.2°N 51.8°W |
1873 | Anomaly (°C) | 0.4 | -1.8 | -2.1 | 1.1 |
| SD | 0.6 | -0.6 | -1.5 | 1.1 | ||
| Max. Year | 2010 | 2010 | 1932 | 2012 | ||
| Min. Year | 1898 | 1984 | 1993 | 1914 | ||
| Paamiut 62.0°N 49.7°W |
1958 | Anomaly (°C) | 0.6 | -0.7 | -2.2 | -0.1 |
| SD | 0.5 | -0.5 | -1.3 | 0.0 | ||
| Max. Year | 2010 | 2010 | 2005 | 2010 | ||
| Min. Year | 1982 | 1984 | 1993 | 1969 | ||
| Narsarsuaq 61.2°N 45.4°W |
1961 | Anomaly (°C) | 0.1 | -2.0 | -2.6 | 0.5 |
| SD | 0.2 | -0.8 | -1.3 | 0.7 | ||
| Max. Year | 2010 | 2010 | 2010 | 2012 | ||
| Min. Year | 1963 | 1984 | 1989 | 1983 | ||
| Quaqortoq 60.7°N 46.0°W |
1873 | Anomaly (°C) | 0.1 | -1.8 | -2.2 | -0.6 |
| SD | 0.5 | -0.5 | -1.5 | -0.5 | ||
| Max. Year | 2010 | 2010 | 1932 | 1928 | ||
| Min. Year | 1874 | 1884 | 1989 | 1874 | ||
| Danmarkshavn 76.8°N 18.8°W |
1949 | Anomaly (°C) | 1.5 | 1.6 | 0.0 | 0.9 |
| SD | 1.2 | 1.0 | 0.0 | 1.3 | ||
| Max. Year | 2002 | 2005 | 1976 | 2008 | ||
| Min. Year | 1971 | 1967 | 1966 | 1955 | ||
| Ittoqqortoormiut 70.4°N 22.0°W |
1948 | Anomaly (°C) | 2.2 | 1.1 | 0.9 | -0.2 |
| SD | 1.7 | 0.8 | 0.9 | 0.6 | ||
| Max. Year | 2002 | 2014 | 1996 | 1949 | ||
| Min. Year | 1951 | 1966 | 1956 | 1955 | ||
| Tasiilaq 65.6°N 37.6°W |
1895 | Anomaly (°C) | 1.1 | 0.3 | 1.1 | 0.2 |
| SD | 1.2 | 0.4 | 0.6 | 0.0 | ||
| Max. Year | 1941 | 1929 | 1929 | 2003 | ||
| Min. Year | 1917 | 1918 | 1899 | 1983 | ||
| Prins Christian Sund 60.0°N 43.2°W |
1951 | Anomaly (°C) | 0.6 | -0.7 | -0.9 | -0.3 |
| SD | 0.7 | -0.5 | -1.0 | -0.3 | ||
| Max. Year | 2010 | 2010 | 2005 | 2010 | ||
| Min. Year | 1982 | 1993 | 1989 | 1992 |
Summer 2015 was characterized by negative North Atlantic Oscillation (NAO) conditions, with a mean summer value of -1.3, similar to those of the summers (JJA) of 2007-2012 when enhanced surface melting occurred (Tedesco et al. 2013, 2014). NAO is defined as the difference in atmospheric pressure at sea level between the Icelandic Low and the Azores High and it has been shown to be connected to extreme melting events over Greenland (McLeod and Mote, 2015). However, a distinct difference in the atmospheric circulation associated with the NAO in summer 2015 and the summers of 2007-2012 affected melting on the ice sheet. During the summers of 2007-2012, the 500 mb geopotential height anomaly (typically used to describe NAO atmospheric circulation) with respect to the 1981-2012 average was persistently centered over the ice sheet and southerly air flow advected warm air across the ice sheet. In the summer of 2015 the anomaly was centered over the north-central ice sheet in July, which promoted warm, southerly airflow and enhanced melting. On the other hand, in June and August 2015 the anomaly was centered over the Labrador Sea southwest of Greenland, which promoted the advection of cold air from the Arctic Ocean and reduced melting (Tedesco et al., unpublished manuscript). The spatial distribution of albedo and melting observed by remote sensing (Fig. 3.1) and with the in-situ surface mass balance measurements (e.g., Fig. 3.2) and summer air temperatures (Table 3.1) are consistent with these atmospheric circulation patterns.
References
Box, J. E., and D. T. Decker, 2011: Greenland marine-terminating glacier area changes: 2000-2010. Ann. Glaciol., 52, 91-98, http://dx.doi.org/10.3189/172756411799096312.
Box, J. E., X. Fettweis, J. C. Stroeve, M. Tedesco, D. K. Hall, and K. Steffen, 2012. Greenland ice sheet albedo feedback: thermodynamics and atmospheric drivers. The Cryosphere, 6, 821-839, doi:10.5194/tc-6-821-2012.
Cappelen (ed), 2015. Greenland – DMI Historical Climate Data Collection 1784-2014. Danish Meteorol. Inst. Tech. Rep., 15-04.
Fausto R. S., D. Van As and the PROMICE Project Team (2012) Ablation observations for 2008-2011 from the Programme for Monitoring of the Greenland Ice Sheet (PROMICE). Geol. Surv. Denmark Greenland Bull., 26, 73-76.
Jensen, T., J. E. Box, and C. Hvidberg, unpublished: A sensitivity study of yearly Greenland ice sheet marine terminating outlet glacier changes: 1999-2013. Submitted to J. Glaciol.
McLeod, J. T., and T. L. Mote, 2015: Linking interannual variability in extreme Greenland blocking episodes to the recent increase in summer melting across the Greenland ice sheet. Int. J. Climatol., DOI: 10.1002/joc.4440.
Mote, T. L., 2007: Greenland surface melt trends 1973-2007: Evidence of a large increase in 2007. Geophys. Res. Lett., 34, L22507.
Nghiem, S. V., D. K. Hall, T. L. Mote, M. Tedesco, M. R. Albert, K. Keegan, C. A. Shuman, N. E. DiGirolamo, and G. Neumann, 2012: The extreme melt across the Greenland ice sheet in 2012. Geophys. Res. Lett., 39, L20502, doi:10.1029/2012GL053611.
Tedesco, M., Snowmelt detection over the Greenland ice sheet from SSM/I brightness temperature daily variations. Geophys. Res. Lett., 34, L02504,doi:10.1029/2006GL028466, January 2007.
Tedesco, M., X. Fettweis, T. Mote, J. Wahr, P. Alexander, J. Box, and B. Wouters, 2013: Evidence and analysis of 2012 Greenland records from spaceborne observations, a regional climate model and reanalysis data. The Cryosphere, 7, 615-630.
Tedesco, M., J. E. Box, J. Cappelen, X. Fettweis, T. Mote, A. K. Rennermalm, R. S. W. van de Wal, and J. Wahr, 2014: Greenland Ice Sheet. In Arctic Report Card: Update for 2013, ftp://ftp.oar.noaa.gov/arctic/documents/ArcticReportCard_full_report2013.pdf.
Tedesco, M., T. Mote, J. Jeyaratnam, X. Fettweis, E. Hanna, and K. Briggs, Linkages between exceptional jet-stream conditions and atmospheric and surface records over the Greenland ice sheet during summer 2015. Manuscript in preparation for submission to Nature Climate Change.
Van As D, Fausto RS and PROMICE Project Team. 2011: Programme for Monitoring of the Greenland Ice Sheet (PROMICE): first temperature and ablation records. Geol. Surv. Denmark Greenland Bull., 23, 73-76.
Van de Wal, R. S. W., W. Greuell, M. R. van den Broeke, C.H. Reijmer, and J. Oerlemans, 2005: Surface mass-balance observations and automatic weather station data along a transect near Kangerlussuaq, West Greenland. Ann. Glaciol., 42, 311-316.
Van de Wal, R. S. W., W. Boot, C. J. P. P. Smeets, H. Snellen, M. R. van den Broeke, and J. Oerlemans, 2012: Twenty-one years of mass balance observations along the K-transect, West-Greenland. Earth Syst. Sci. Data, 4, 31-35, doi:10.5194/essd-4-31-2012.
Velicogna, I., and J. Wahr, 2013. Time-variable gravity observations of ice sheet mass balance: precision and limitations of the GRACE satellite data. Geophys. Res. Lett., 40, 3055-3063, doi:10.1002/grl.50527.
December 7, 2015