
J. E. Walsh1,2, S. Bigalke3, S. A. McAfee4, R. Lader2, M. C. Serreze5, and T. J. Ballinger2
1Alaska Center for Climate Assessment and Policy, University of Alaska Fairbanks, Fairbanks, AK, USA
2International Arctic Research Center, University of Alaska Fairbanks, Fairbanks, AK, USA
3Department of Geography, Portland State University, Portland, OR, USA
4Department of Geography, University of Nevada Reno, Reno, NV, USA
5National Snow and Ice Data Center, Cooperative Institute for Research in Environmental Sciences, University of Colorado Boulder, Boulder, CO, USA
Headlines
- Pan-Arctic mean precipitation from ERA5 for the 2022/23 water year ranked as sixth highest on record and was modestly above the 1991-2020 average in all seasons.
- Heavy precipitation events broke existing records at various locations across the Arctic.
- Notable regional anomalies during the 2022/23 water year included a wet winter over parts of Alaska, a dry spring over western Eurasia, a dry summer over northern Canada, and record rains in Scandinavia during August.
Introduction
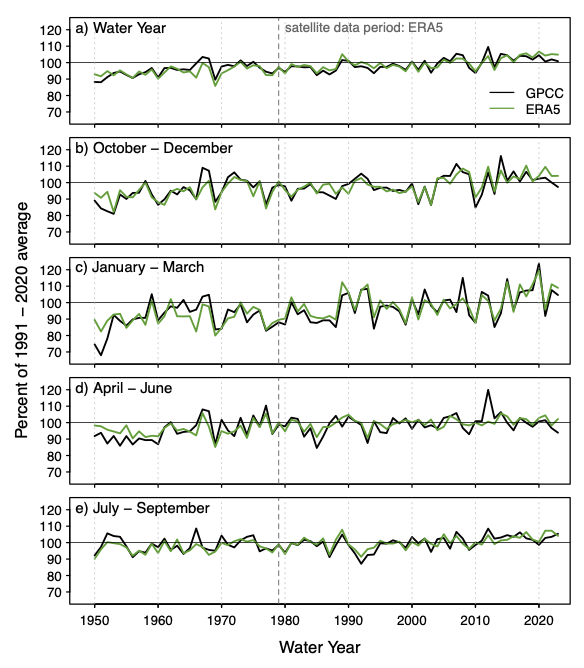
Consistent with Arctic warming (see essay Surface Air Temperature), precipitation in the Arctic is increasing (Box et al. 2021). As shown in the 2022 Arctic Report Card and updated here (Fig. 1), the increase of pan-Arctic mean precipitation is apparent in all seasons (Walsh et al. 2022). However, trends in Arctic precipitation vary regionally (Ye et al. 2021; Yu and Zhong 2021) and interannual variability is large. These variations have important implications for wildfire season severity and for river and lake levels. Warming is also leading to a transition from solid to liquid precipitation in the warmer parts of the Arctic (Box et al. 2021), although the coldest areas of the Arctic are expected to see snowfall increases in the future (McCrystall et al. 2021; Bigalke and Walsh 2022).
2022/23 water year precipitation at a glance
The Arctic experienced notable precipitation anomalies in the 2022/23 water year. The prominent features were (1) a continuation of the trend towards wetter conditions on the pan-Arctic scale, (2) large seasonal anomalies, including a wet winter in parts of Alaska, a dry spring in much of western Eurasia and over the northern North Atlantic, and a dry summer over much of northern Canada, (3) shorter-duration heavy precipitation that broke existing records at various locations within the Arctic (which is not necessarily surprising in a statistical sense given the large area being considered).
Overall, pan-Arctic (north of 60° N) precipitation for the 2022/23 water year in the ERA5 reanalysis was the sixth highest in the 74-year period that began in 1950. The Arctic autumn (October-December), winter (January-March), spring (April-June), and summer (July-September) all ranked among the 12 wettest of their corresponding seasons in the post-1950 period.
Figure 2 shows the ERA5-derived seasonal departures of precipitation during the 2022/23 water year from the 1991-2020 means. For the October-December (OND) period, a dipole pattern is apparent over the North Atlantic subarctic, with positive precipitation anomalies from the U.K. to southern Norway and negative anomalies from Iceland southwest to the Canadian maritime provinces. This pattern coincides with strong positive sea level pressure anomalies over Greenland and northeastern Canada, with negative pressure anomalies west of the U.K. (see essay Surface Air Temperature, Fig. 3a). Positive precipitation anomalies over the Bering Sea are supported by southwesterly gradient wind anomalies associated with strong low-pressure anomalies over eastern Siberia. According to the NOAA National Centers for Environmental Centers (NCEI) (NOAA 2023a, 2023b) analysis, Alaska’s North Slope region experienced its fourth wettest autumn of the past 98 years, consistent with the gradient wind anomaly and the late-season persistence of open water over the Chukchi Sea. However, this regional precipitation feature is not captured in the ERA5 reanalysis.
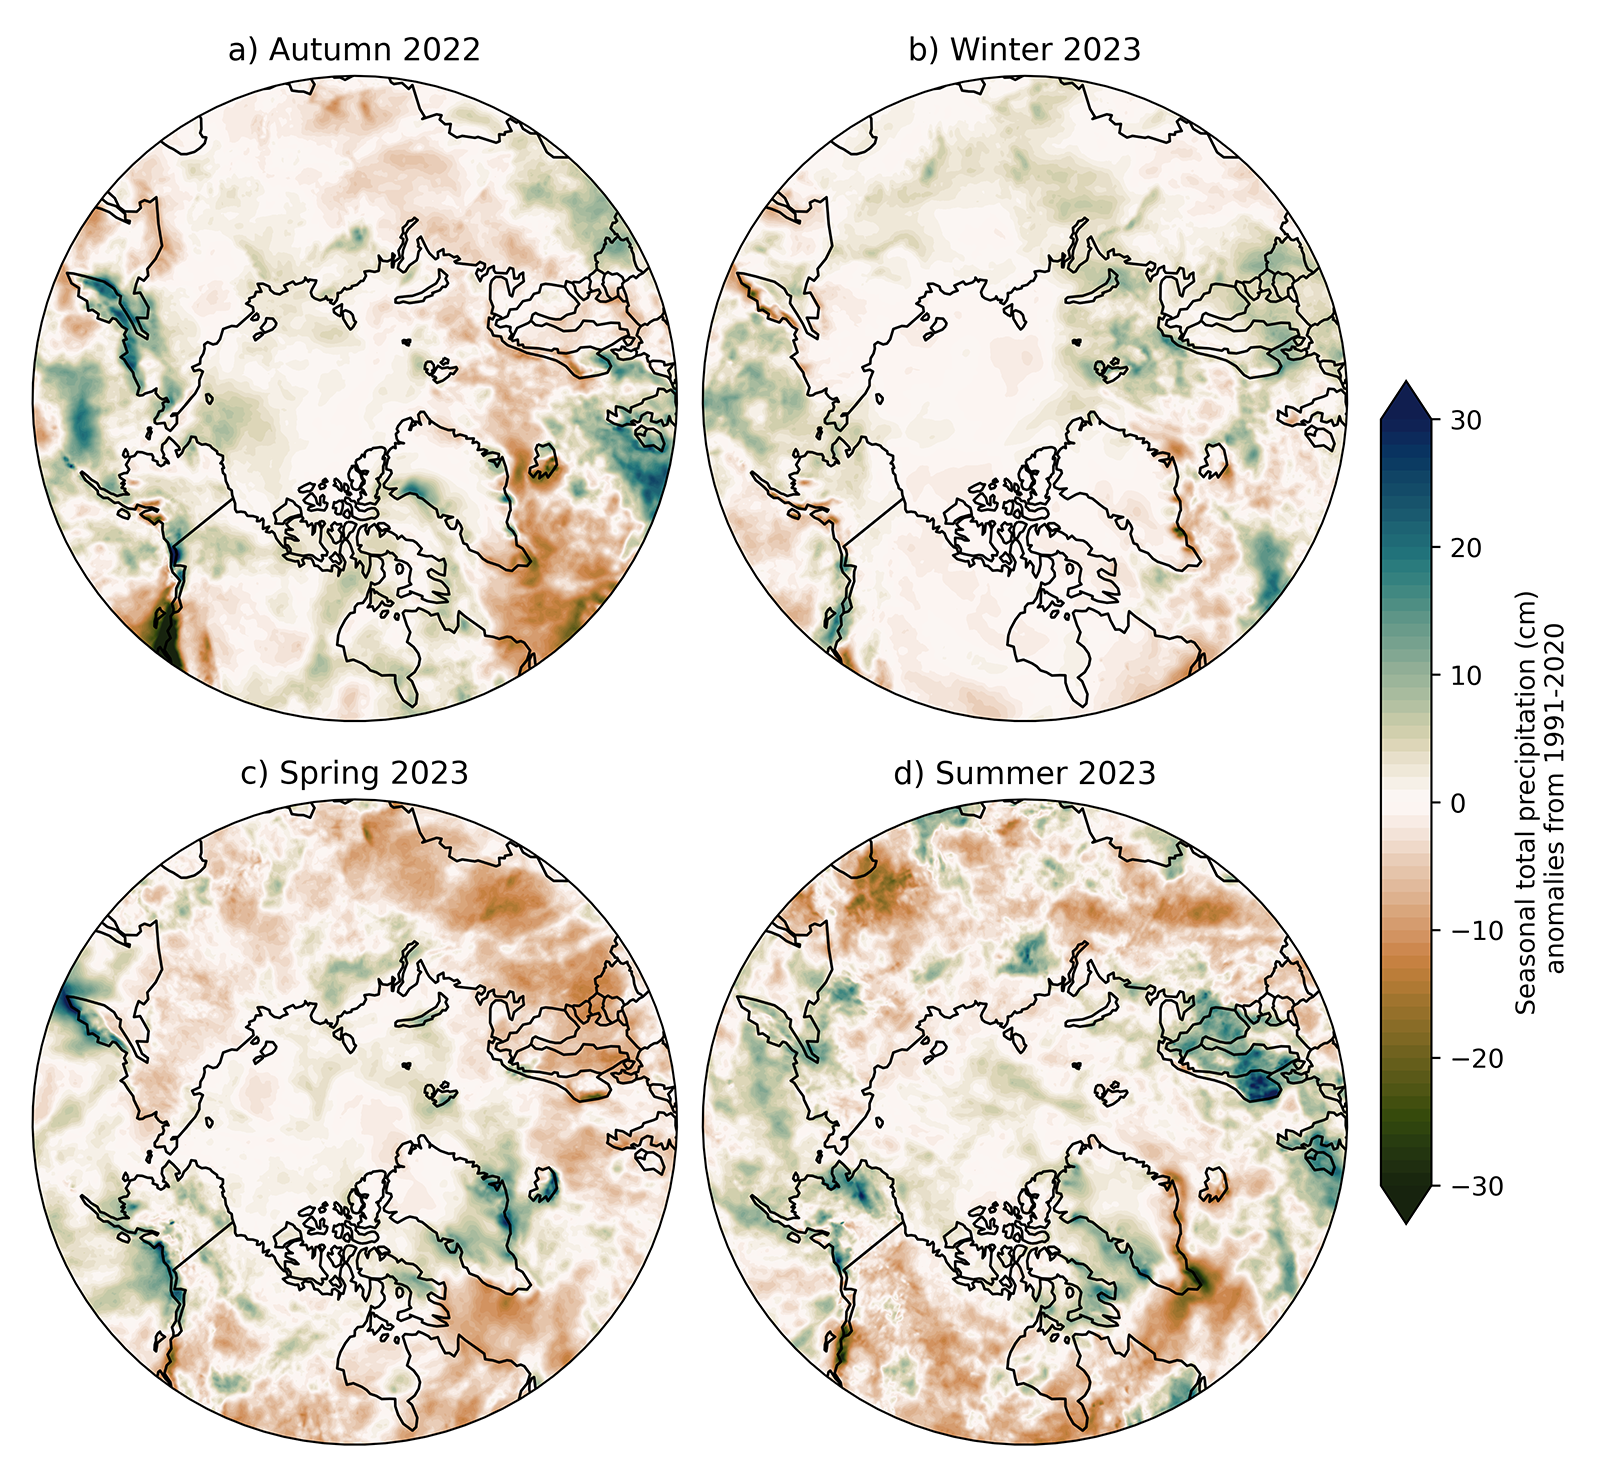
Winter (JFM) precipitation anomalies were generally weak, except for above-normal precipitation in the Bering Sea, the Svalbard region, and south of Iceland. As in the OND season, the wetter-than-normal conditions in the Bering Sea were a consequence of abnormally low pressure north and west of the Bering Sea (see essay Surface Air Temperature, Fig. 3b). According to the NOAA NCEI analysis, Alaska’s West Coast climate region had its second wettest winter in its 99-year period of record. Negative pressure anomalies also extended from Svalbard southeastward to northern Europe during the month of March. During this time, station data showed much above-average precipitation, including some record amounts for March, in a broad east-west band from northern Europe across to northeastern Asia.
A notable feature of the April-June (AMJ) period was a precipitation deficit over northern land areas, including much of Canada and a broad Eurasian region extending from Scandinavia to eastern Russia. The dry conditions were especially prevalent during May in both northern Europe and Canada, setting the stage for the severe wildfire season in Canada. High pressure anomalies over western Eurasia drove the precipitation deficit in Europe, while high temperatures driven by warm advection contributed to the dry conditions in regions of Canada (see essay Surface Air Temperature, Fig. 3c). Meanwhile, Alaska was generally wetter than normal with below-normal temperatures (see essay Surface Air Temperature, Fig. 2c). Parts of the Greenland Ice Sheet saw high precipitation in the form of snow in June (see essay Greenland Ice Sheet).
Finally, July-September (JAS) 2023 was notable for above-average precipitation over northern Europe, including flood-producing rains in early August. Most of Alaska saw above-average precipitation, as did western Greenland and southern Baffin Island. By contrast, precipitation was well below average southeast of Greenland, over southeastern Russia and along the panhandle of Alaska. Below-average precipitation was widespread over much of Eurasia and Canada. Portions of Northwest Territories, Canada were analyzed in severe to extreme drought during August and September (NOAA North American Drought Monitor), and this contributed to wildfires that continued through late summer in the Northwest Territories (see Arctic Wildfire Sidebar).
Historical perspective
The time series in Fig. 1 introduced earlier compares seasonal precipitation from ERA5 and the station-based dataset of the Global Precipitation Climatology Center (GPCC) during 1950-2023. The GPCC dataset is for land only, while ERA5 covers ocean areas as well as land. The seasonal and annual values are plotted as percentages of the corresponding 1991-2020 averages. In all four seasons of the 2022/23 water year the ERA5 values are greater than the 1991-2020 averages. GPCC indicates slightly below-average precipitation in OND and AMJ, and slightly above normal precipitation in JFM and JAS. While the JFM value is less than the previous year’s value, it is still 9% higher than the 1991-2020 average, consistent with the positive trend in cold season Arctic precipitation discussed in the 2022 Arctic Report Card (Walsh et al. 2022). Of particular note is that the water-year total has exceeded the 1991-2020 mean in 15 of the past 20 years, including 2022/23.
Heavy precipitation events
Heavy precipitation events continued in 2022/23. In addition to the extreme seasonal totals noted earlier for several Alaska climate regions from NCEI, based on station data Anchorage set a new record for December precipitation, including the most December snowfall in more than 60 years. Elsewhere, the above-normal summer precipitation in northern Europe included heavy rains in early August. The heaviest rains in 25 years occurred in southern Norway, where water levels and pressure caused a dam to break along Norway’s largest river. Extensive flooding was also reported in Sweden, and the impacts of the heavy rain event extended southward to Denmark and Lithuania. It appears that a rare weather pattern involving two cyclones was responsible for the event.
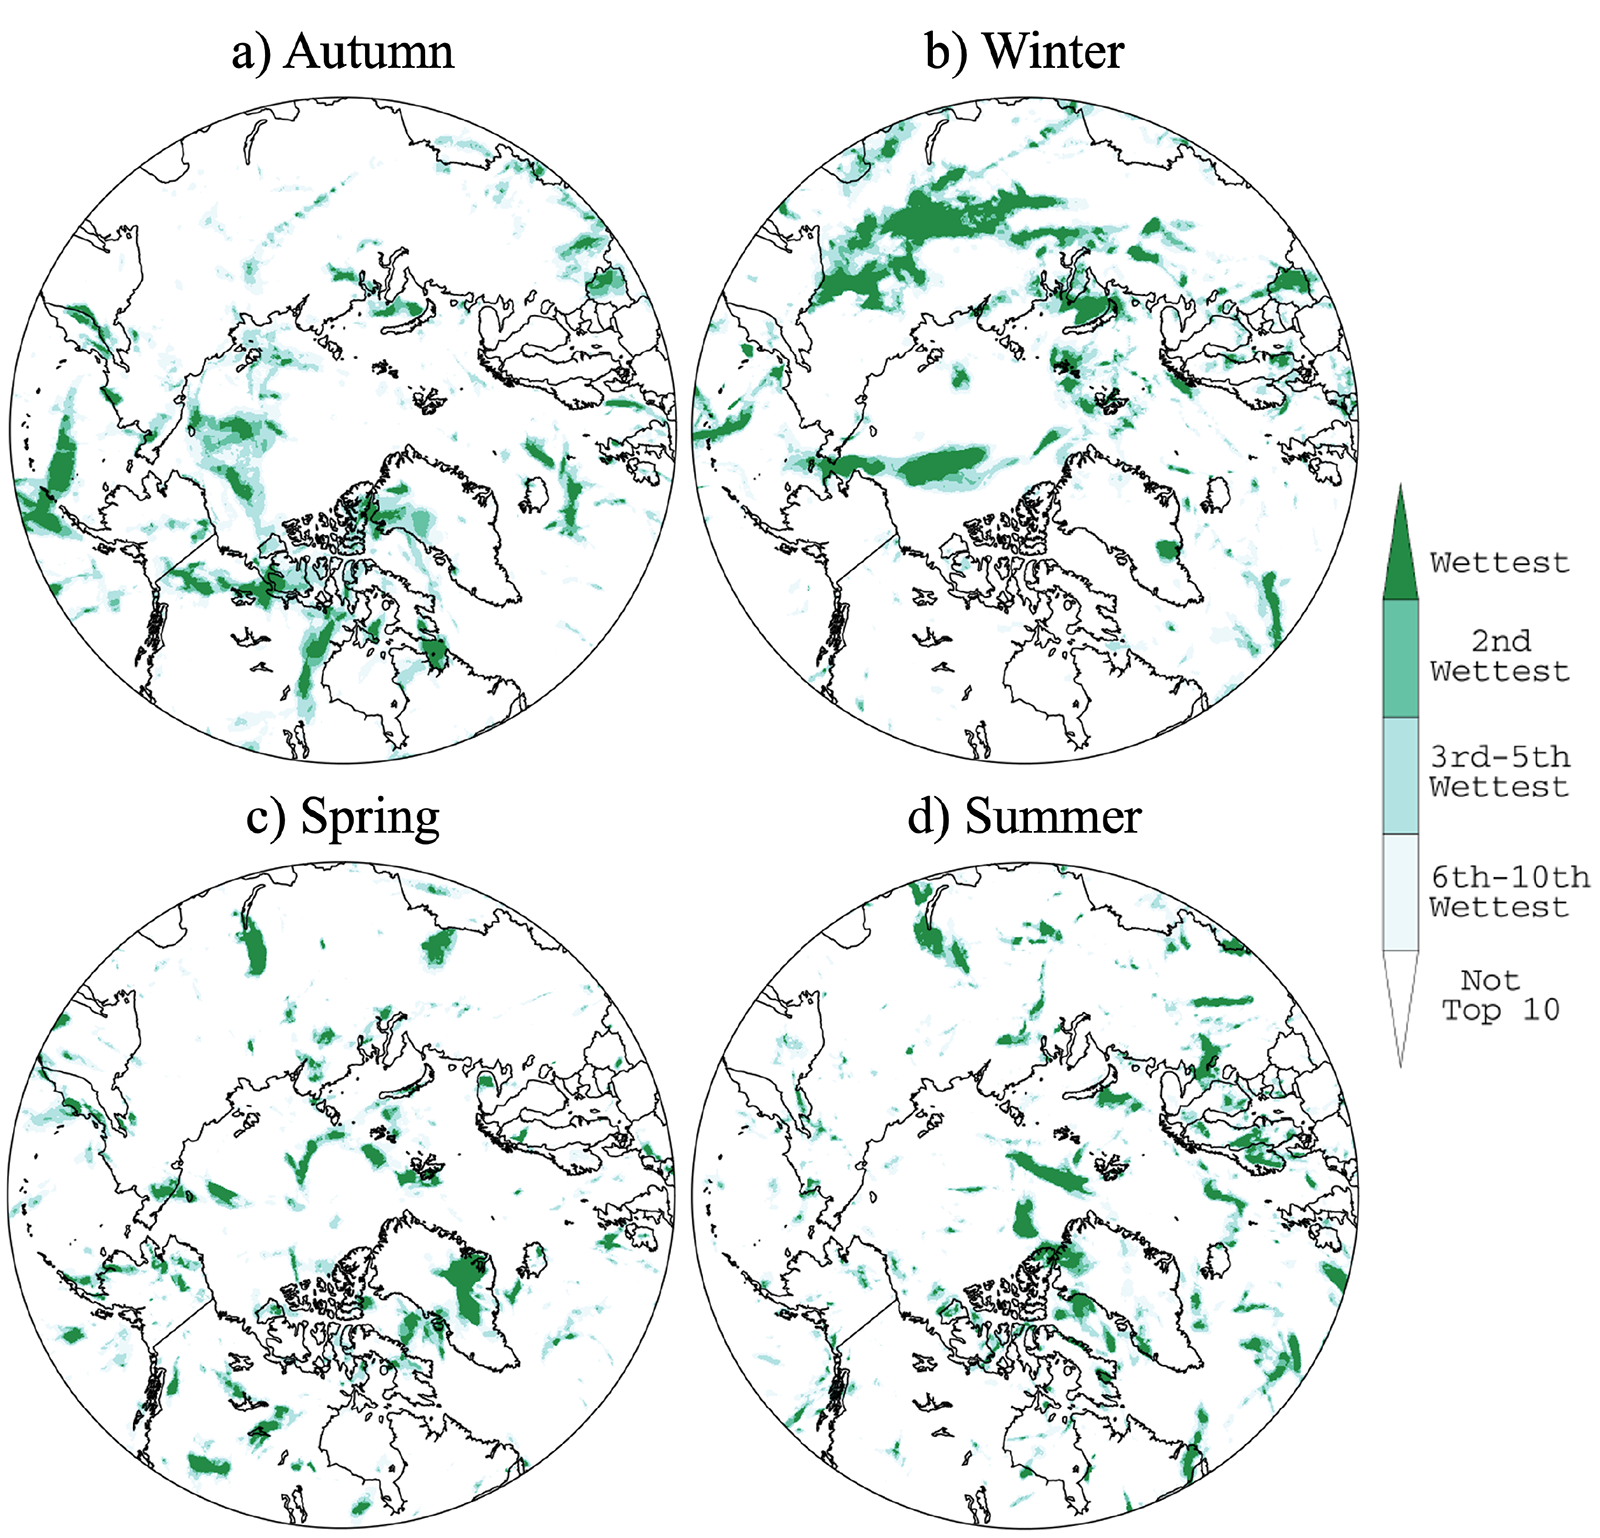
Figure 3 provides a pan-Arctic perspective on the heavy precipitation events of 2022/23 from ERA5 by showing the ranks (relative to the 1950-2022 historical period) of the maximum 5-day precipitation events (Rx5) in each season of the 2022/23 water year. During autumn (OND), record or near record (2nd or 3rd highest) events occurred in parts of the North American Arctic and the Beaufort and Chukchi Seas. That the known record December precipitation and snowfall in Anchorage does not reveal itself in the OND plot may reflect the local nature of the event. The winter (JFM) distribution shows a broad swath of heavy events across northern Europe and north-central Russia. However, this later feature does not show up in the winter seasonal anomaly plot (Fig. 2); this is also true of the heavy precipitation feature over the Arctic Ocean in winter. The spring (AMJ) pattern shows only small isolated areas of heavy precipitation, most notable over Greenland. While heavy precipitation for summer (JAS) as a whole was also spotty in coverage, the August pattern from ERA5 (not shown) features a prominent area over Northern Europe where heavy precipitation and damaging flooding were observed; this is readily seen in the summer anomaly map of total precipitation (Fig. 2).
Methods and data
Because of the challenges of gauge measurements in the Arctic, we make use of gridded precipitation fields from both the ERA5 atmospheric reanalysis of the European Centre for Medium Range Weather Forecasts (ECMWF) (Hersbach at al. 2020) and the Global Precipitation Climatology Centre’s GPCC V. 2022 (Becker et al. 2013). ERA5 data are available from January 1940 onwards, but the quality of the output is more reliable starting in 1979 (Hersbach et al. 2020), after which modern satellite data are assimilated into the analysis and forecast system. ERA5 is the latest atmospheric reanalysis effort, and performs slightly better than other atmospheric reanalyses at matching observed precipitation totals from extreme events in the Arctic (Loeb et al. 2022). Given the model-derived nature of ERA5, comparisons are made with the GPCC’s Full Data Product, a monthly gridded gauge-based product available from 1891 onwards (Schneider et al. 2022). Our comparisons of the time series of pan-Arctic precipitation computed from these two sources is limited to the post-1950 period because both products were impacted by missing data during the World War II period. We also use records from the NOAA NCEI analysis (NOAA 2023a, 2023b).
References
Becker, A., P. Finger, A. Meyer-Christoffer, B. Rudolf , K. Schamm, U. Schneider, and M. Ziese, 2013: A description of the global land-surface precipitation data products of the Global Precipitation Climatology Centre with sample applications including centennial (trend) analysis from 1901-present. Earth Sys. Sci. Data, 5(1), 71-99, https://doi.org/10.5194/essd-5-71-2013.
Bigalke, S., and J. E. Walsh, 2022: Future changes of snow in Alaska and the Arctic under stabilized global warming scenarios. Atmosphere, 13, 541, https://doi.org/10.3390/atmos13040541.
Box, J. E, and Coauthors, 2021: Recent developments in Arctic climate observation indicators. In AMAP Arctic Climate Change Update 2021: Key Trends and Impacts. Arctic Monitoring and Assessment Programme (AMAP), Tromso, Norway, 7-29 pp.
Hersbach, H, B., and Coauthors, 2020: The ERA5 global reanalysis. Quart. J. Roy. Meteor. Soc., 146, 1999-2049, https://doi.org/10.1002/qj.3803.
Loeb N.A., A. Crawford, J. C. Stroeve, and J. Hanesiak, 2022: Extreme precipitation in the eastern Canadian Arctic and Greenland: An evaluation of atmospheric reanalyses. Front. Env. Sci., 10, 866929, https://doi.org/10.3389/fenvs.2022.866929.
McCrystall, M. R., J. Stroeve, M. C. Serreze, B. C. Forbes, and J. A. Screen, 2021: New climate models reveal faster and larger increases in Arctic precipitation than previously projected. Nat. Commun., 12(1), 6765, https://doi.org/10.1038/s41467-021-27031-y.
NOAA National Centers for Environmental Information, 2023a: Climate at a Glance: Divisional Rankings, published September 2023, retrieved on 4 October 2023, https://www.ncei.noaa.gov/access/monitoring/climate-at-a-glance/divisional/rankings.
NOAA National Centers for Environmental Information, 2023b: North American Drought Monitor, retrieved 13 November 2023, https://www.ncei.noaa.gov/access/monitoring/nadm/maps.
Schneider, U., P. Finger, E. Rustemeier, M. Ziese, and S. Hänsel, 2022: Global precipitation analysis products of the GPCC, https://opendata.dwd.de/climate_environment/GPCC/PDF/GPCC_intro_products_v2022.pdf.
Walsh, J. E., S. Bigalke, S. A. McAfee, R. Lader, M. C. Serreze, and T. J. Ballinger, 2022: Precipitation. Arctic Report Card 2022, M. L. Druckenmiller, R. L. Thoman, and T. A. Moon, Eds., https://doi.org/10.25923/yxs5-6c72.
Ye, H., D. Yang, A. Behrangi, S. L. Stuefer, X. Pan, E. Mekis, Y. Dibike, and J. E. Walsh, 2021: Precipitation Characteristics and Changes. Chapter 2 in Arctic Hydrology, Permafrost and Ecosystems (D. Yang and D. L. Kane, Eds.), Springer Nature Switzerland, 25-59, https://doi.org/10.1007/978-3-030-50930-9.
Yu, L., and S. Zhong, 2021: Trends in Arctic seasonal and extreme precipitation in recent decades. Theor. Appl. Climatol., 145, 1541-1559, https://doi.org/10.1007/s00704-021-03717-7.
November 17, 2023