
K. E. Frey1, J. C. Comiso2, L. W. Cooper3, C. Garcia4, J. M. Grebmeier3, and L. V. Stock2
1Graduate School of Geography, Clark University, Worcester, MA, USA
2Cryospheric Sciences Laboratory, Goddard Space Flight Center, NASA, Greenbelt, MD, USA
3Chesapeake Biological Laboratory, University of Maryland Center for Environmental Science, University of Maryland, Solomons, MD, USA
4Arctic Research Program, Global Ocean Monitoring and Observing Program, NOAA, Silver Spring, MD, USA
Headlines
- Satellite estimates of ocean primary productivity (i.e., the rate at which marine algae transform dissolved inorganic carbon into organic material) show higher values for 2023 (relative to the 2003-22 mean) for five of nine regions assessed across the Arctic.
- All regions, except for the Amerasian Arctic (namely the Chukchi Sea, Beaufort Sea, and Canadian Archipelago), continue to exhibit positive trends in ocean primary productivity during 2003-23, with the largest percent change in the Eurasian Arctic (57.4% increase) and Barents Sea (20.7% increase).
- While positive decadal trends in annual ocean primary productivity continue to be dominant across the Arctic, large areas of lower-than-average values were observed during 2023 in the East Siberian Sea, Chukchi Sea, Greenland Sea, and Baffin Bay/Labrador Sea.
Introduction
A rapidly warming Arctic Ocean and peripheral seas (Rantanen et al. 2022) are undergoing shifts in marine primary productivity, largely driven by dynamic changes in sea ice extent, nutrient dynamics, and light regimes (Ardyna and Arrigo 2020; Terhaar et al. 2021; Frey et al. 2023). Understanding changes in Arctic marine primary productivity, the conversion of dissolved inorganic carbon into organic material, is vital as it forms the base of the marine ecosystem and plays a key role in carbon sequestration (Manizza 2023). In recent years, factors that include expanding sea-ice-free areas, thinning sea ice, and enhanced wind mixing from storms have regionally boosted ocean primary production (Fujiwara et al. 2018; Møller et al. 2023). In contrast, changes such as a progressively cloudier Arctic atmosphere (Bélanger et al. 2013) and declining fluxes of nitrate from Arctic rivers (Tank et al. 2023) may contribute to reductions in primary production. Harmful algal blooms in warming Arctic waters have also become an emerging threat to human and ecosystem health (e.g., Anderson et al. 2022). The diverse marine sectors of the Arctic (from the nutrient-rich Barents Sea and shallow, productive northern Bering/Chukchi Seas to the low-productivity central deep Arctic basin) vary widely in primary productivity patterns, as they are influenced by their unique hydrographic, atmospheric, and sea ice conditions. These regional variations are critical to understand, with each sector contributing differently to Arctic biodiversity, biogeochemical cycling, and global climate feedback mechanisms. Using satellite-derived Gross Primary Production data spanning more than two decades, nuanced changes in primary productivity across the pan-Arctic and within distinct Arctic sectors can be explored. Continued monitoring of Arctic marine primary productivity is vital, given its profound impacts on marine ecosystems across all trophic levels.
Chlorophyll-a
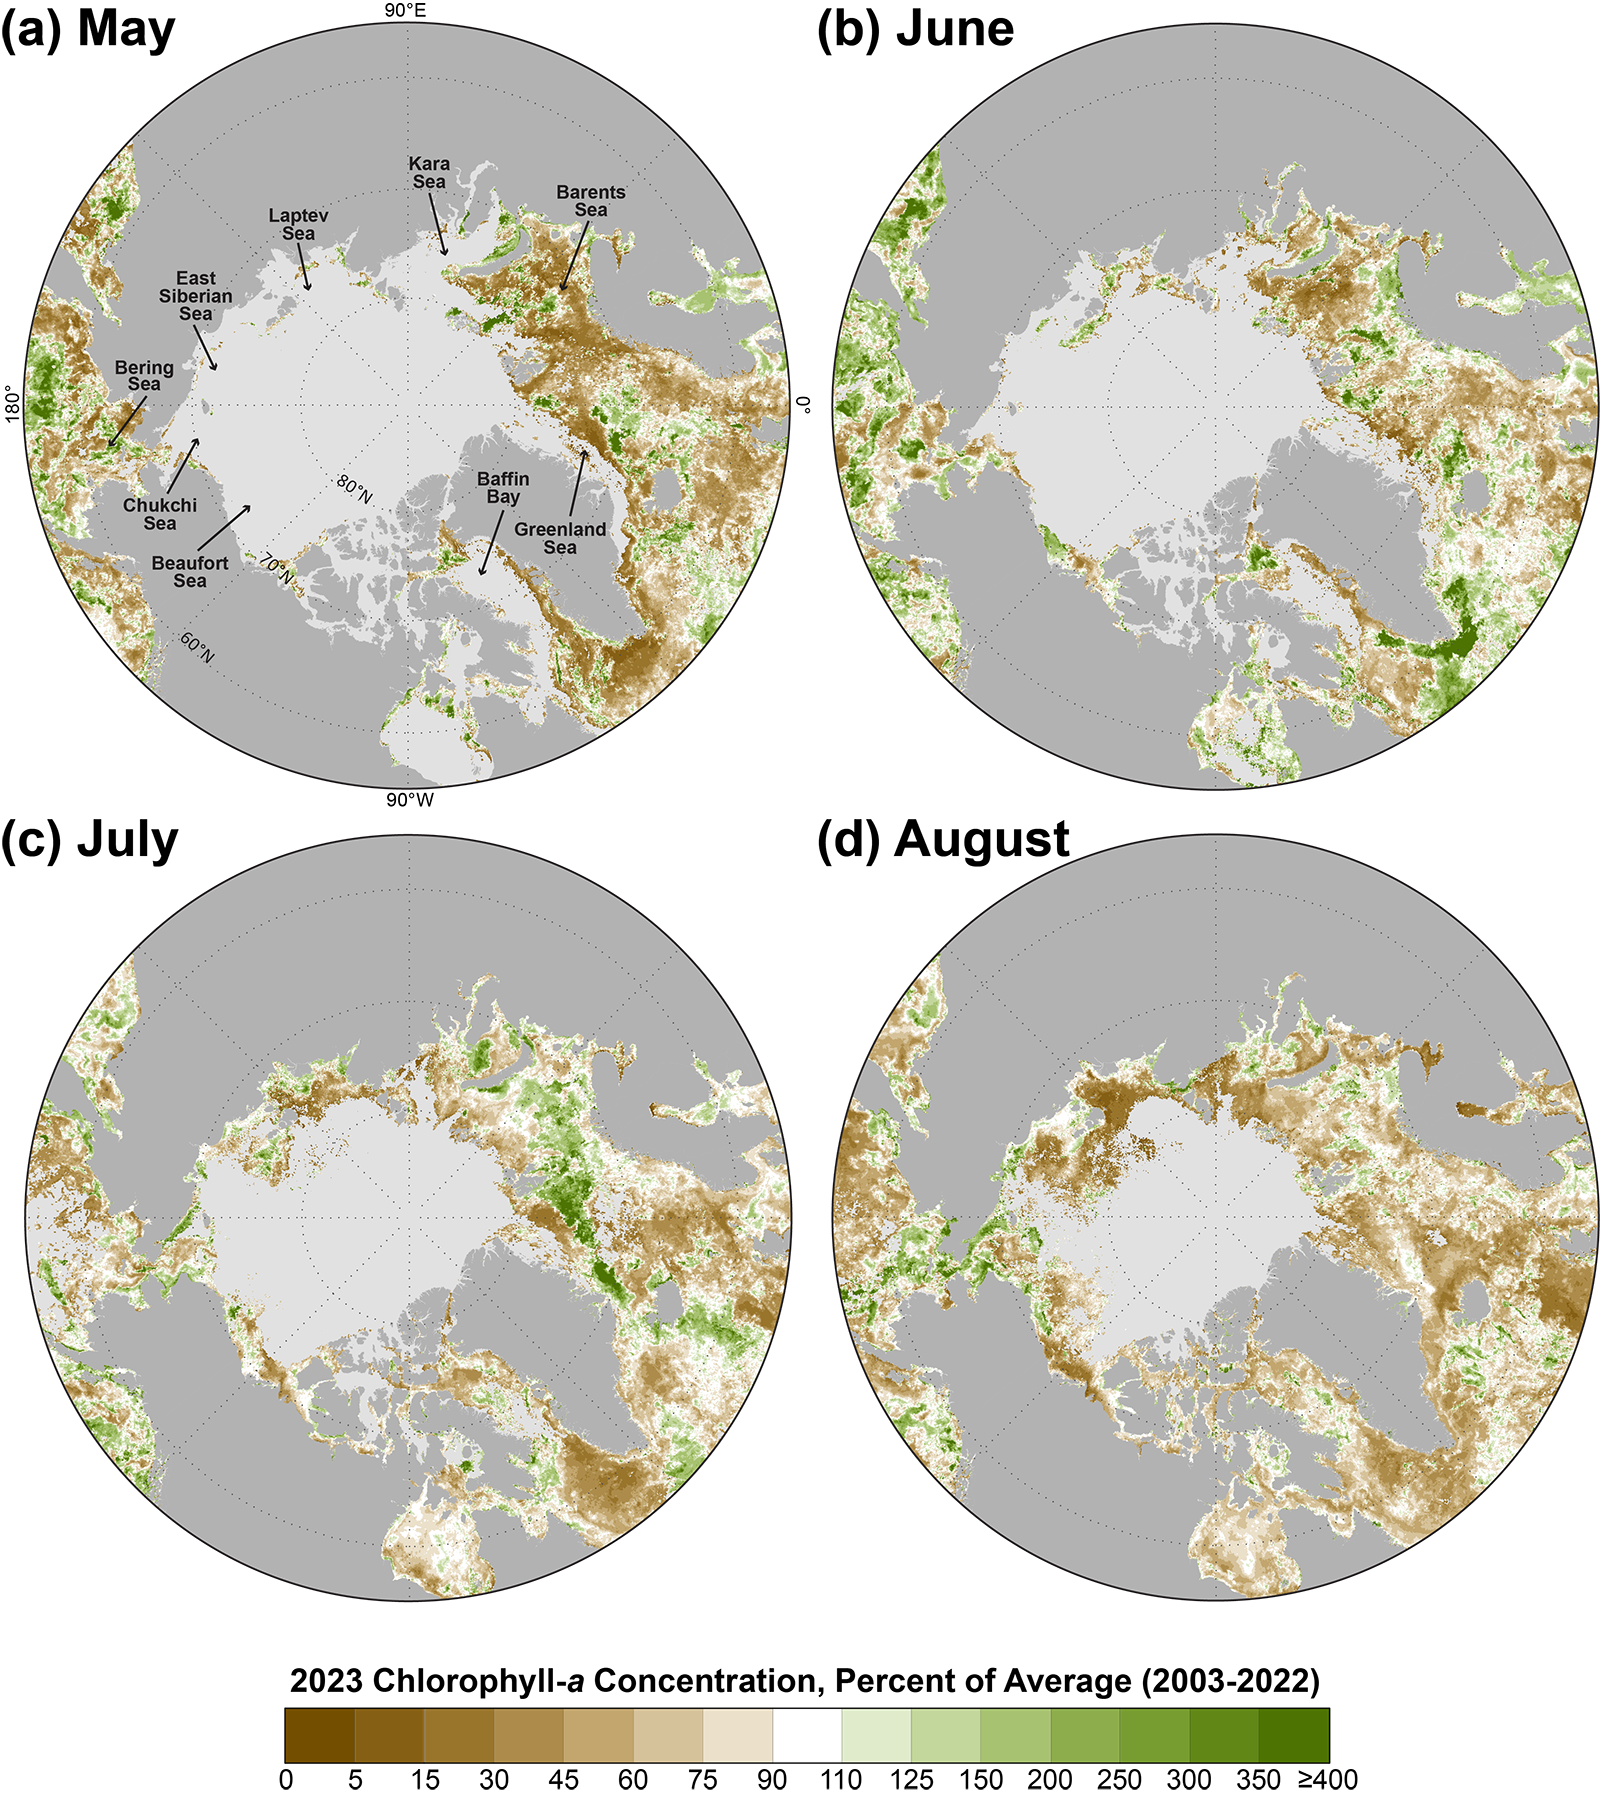
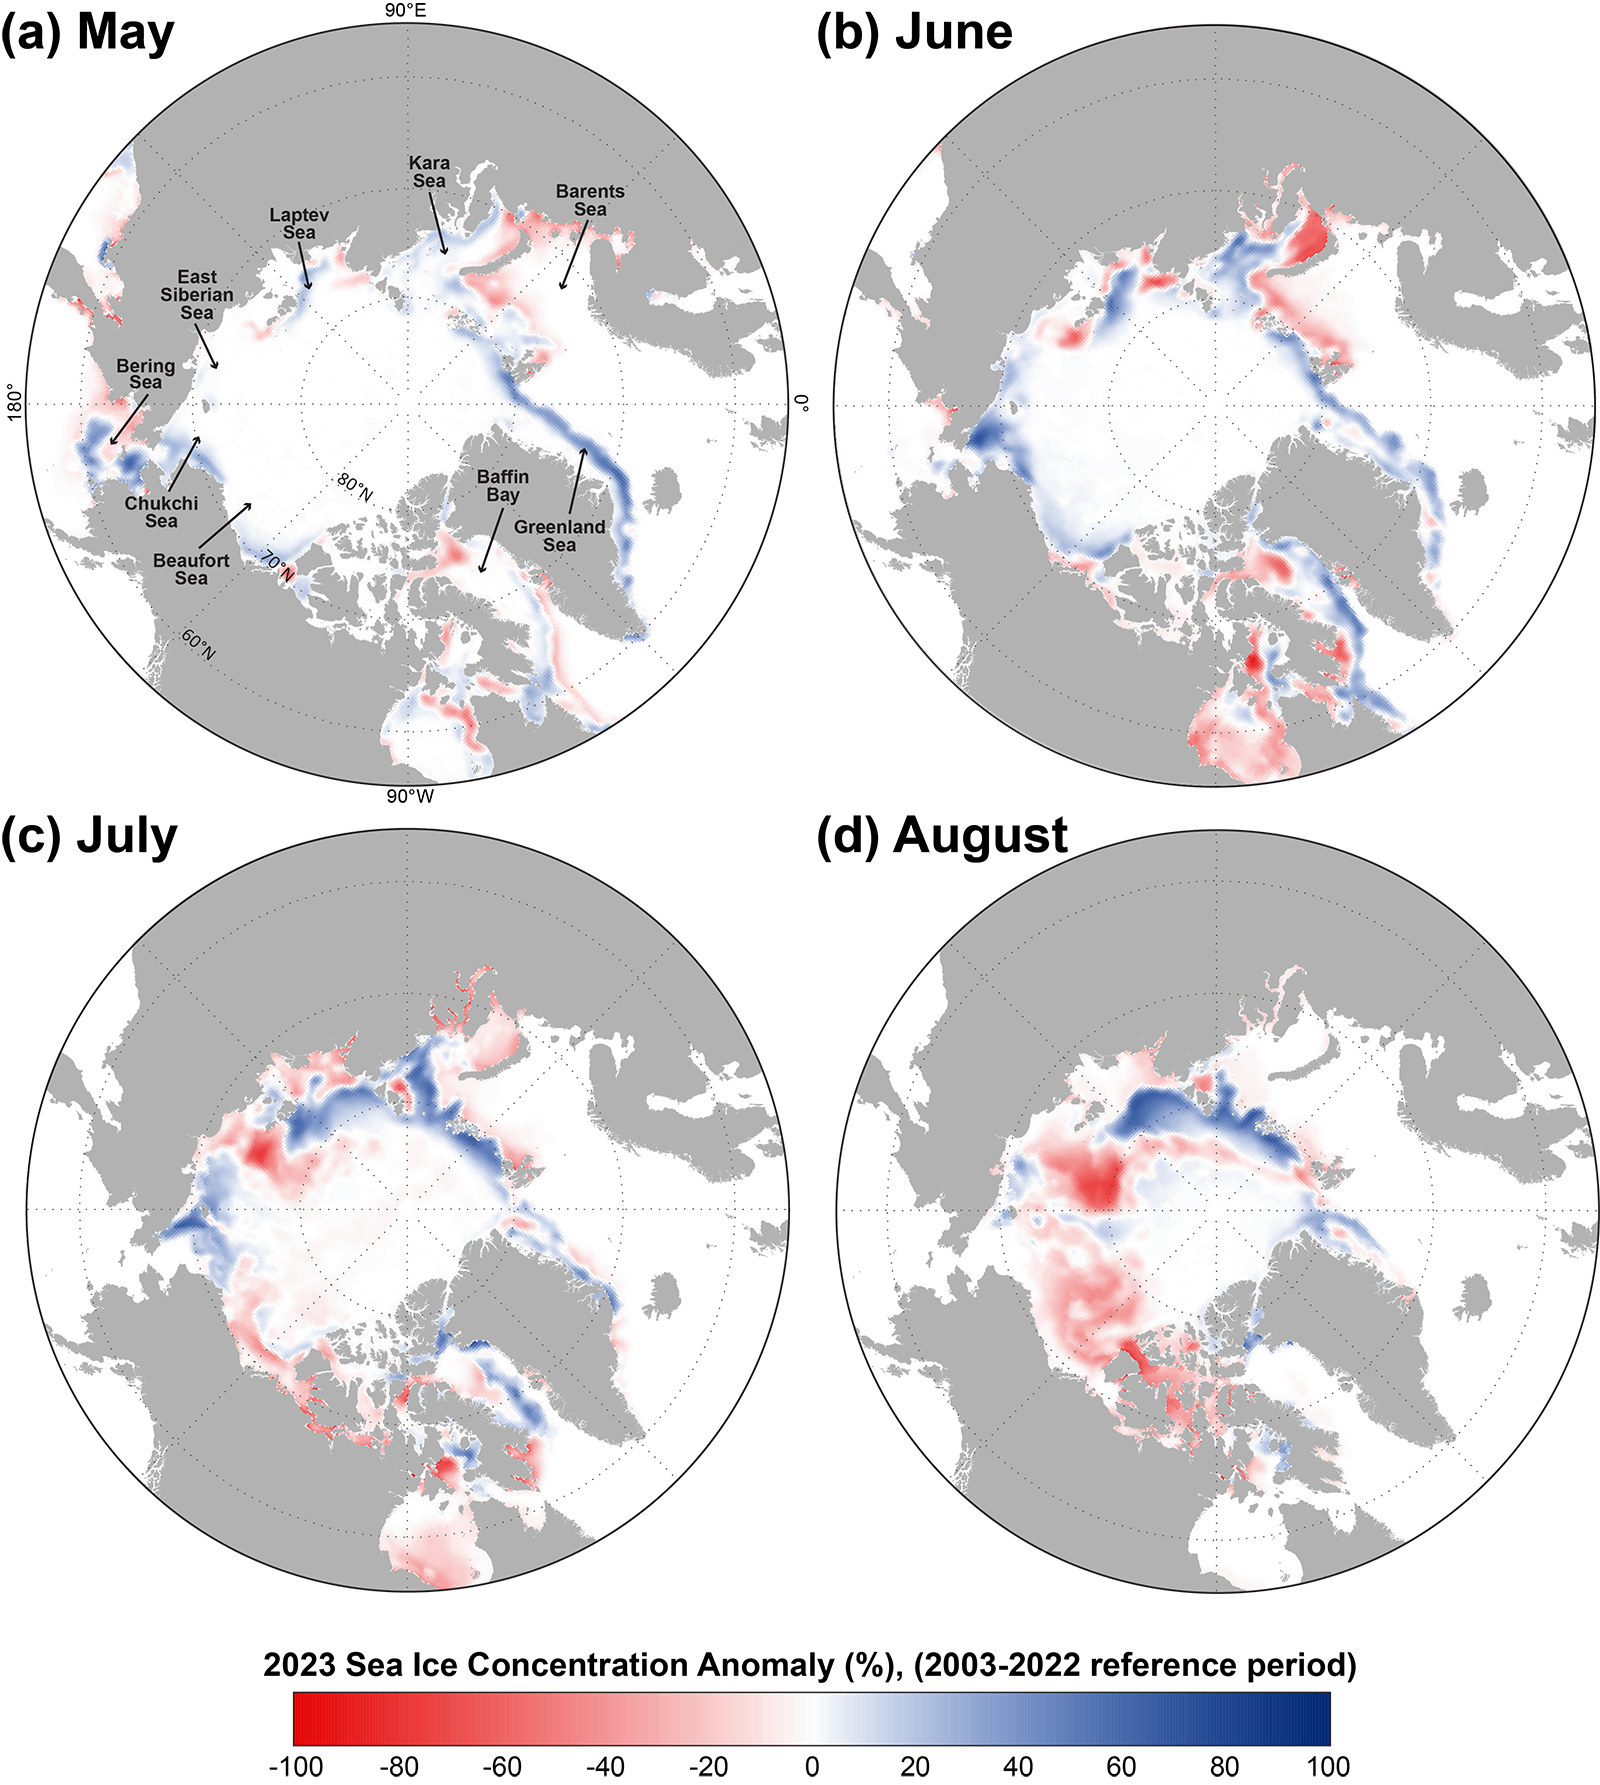
We present satellite-based estimates of algal chlorophyll-a (occurring in all species of phytoplankton) based on ocean color, and subsequently provide calculated primary production estimates (below). Observed patterns in chlorophyll-a concentrations (Fig. 1), which are spatially and temporally heterogeneous across the Arctic Ocean, are often associated with the timing of the seasonal break-up and retreat of the sea ice cover (Fig. 2) (see essay Sea Ice): high chlorophyll-a percentages tend to occur in regions where break-up is relatively early, while low percentages tend to occur in regions where break-up is delayed. During May 2023 (Fig. 1a), patterns in chlorophyll-a concentrations were heterogeneous with broad areas of lower-than-average values across most regions, interspersed with higher-than-average values in the Bering Sea and Barents Sea. During June 2023 (Fig. 1b), the heterogeneity continued with higher-than-average values interspersed within the Bering Sea, the Barents Sea, around the southern tip of Greenland, and near the North Water Polynya in northwest Greenland. During July 2023 (Fig. 1c), most areas showed lower-than-average values with the exception being a substantial swath (~2400 km long) of higher-than-average values in the Barents Sea, moving westward south of Svalbard and into the Greenland Sea. During August 2023 (Fig. 1d), most regions across the Arctic also exhibited lower-than-average values, except for notable higher-than-average values in the northern Bering Sea and southern Chukchi Sea.
Primary production
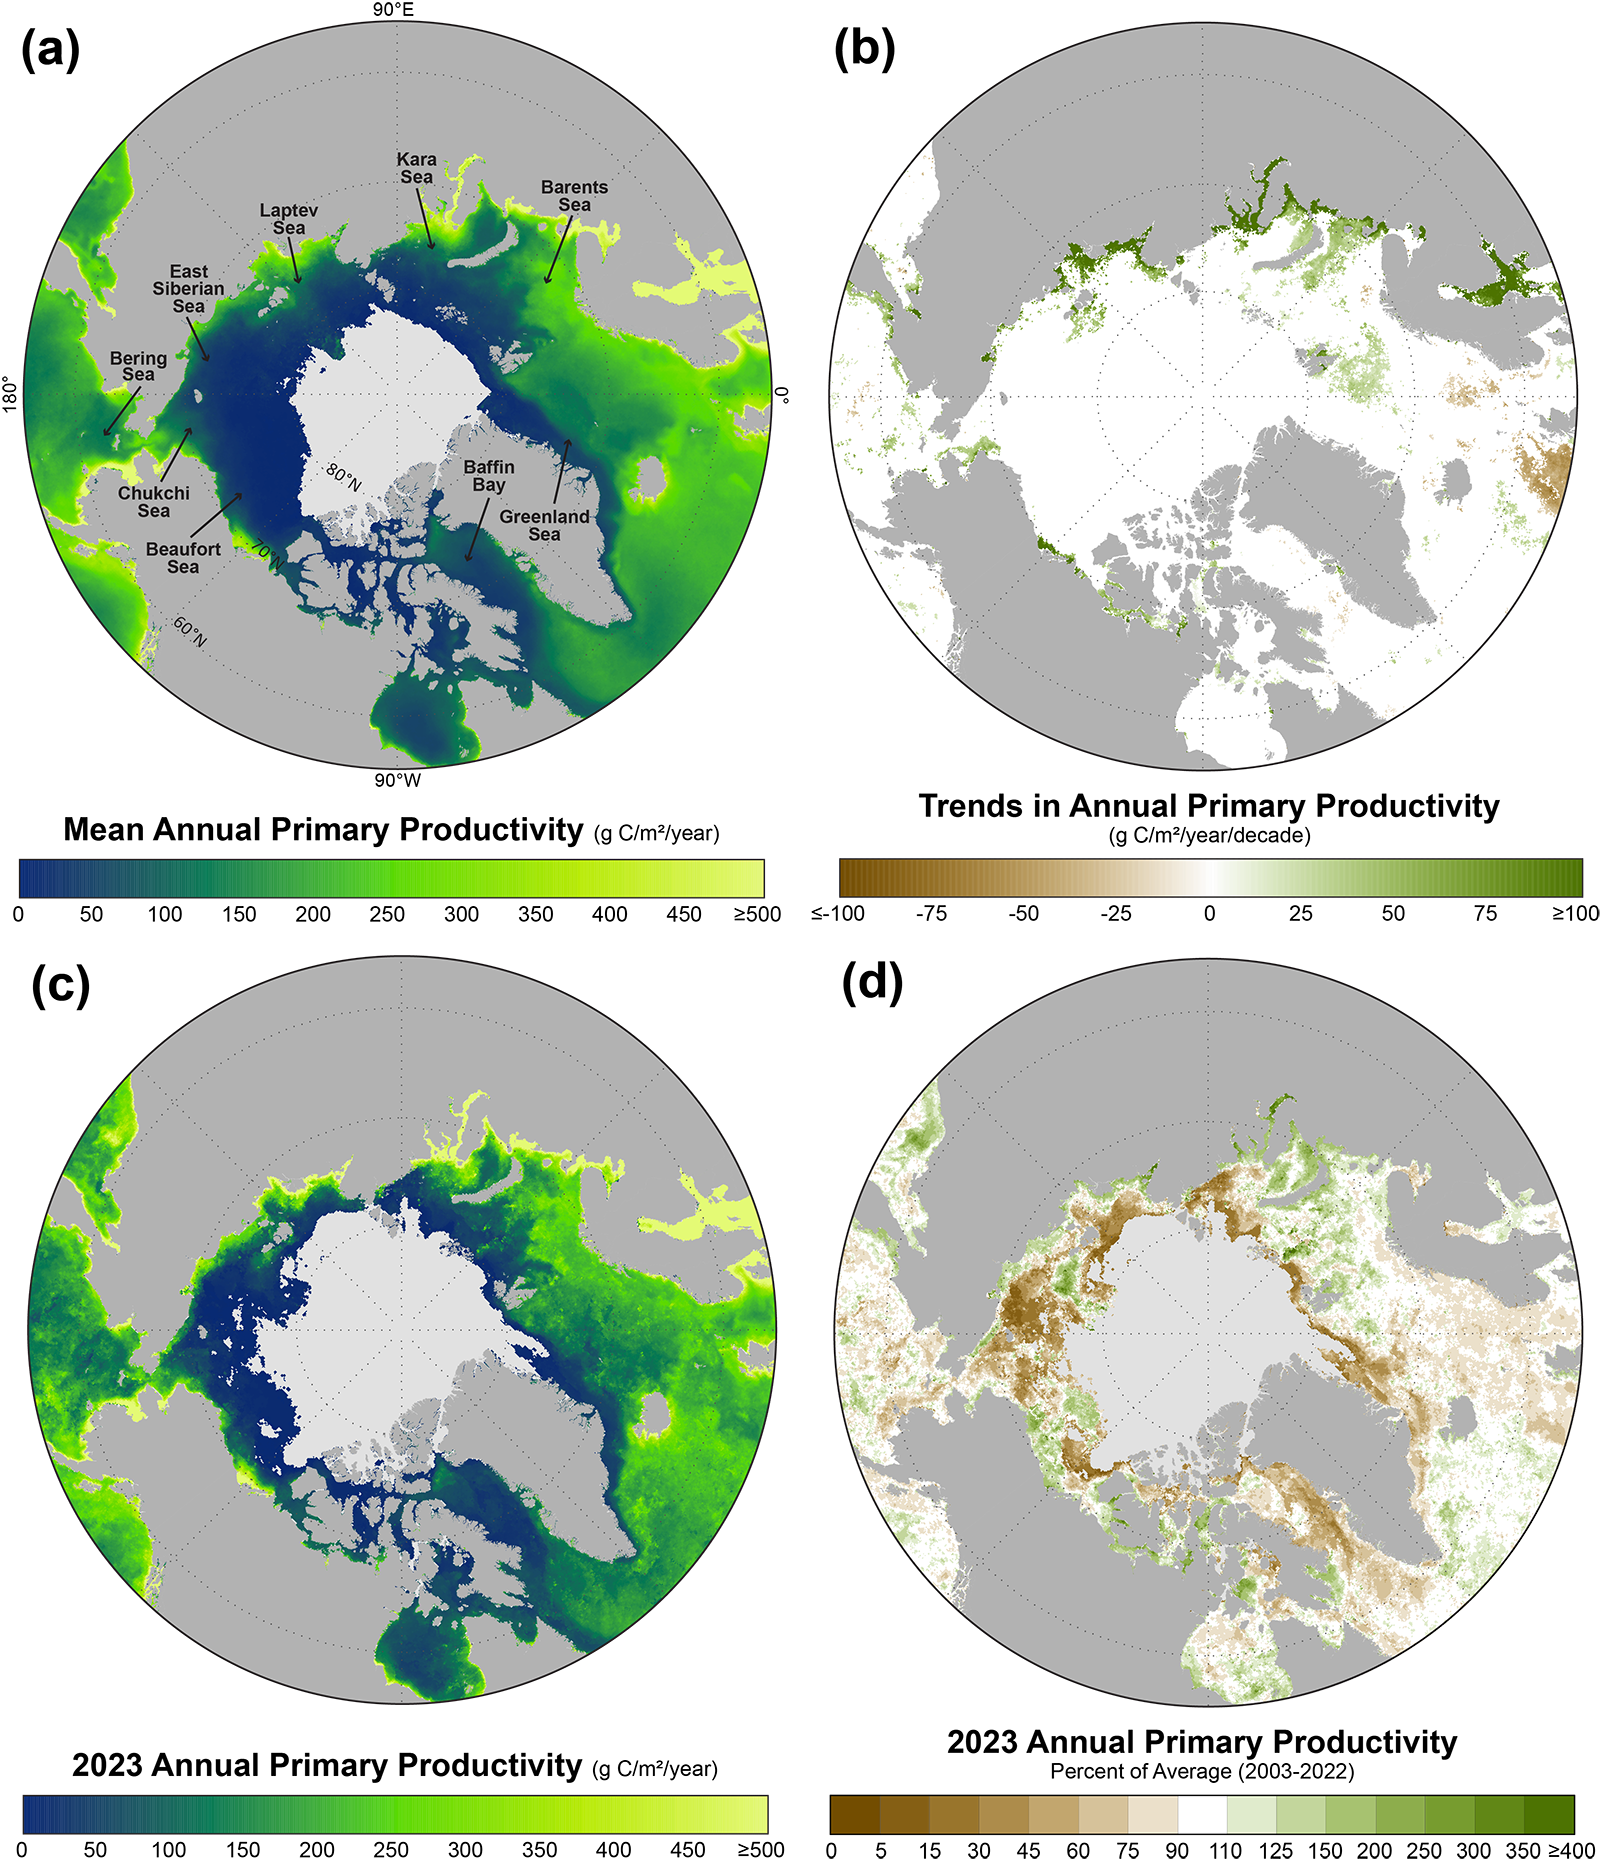
While chlorophyll-a concentrations give an estimate of the total standing stock of algal biomass, rates of primary production (i.e., the production of organic carbon via photosynthesis) provide a different perspective since not all algae in the water column are necessarily actively producing. The mean annual (March through September) primary productivity across the Arctic shows important spatial patterns, most notably the overall decreases moving northward as sea ice cover is present for a greater fraction of the year (Fig. 3a). Spatial trends in annual primary productivity (Fig. 3b) are a particularly useful tool for understanding hotspots of change. Statistically significant positive trends in primary productivity appear clustered in the southeastern Chukchi Sea, Barents Sea, and the Laptev Sea north of the New Siberian Islands (Fig. 3b). Positive trends adjacent to the Eurasian coastline may be associated with variability in river-derived chromophoric (light absorbing) dissolved organic matter (CDOM) as well (e.g., Lewis and Arrigo 2020). Using this primary productivity product, there is almost no evidence of significant negative trends in primary productivity across the Arctic (except for isolated locations in the southern Norwegian Sea; Fig. 3b). Investigations of 2023 annual primary productivity (Fig. 3c), as well as 2023 compared to the 2003-22 average (Fig. 3d), show greater-than-average annual productivity in the southern Beaufort Sea, northern Laptev Sea (east of the New Siberian Islands), western Kara Sea, and Barents Sea, but lower-than-average annual productivity in the Chukchi Sea, East Siberian Sea, Greenland Sea, and Baffin Bay.
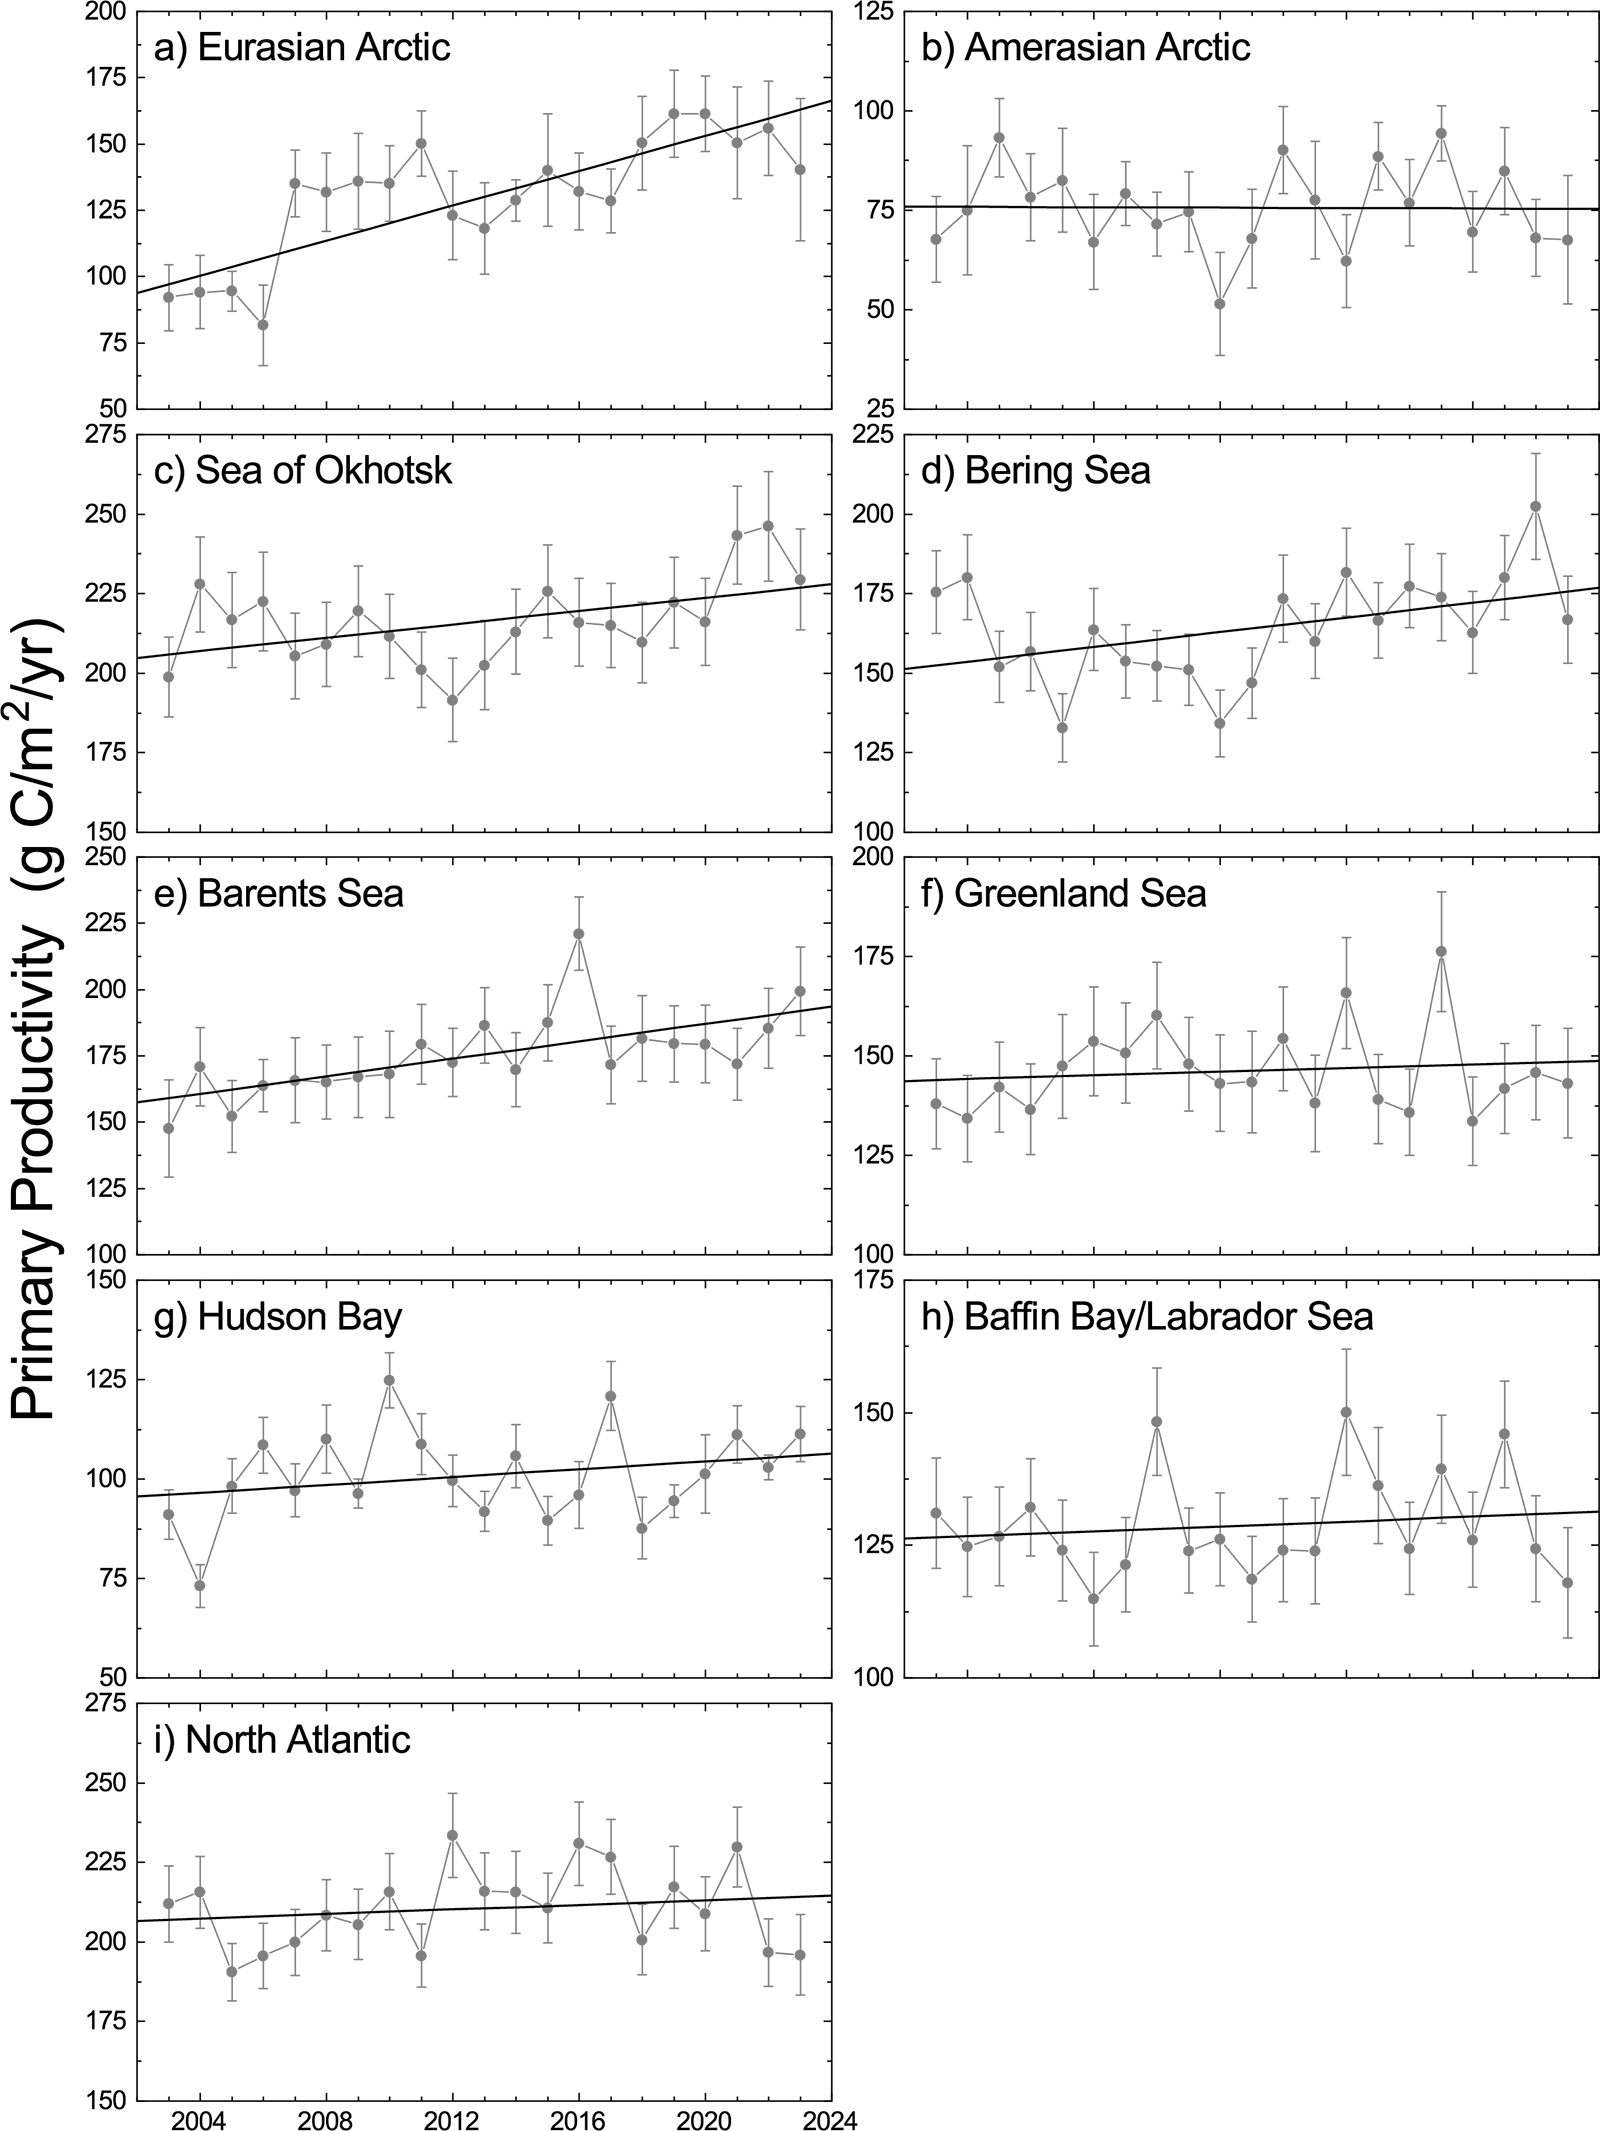
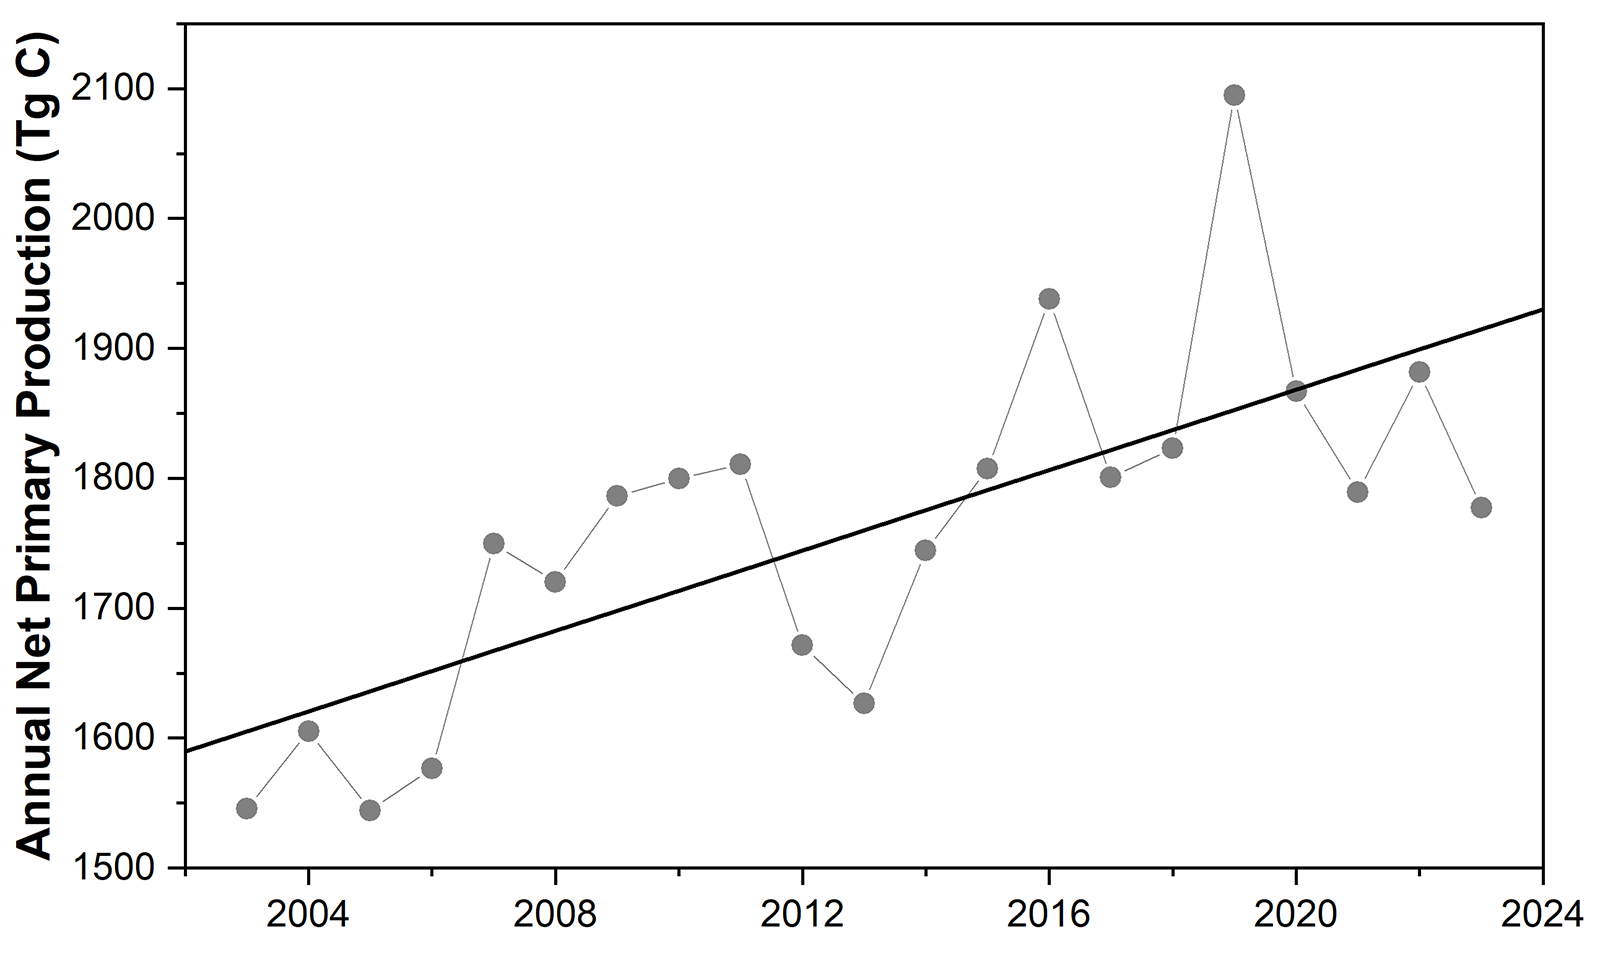
Overall estimates of ocean primary productivity in 2023 for nine regions and across the Northern Hemisphere (relative to the 2003-22 reference period) were assessed (Fig. 4, Table 1). The Eurasian Arctic region includes the Kara, Laptev, and East Siberian Seas. The Amerasian Arctic region includes the Chukchi Sea, Beaufort Sea, and Canadian Archipelago. The North Atlantic is categorized as south of 60° N and east of 45° W, which excludes the Labrador and Greenland Seas. Our results show above-average primary productivity for 2023 in five of the nine regions assessed, while the Amerasian Arctic, Greenland Sea, Baffin Bay/Labrador Sea, and North Atlantic exhibit lower-than-average values (Fig. 4, Table 1). While lower-than-average primary productivity percentages are geographically widespread within the Eurasian Arctic region for 2023 (Fig. 3d), those areas within the region that show higher-than-average percentages are disproportionately large enough to result in an overall higher-than-average 2023 regional primary productivity (Table 1). Across the whole time series, positive trends in primary productivity are continuing in all regions during the 2003-23 period, except for the Amerasian Arctic. The largest statistically significant positive trends occurred in the Eurasian Arctic and Barents Sea with 29.11 g C/m2/yr/decade and 16.48 g C/m2/yr/decade, respectively. Trends in primary production over 2003-23 show a ~57.4% increase in the Eurasian Arctic and a ~20.7% increase in the Barents Sea. Annual net primary production was also calculated for the Arctic region, defined as 60-90° N (Fig. 5), and shows a trend over 2003-23 of 15.5 Tg C/yr (Mann-Kendall significance p<0.001). The percent change estimated from the linear regression over the 21-year time series is 19.3%. In summary, while 2003-23 observations of primary productivity show complex interannual and spatial patterns, we continue to observe overall positive trends across most Arctic regions.
| Region | 2003-23 Trend (g C/m2/yr/decade) |
2003-23 Mann-Kendall p-value |
2003-23 % Change |
2023 Anomaly (g C/m2/yr) from the 2003-22 reference period |
2023 Primary Productivity (% of the 2003-22 average) |
|---|---|---|---|---|---|
| Eurasian Arctic | 29.11 | 0.001 | 57.4 | 10.15 | 107.8 |
| Amerasian Arctic | -0.23 | 0.833 | -0.6 | -8.48 | 88.8 |
| Sea of Okhotsk | 10.49 | 0.057 | 10.2 | 13.66 | 106.3 |
| Bering Sea | 11.59 | 0.075 | 15.2 | 2.94 | 101.8 |
| Barents Sea | 16.48 | 0.000 | 20.7 | 24.90 | 114.3 |
| Greenland Sea | 2.31 | 0.695 | 3.2 | -3.25 | 97.8 |
| Hudson Bay | 4.89 | 0.319 | 10.2 | 10.94 | 110.9 |
| Baffin Bay/Labrador Sea | 2.33 | 0.928 | 3.7 | -11.38 | 91.2 |
| North Atlantic | 3.69 | 0.349 | 3.6 | -15.40 | 92.7 |
Methods and data
Measurements of the algal pigment chlorophyll (specifically, chlorophyll-a) serve as a proxy for algal biomass present in the ocean as well as overall plant health. The complete, updated Moderate Resolution Imaging Spectroradiometer (MODIS)-Aqua satellite record of chlorophyll-a concentrations within northern polar waters for the years 2003-23 serves as a time-series against which individual years can be compared. Satellite-based chlorophyll-a data across the pan-Arctic region were derived using the MODIS-Aqua Reprocessing 2022.0, chlor_a algorithm: https://oceancolor.gsfc.nasa.gov/. For this report, we show mean monthly chlorophyll-a concentrations calculated as a percentage of the 2003-22 average, which was chosen as the reference period to maximize the length of the satellite-based time series. Satellite-based sea ice concentrations were derived from the Special Sensor Microwave/Imager (SSM/I) and Special Sensor Microwave Imager/Sounder (SSMIS) passive microwave instruments, calculated using the Goddard Bootstrap (SB2) algorithm (Comiso et al. 2017). Monthly sea ice concentration anomalies were additionally calculated for 2023 (compared to the 2003-22 average) to streamline comparisons with the variability in monthly chlorophyll-a satellite data. Primary productivity data were derived using chlorophyll-a concentrations from MODIS-Aqua data (Reprocessing 2022.0, chlor_a algorithm), the NOAA 1/4° daily Optimum Interpolation Sea Surface Temperature dataset (or daily OISST) that uses satellite sea surface temperatures from AVHRR, incident solar irradiance, mixed layer depths, and additional parameters. Primary productivity values were calculated based on the Vertically Generalized Production Model (VGPM) algorithm described by Behrenfeld and Falkowski (1997) with further information provided by Frey et al. (2023). Chlorophyll-a and primary productivity data only incorporate pixels where sea ice is less than 10%, which is a compromise between potential pixel contamination with sea ice and an attempt to incorporate open water near the ice edge that typically exhibits high rates of primary production. The 2023 annual (March-September) primary productivity percent of average (compared to 2003-22) was calculated the same way as for chlorophyll-a, as described above. Lastly, Theil-Sen median trends were calculated spatially (Fig. 3b) and for the extracted time series for each geographic region (Table 1), where statistical significance of the trends (p<0.05) was determined using the Mann-Kendall trend test.
Because chlorophyll-a and primary productivity data are shown for ocean areas with less than 10% sea ice concentration, they do not include production by sea ice algae or under-ice phytoplankton blooms, which can be significant (e.g., Ardyna et al. 2020). Furthermore, it is well known that satellite observations can underestimate production under stratified ocean conditions when a deep chlorophyll maximum is present (Juranek et al. 2023). The variable distribution of sediments and CDOM (owing to riverine delivery, coastal erosion, and sea ice dynamics) can also affect the accuracy of satellite-based estimations of chlorophyll-a and primary productivity in Arctic waters (Lewis and Arrigo 2020). As such, in-situ observations continue to be important to provide overall context for changes to and drivers of primary productivity across Arctic marine ecosystems.
Acknowledgments
K. Frey acknowledges financial support from the National Science Foundation (NSF) Arctic Observing Network (AON) Program (Grant 1917434). Support for J. Grebmeier and L. Cooper was provided through NSF AON (Grant 1917469) and the NOAA Global Ocean Monitoring and Observing, Arctic Research Program (CINAR 22309.07_UMCES_Grebmeier).
References
Anderson, D. M., and Coauthors, 2022: Harmful algal blooms in the Alaskan Arctic: An emerging threat as the ocean warms. Oceanography, 35(3/4), 130-139, https://doi.org/10.5670/oceanog.2022.121.
Ardyna, M., and K. R. Arrigo, 2020: Phytoplankton dynamics in a changing Arctic Ocean. Nat. Climate Change, 10, 892-903 (2020), https://doi.org/10.1038/s41558-020-0905-y.
Ardyna, M., and Coauthors, 2020: Under-ice phytoplankton blooms: Shedding light on the “invisible” part of Arctic primary production. Front. Mar. Sci., 7, 608032, https://doi.org/10.3389/fmars.2020.608032.
Behrenfeld, M. J., and P. G. Falkowski, 1997: Photosynthetic rates derived from satellite-based chlorophyll concentration. Limnol. Oceanogr., 42(1), 1-20, https://doi.org/10.4319/lo.1997.42.1.0001.
Bélanger, S., M. Babin, and J. -É. Tremblay, 2013: Increasing cloudiness in Arctic damps the increase in phytoplankton primary production due to sea ice receding. Biogeosciences, 10, 4087-4101, https://doi.org/10.5194/bg-10-4087-2013.
Comiso, J. C., 2015: Variability and trends of the global sea ice covers and sea level: Effects on physicochemical parameters. Climate Change and Marine and Freshwater Toxins, L. M. Botana, M. C. Lauzao, and N. Vilarino, Eds., De Gruyter, Berlin, Germany, https://doi.org/10.1515/9783110333596-003.
Comiso, J. C., W. N. Meier, and R. Gersten, 2017: Variability and trends in the Arctic Sea ice cover: Results from different techniques. J. Geophys. Res.-Oceans, 122, 6883-6900, https://doi.org/10.1002/2017JC012768.
Frey, K. E., J. C. Comiso, L. V. Stock, L. N. C. Young, L. W. Cooper, and J. M. Grebmeier, 2023: A comprehensive satellite-based assessment across the Pacific Arctic Distributed Biological Observatory shows widespread late-season sea surface warming and sea ice declines with significant influences on primary productivity. PLoS ONE, 18(7), e0287960, https://doi.org/10.1371/journal.pone.0287960.
Fujiwara, A., and Coauthors, 2018: Changes in phytoplankton community structure during wind-induced fall bloom on the central Chukchi shelf. Polar Biol., 41, 1279-1295, https://doi.org/10.1007/s00300-018-2284-7.
Juranek, L. W., B. Hales, N. L. Beaird, M. A. Goñi, E. Shroyer, J. G. Allen, and A. E. White, 2023: The importance of subsurface productivity in the Pacific Arctic gateway as revealed by high-resolution biogeochemical surveys. J. Geophys. Res.-Oceans, 128, e2022JC019292, https://doi.org/10.1029/2022JC019292.
Lewis, K. M., and K. R. Arrigo, 2020: Ocean color algorithms for estimating chlorophyll a, CDOM absorption, and particle backscattering in the Arctic Ocean. J. Geophys. Res.-Oceans, 125, e2019JC015706, https://doi.org/10.1029/2019JC015706.
Manizza, M., 2023: Carbon streams into the deep Arctic Ocean. Nat. Geosci., 16, 6-7, https://doi.org/10.1038/s41561-022-01102-1.
Møller, E. F., A. Christensen, J. Larsen, K. D. Mankoff, M. H. Ribergaard, M. Sejr, P. Wallhead, and M. Maar, 2023: The sensitivity of primary productivity in Disko Bay, a coastal Arctic ecosystem, to changes in freshwater discharge and sea ice cover. Ocean Sci., 19, 403-420, https://doi.org/10.5194/os-19-403-2023.
Rantanen, M., A. Y. Karpechko, A. Lipponen, K. Nordling, O. Hyvärinen, K. Ruosteenoja, T. Vihma, and A. Laaksonen, 2022: The Arctic has warmed nearly four times faster than the globe since 1979. Commun. Earth Environ., 3, 168, https://doi.org/10.1038/s43247-022-00498-3.
Tank, S. E., and Coauthors, 2023: Recent trends in the chemistry of major northern rivers signal widespread Arctic change. Nat. Geosci., 16, 789-796, https://doi.org/10.1038/s41561-023-01247-7.
Terhaar, J., R. Lauerwald, P. Regnier, N. Gruber, and L. Bopp, 2021: Around one third of current Arctic Ocean primary production sustained by rivers and coastal erosion. Nat. Commun., 12, 169, https://doi.org/10.1038/s41467-020-20470-z.
January 23, 2024