
P. P. Overduin1, A. Portnov2,3, and C. D. Ruppel4
1Permafrost Research Section, Alfred Wegener Institute, Helmholtz Centre for Polar and Marine Research, Potsdam, Germany
2Instituto Andaluz de Ciencias de la Tierra, CSIC-Universidad de Granada, Granada, Spain
3University of Texas Institute for Geophysics, Austin, TX, USA
4U.S. Geological Survey, Woods Hole, MA, USA
Headlines
- Since the end of the Last Glacial Maximum (~21,000 years ago), rising sea levels have inundated terrestrial permafrost surrounding the Arctic Ocean, resulting in subsea permafrost.
- An estimated 2.5 million km2 of subsea permafrost remains today, but it continues to thaw due to the original ocean inundation event and more recent, rapid Arctic warming.
- Observations from the Beaufort and Kara Seas reveal that the remaining subsea permafrost is mostly distributed in coastal waters less than 30 m deep. Subsea permafrost distribution on the vast Siberian margin is comparatively poorly understood.
- International research collaboration is needed to address critical questions regarding the extent and current state of subsea permafrost and to estimate the potential release of greenhouse gases (carbon dioxide and methane) as it thaws.
Introduction
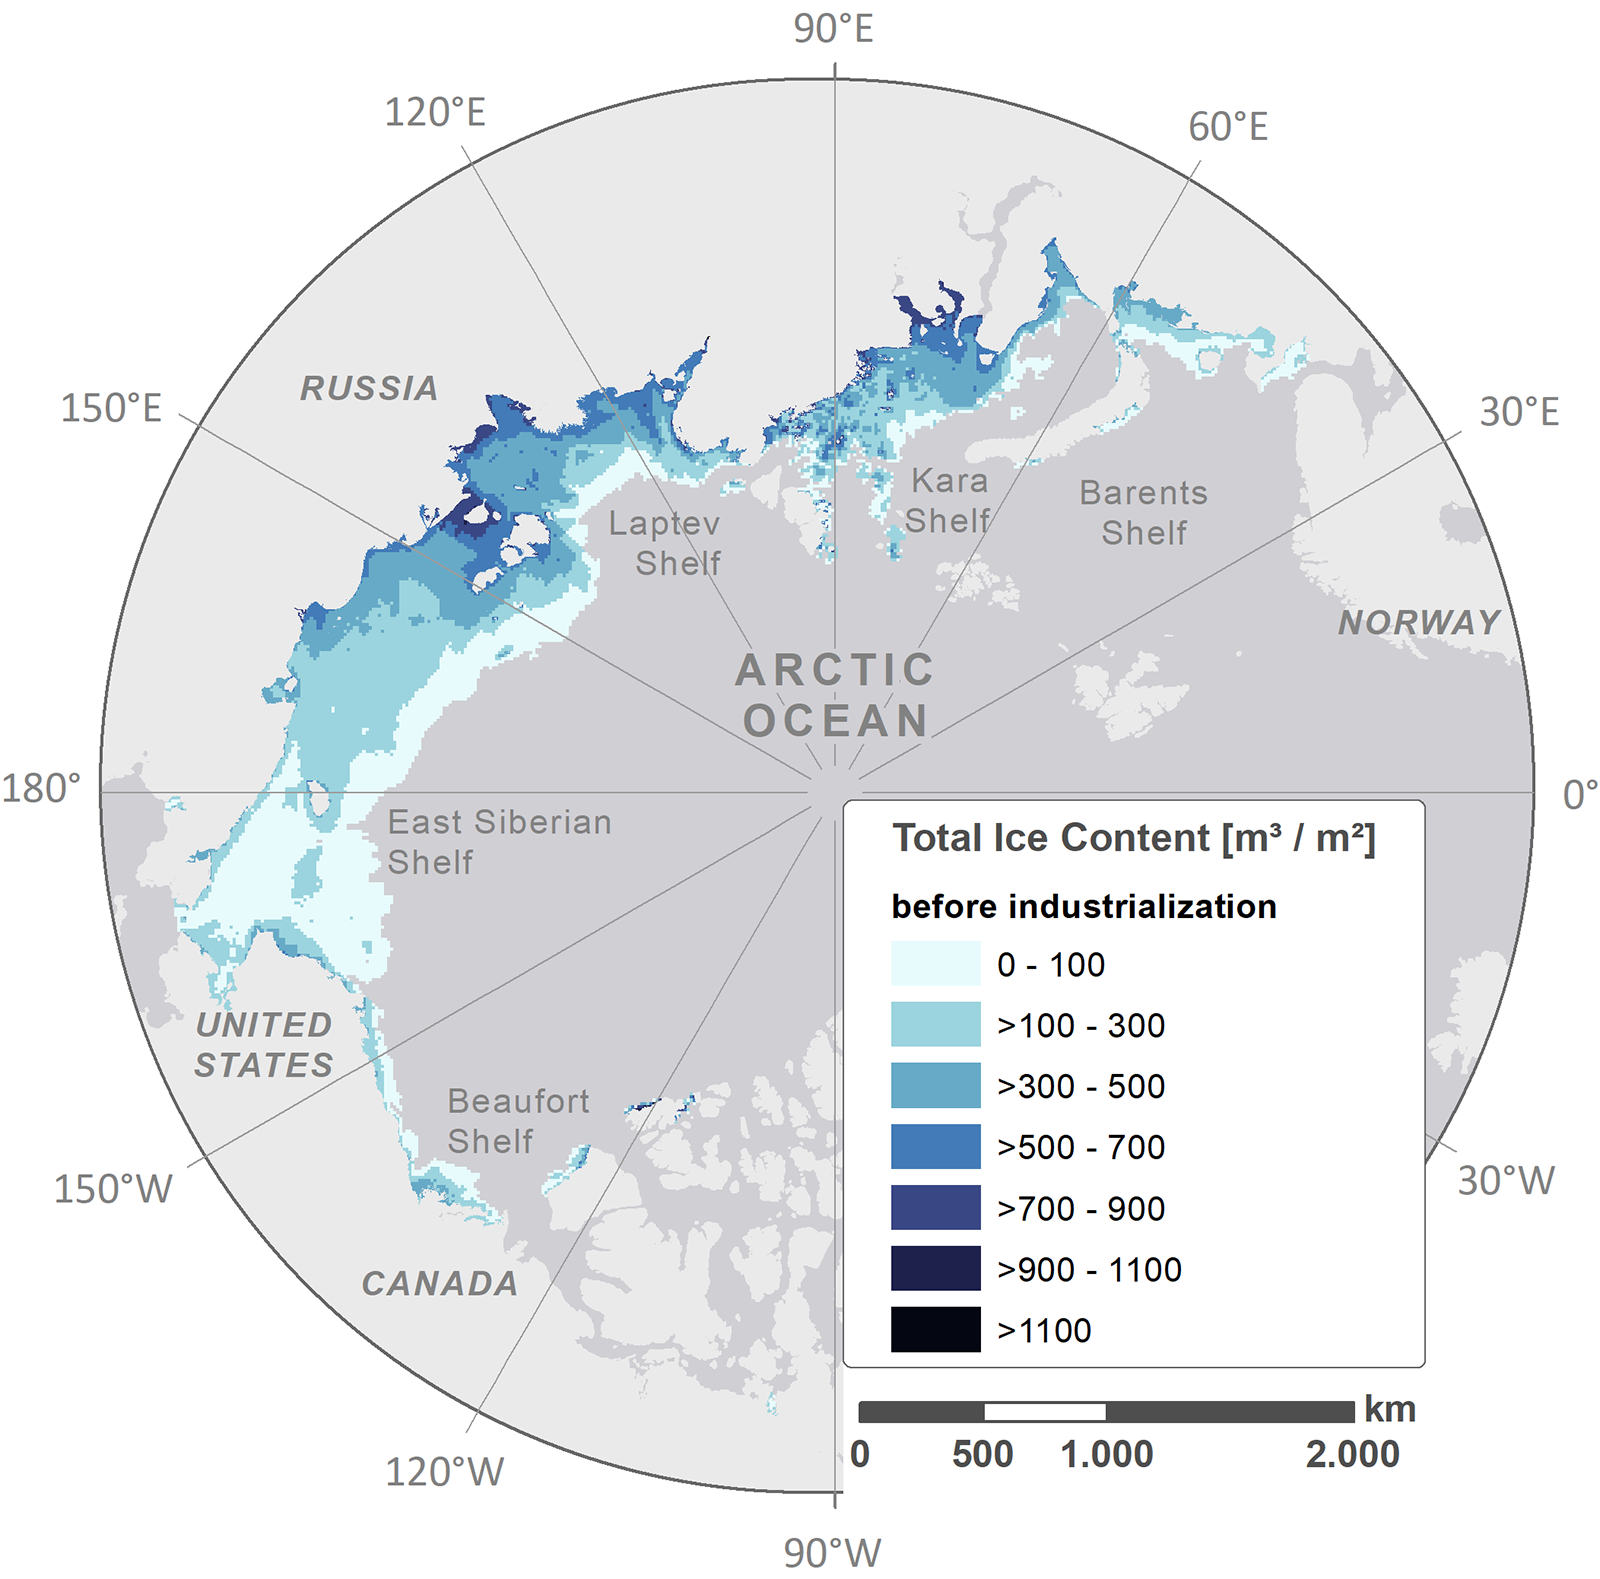
Even among scientists, it is not widely known that sediment beneath many continental shelves surrounding the Arctic Ocean is frozen. In areas that were exposed and not glaciated at the Last Glacial Maximum (LGM; approximately 21,000 years ago), prolonged subaerial exposure froze the ground down to hundreds of meters below the surface, creating permafrost. During deglaciation, sea levels rose and ocean water inundated coastal permafrost at low elevations, resulting in model estimates of 2.5 million km2 of ice-bearing subsea permafrost today (Fig. 1, Overduin et al. 2019). Today, terrestrial permafrost extends from the boreal forests on the south to the Arctic Ocean coastline on the north. On some Arctic Ocean margins, subsea permafrost starts at the coastline and continues northward beneath the seabed, even reaching the edge of the continental shelf in some places.
Terrestrial permafrost is defined as earth material that remains below 0°C for at least two consecutive years. A key difference between terrestrial permafrost and permafrost below the seafloor on continental shelves is the presence of salt. Because salt depresses the freezing point of water, subsea sediment can remain unfrozen (containing no ice) even at temperatures <0°C. For this reason, delineation of subsea permafrost typically relies not on the temperature of the sediment, but rather on an observation or inference of ice being present. This essay reports on recent subsea permafrost studies and places them in a pan-Arctic context, thereby underscoring the need for far better data on many Arctic Ocean margins.
The sea level rise that inundated terrestrial permafrost (producing subsea permafrost) replaced the very low average annual air temperatures (-10 to -20°C) above the tundra with seawater close to or above freezing (-2 to 0°C) for most of the year. This significant increase in overlying temperatures has led to thawing at both the top and bottom of subsea permafrost (e.g., Taylor et al. 2013). The infiltration of saline waters affects thaw patterns, fluid flow, and gas migration within the subsea permafrost region. With thawing, organic carbon previously held in frozen sediments becomes more available for microbial decomposition, producing greenhouse gases such as methane that may migrate toward the seafloor, ultimately reaching the ocean and possibly the atmosphere. If released into the atmosphere, these gases could further enhance global warming. Thawing also reduces the effectiveness of subsea permafrost as a trap for gases rising from deep layers, which might contain oil and gas deposits.
The current state of subsea permafrost has been characterized in only a few locations around the Arctic Ocean. The next section reviews observations that constrain the distribution of subsea permafrost on two well-studied Arctic Ocean margins: the Beaufort Sea and the Kara Sea.
Beaufort Sea observations
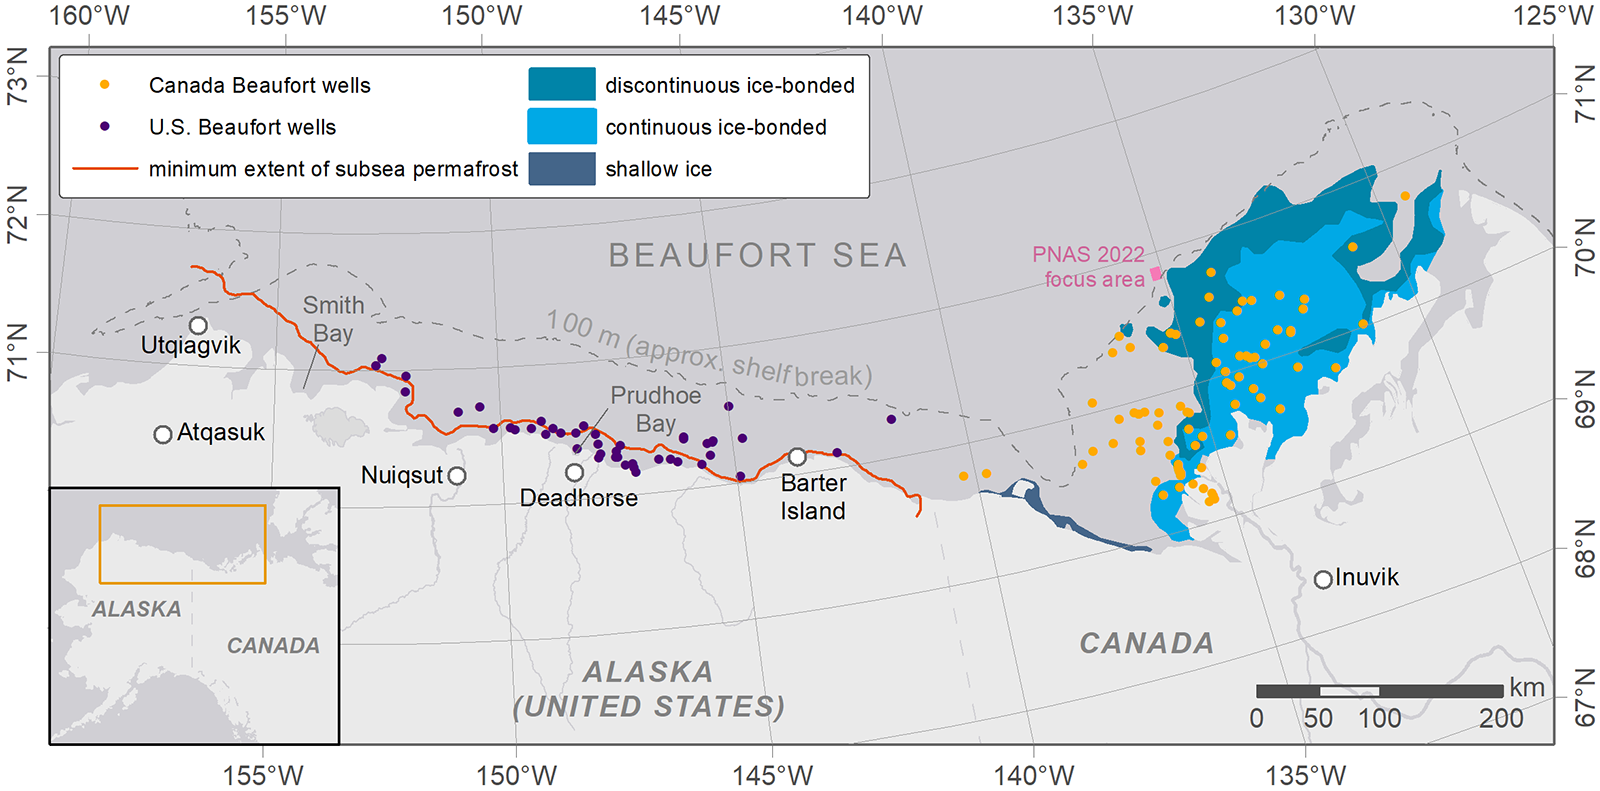
In the past decade, direct observations from the Beaufort Sea offshore of Canada and Alaska have provided evidence about the extent of ice-bearing subsea permafrost for this part of the Arctic Ocean margin. In both settings, researchers have combined legacy borehole data and seismic data to estimate the seaward extent of subsea permafrost and certain characteristics of its vertical distribution. Beneath the U.S. Beaufort continental shelf, seismically-defined subsea permafrost extends at least 3 to 17 km offshore the coast from Smith Bay to Prudhoe Bay and is very close to the coastline from Prudhoe Bay to the U.S.-Canada border (Fig. 2; Brothers et al. 2016; Ruppel et al. 2016). The water depths coinciding with the minimum seaward extent of subsea permafrost are less than 20 m along this entire section. Permafrost thicknesses onshore adjacent to the coast range from approximately 300 to 600 m. On the Canadian shelf, subsea permafrost underlies a larger portion of the Beaufort Sea in shelf waters up to 100 m deep and extending more than 130 km offshore (Hu et al. 2013; Grob et al. 2023). The subsea permafrost is almost 700 m thick near the coastline and thins towards the edge of the continental shelf, where recent changes in seabed morphology may indicate seafloor subsidence and thawing of ice in the sediment (Paull et al. 2022), possibly in response to groundwater flow beneath the subsea permafrost. Ice-bearing seafloor mounds called pingo-like features (PLFs), some of which emit methane-rich gas, may be an indication of sediment warming (Paull et al. 2007) in the Canadian Beaufort Sea. In both U.S. and Canadian settings, subsea permafrost is inferred to be degrading simultaneously from the top and the bottom (Ruppel et al. 2016; Grob et al. 2023), consistent with models (Taylor et al. 2013; Farquharson et al. 2018). The differences between the subsea permafrost distributions on the U.S. and Canadian Beaufort shelves (Brothers et al. 2016) probably reflect several factors, including massive freshwater outflows from the Mackenzie River; varying glacial, inundation, and uplift/subsidence histories (Farquharson et al. 2018); and differences in tectonic regimes (a passive margin on the west and a more compressive margin with substantial faulting, folding, and deeper fluid migration on the east).
Recent observations from the Kara Sea
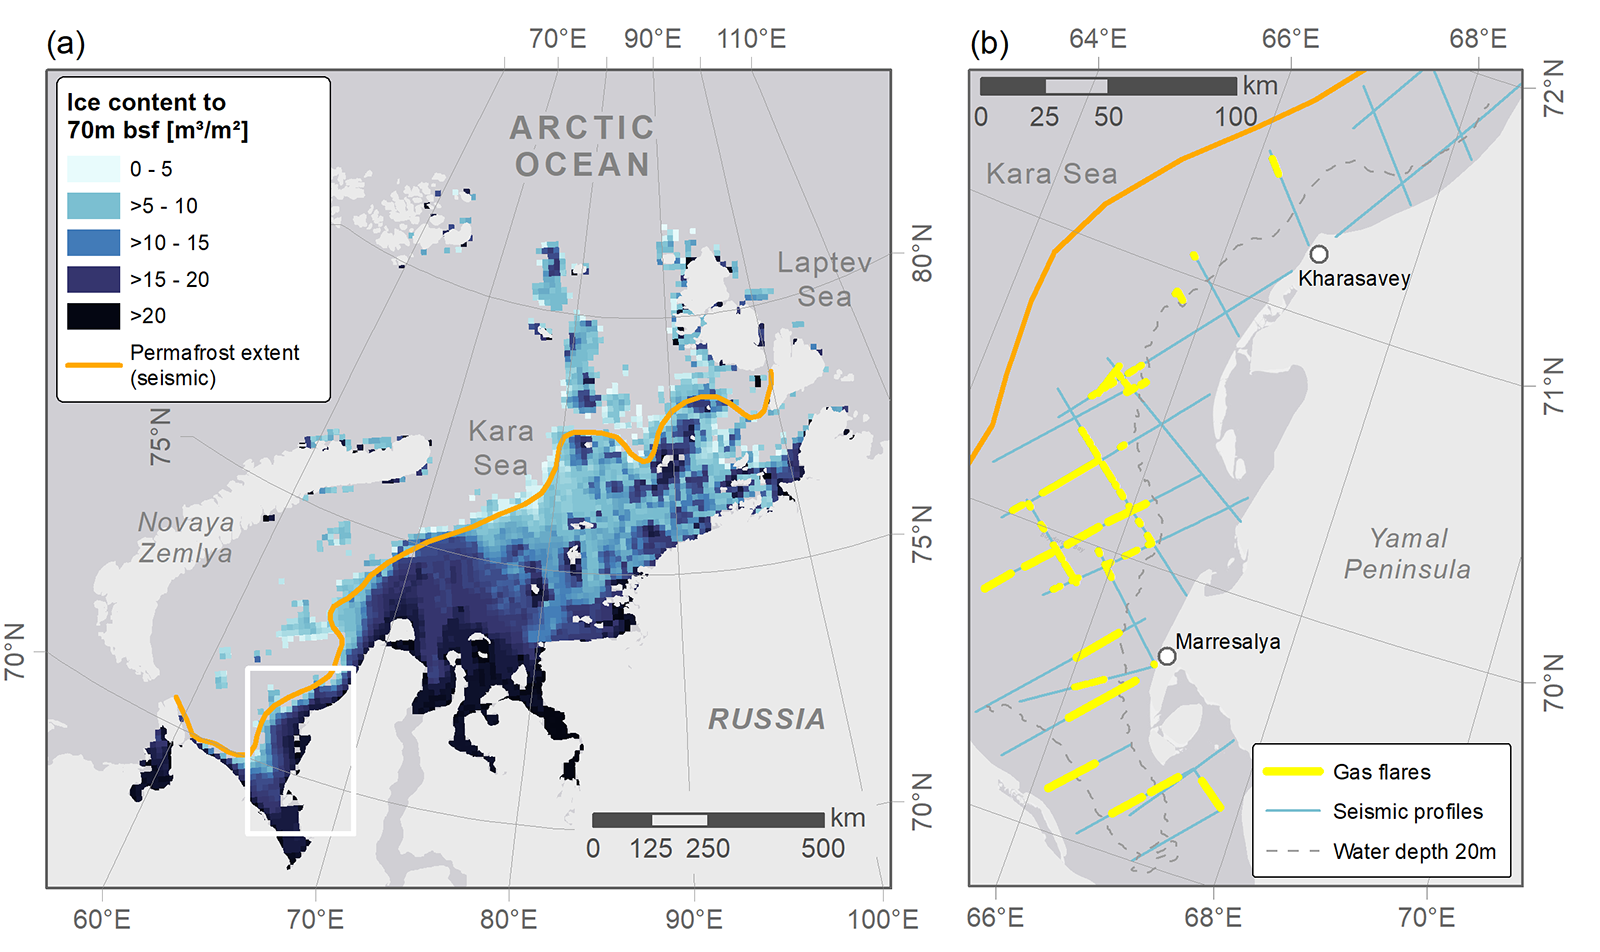
The Beaufort shelf, while being the best studied for subsea permafrost, constitutes only 4% of the circum-Arctic Ocean shelf area, compared to 25% for the Siberian shelf. Most of the observational data analyzed so far for the Siberian shelf come from the Kara Sea, where high-resolution seismic data, limited borehole data, and water column observations were used to infer subsea permafrost distribution and thaw patterns. Unlike the Barents Sea, vast areas of the Kara Sea shelf remained unglaciated at the LGM (Nazarov et al. 2022) and therefore froze to hundreds of meters depth, as corroborated by sediment ice content modeled over four glacial cycles (Fig. 3a; Overduin et al. 2019). Seismic and water column records indicate extensive seafloor gas release, which indicates partial or complete permafrost thaw at water depths greater than 20 m (Fig. 3b; Portnov et al. 2013). Work in the Kara Sea has shown that floating ice scours the shallow seafloor (<26 m water depth; Ogorodov et al. 2013), affecting up to 100% of the seabed in some areas and potentially providing an alternative explanation for gas release. However, a combined modeling and observational approach suggests that continuous subsea permafrost thins from ~400 m near the coast to discontinuous or absent with increasing distance from the coastline, out to 20 m water depth (Portnov et al. 2014). Discontinuous subsea permafrost may extend further seaward in deeper waters, out to ~110 m water depth. Additional evidence for Kara Sea permafrost thawing comes from a study of PLFs (Serov et al. 2015); a PLF located at ~35 m water depth has very high methane concentrations and almost no remaining ice-bearing sediments near the seafloor. This suggests that the permafrost cap has degraded and that gas is freely migrating towards the seafloor.
Fewer observations for the rest of the Arctic shelf
More than 80% of Arctic subsea permafrost is likely to lie beneath the most areally-extensive shelves—those of the Laptev and East Siberian Seas. This shallow continental shelf region is the widest on Earth, extending 800 km poleward from coastline to shelf break, and the entire expanse was subaerial and almost completely unglaciated when ice caps were at their most extensive and sea levels at their lowest (around 21,000 years ago). The resulting deep freeze produced permafrost thicknesses that exceed 700 m at the coastline. Almost no data are available to constrain the distribution and characteristics of subsea permafrost on this margin. In particular, most boreholes described in the literature are less than 100 m deep and located within 20 km of the coast. Seismic data from the outer Laptev shelf suggest that permafrost extends from the coast to roughly 60 m water depth and reveal the presence of buried terrestrial permafrost landforms (Rekant et al. 2015; Bogoyavlensky et al. 2022). The lessons of the Beaufort margin imply that the even larger Eastern Siberian shelf margin is likely to have significant spatial variations in the offshore extent of subsea permafrost since the effects of the last glaciation were probably experienced at different times over such a large geographic area.
The longevity of subsea permafrost is dependent on bottom water temperatures and salinity in the overlying waters, as well as geothermal heat flow at the base of the permafrost. The longer the period of inundation, the deeper the top of ice-bearing permafrost thaws, but the slower its thaw rate. Thaw depths observed in boreholes in the Beaufort and Laptev Seas have reached less than 100 m below the seafloor after thousands of years of inundation (Angelopoulos et al. 2020). In the Laptev and East Siberian Seas, annual sea ice formation is associated with sustained negative mean bottom water temperatures, which partially stabilize subsea permafrost against top-down thawing.
International collaborative research opportunity
The initial thawing of subsea permafrost was triggered by inundation during sea level rise following the end of the last glaciation. In the future, the rate of subsea permafrost thaw is expected to increase due to rapidly warming bottom water temperatures in an increasingly sea-ice-free Arctic Ocean (e.g., Wilkenskjeld et al. 2022), and new subsea permafrost will be added as low-lying coastal areas are covered by rising seas. The paucity of observational data about the extent of contemporary subsea permafrost on circum-Arctic Ocean shelves, especially on the vast Siberian margin, provides no baseline for comparing future subsea permafrost distributions nor for quantifying the rate of loss and implications of thawing. Critical questions are how much gas (particularly the greenhouse gases, carbon dioxide and methane) is trapped within and beneath subsea permafrost in bubbles or as frozen gas hydrates, and how rates of microbial methane production, gas hydrate dissociation, and gas migration may increase as sediments warm and ice thaws (Ruppel and Kessler 2017). Characterizing the extent and current state of subsea permafrost and estimating the potential gas release associated with its thaw could be productive areas for greater international and transboundary research cooperation.
Conclusions
Available observational data provide an incomplete picture of the circum-Arctic Ocean distribution of subsea permafrost, its current state (continuous vs. discontinuous; ice content) and its susceptibility to future warming. The perspective emerging from studies in the Beaufort and Kara Seas implies that substantial permafrost thaw has occurred under continental shelves over the last ~21,000 years since the onset of deglacial sea level rise. Lacking better constraints on the extent of subsea permafrost under the vast Siberian continental shelf, it is difficult to predict when future warming could lead to the complete disappearance of present-day subsea permafrost or to assess the likelihood and timing of enhanced seafloor releases of carbon dioxide and methane as a consequence of permafrost thaw.
Acknowledgments
P. Overduin received funding under the European Union’s Horizon 2020 Research and Innovation Programme under grant agreement no. 773421. C. Ruppel’s research was funded by the National Methane Hydrates R&D Program at the U.S. Dept. of Energy under agreements DE-FE0023495 and 89243320SFE000013. We thank Sebastian Laboor of AWI for producing the figures.
References
Angelopoulos, M., P. P. Overduin, F. Miesner, M. N. Grigoriev, and A. A. Vasiliev, 2020: Recent advances in the study of Arctic submarine permafrost. Permafrost Periglacial Processes, 31, 442-453, https://doi.org/10.1002/ppp.2061.
Bogoyavlensky, V., A. Kishankov, A. Kazanin, and G. Kazanin, 2022: Distribution of permafrost and gas hydrates in relation to intensive gas emission in the central part of the Laptev Sea (Russian Arctic). Mar. Petrol. Geol., 138, 105527, https://doi.org/10.1016/j.marpetgeo.2022.105527.
Brothers, L. L., B. M. Herman, P. E. Hart, and C. D. Ruppel, 2016: Subsea ice-bearing permafrost on the US Beaufort margin: 1. Minimum seaward extent defined from multichannel seismic reflection data. Geochem. Geophys. Geosyst., 17, 4354-4365, https://doi.org/10.1002/2016GC006584.
Farquharson, L., D. Mann, T. Rittenour, P. Groves, G. Grosse, and B. Jones, 2018: Alaskan marine transgressions record out-of-phase Arctic Ocean glaciation during the last interglacial. Geology, 46, 783-786, https://doi.org/10.1130/g40345.1.
Grob, H., M. Riedel, M. J. Duchesne, S. Krastel, J. Bustamante, G. Fabien-Ouellet, Y. K. Jin, and J. K. Hong, 2023: Revealing the extent of submarine permafrost and gas hydrates in the Canadian Arctic Beaufort Sea using seismic reflection indicators. Geochem. Geophys. Geosyst., 24, e2023GC010884, https://doi.org/10.1029/2023GC010884.
Hu, K., D. R. Issler, Z. Chen, and T. A. Brent, 2013: Permafrost investigation by well logs, and seismic velocity and repeated shallow temperature surveys, Beaufort-Mackenzie Basin. Natural Resources Canada/CMSS/Information Management, Open File 6956, https://doi.org/10.4095/293120.
Nazarov, D. V., O. A. Nikolskaia, I. V. Zhigmanovskiy, M. V. Ruchkin, and A. A. Cherezova, 2022: Lake Yamal, an ice-dammed megalake in the West Siberian Arctic during the Late Pleistocene, ~60-35 ka. Quat. Sci. Rev., 289, 107614, https://doi.org/10.1016/j.quascirev.2022.107614.
Ogorodov, S., V. Arkhipov, O. Kokin, A. Marchenko, P. Overduin, and D. Forbes, 2013: Ice effect on coast and seabed in Baydaratskaya Bay, Kara Sea. Geogr. Environ. Sustain., 6, 21-37, https://doi.org/10.24057/2071-9388-2013-6-3-21-37.
Overduin, P. P., and Coauthors, 2019: Submarine permafrost map in the Arctic modeled using 1-D transient heat flux (SuPerMAP). J. Geophys. Res.-Oceans, 124, 3490-3507, https://doi.org/10.1029/2018jc014675.
Paull, C. K., and Coauthors, 2007: Origin of pingo-like features on the Beaufort Sea shelf and their possible relationship to decomposing methane gas hydrates. Geophys. Res. Lett., 34, L01603, https://doi.org/10.1029/2006gl027977.
Paull, C. K., S. R. Dallimore, Y. K. Jin, and H. Melling, 2022: Rapid seafloor changes associated with the degradation of Arctic submarine permafrost. Proc. Natl. Acad. Sci., 119, e2119105119, https://doi.org/10.1073/pnas.2119105119.
Portnov, A., A. J. Smith, J. Mienert, G. Cherkashov, P. Rekant, P. Semenov, P. Serov, and B. Vanshtein, 2013: Offshore permafrost decay and massive seabed methane escape in water depths >20 m at the South Kara Sea shelf. Geophys. Res. Lett., 40, 3962-3967, https://doi.org/10.1002/grl.50735.
Portnov, A., J. Mienert, and P. Serov, 2014: Modeling the evolution of climate-sensitive Arctic subsea permafrost in regions of extensive gas expulsion at the West Yamal shelf. J. Geophys. Res.-Biogeosci., 119, 2082-2094, https://doi.org/10.1002/2014jg002685.
Rekant, P., H. A. Bauch, T. Schwenk, A. Portnov, E. Gusev, V. Spiess, G. Cherkashov, and H. Kassens, 2015: Evolution of subsea permafrost landscapes in Arctic Siberia since the Late Pleistocene: a synoptic insight from acoustic data of the Laptev Sea. Arktos, 1, 11, https://doi.org/10.1007/s41063-015-0011-y.
Ruppel, C. D., B. M. Herman, L. L. Brothers, and P. E. Hart, 2016: Subsea ice-bearing permafrost on the U.S. Beaufort margin: 2. Borehole constraints. Geochem. Geophys. Geosyst., 17, 4333-4353, https://doi.org/10.1002/2016GC006582.
Ruppel, C. D., and J. D. Kessler, 2017: The interaction of climate change and methane hydrates. Rev. Geophys., 55, 126-168, https://doi.org/10.1002/2016RG000534.
Serov, P., A. Portnov, J. Mienert, P. Semenov, and P. Ilatovskaya, 2015: Methane release from pingo-like features across the South Kara Sea shelf, an area of thawing offshore permafrost. J. Geophys. Res.-Earth, 120, 1515-1529, https://doi.org/10.1002/2015jf003467.
Taylor, A. E., S. R. Dallimore, P. R. Hill, D. R. Issler, S. Blasco, and F. Wright, 2013: Numerical model of the geothermal regime on the Beaufort Shelf, arctic Canada since the Last Interglacial. J. Geophys. Res.-Earth, 118, 2365-2379, https://doi.org/10.1002/2013jf002859.
Wilkenskjeld, S., F. Miesner, P. P. Overduin, M. Puglini, and V. Brovkin, 2022: Strong increase in thawing of subsea permafrost in the 22nd century caused by anthropogenic climate change. Cryosphere, 16, 1057-1069, https://doi.org/10.5194/tc-16-1057-2022.
November 14, 2023