
K. E. Frey1, J. C. Comiso2, L. W. Cooper3, J. M. Grebmeier3, and L. V. Stock2
1Graduate School of Geography, Clark University, Worcester, MA, USA
2Cryospheric Sciences Laboratory, Goddard Space Flight Center, NASA, Greenbelt, MD, USA
3Chesapeake Biological Laboratory, University of Maryland Center for Environmental Science, Solomons, MD, USA
(See erratum, published in 2021)
Highlights
- Satellite estimates of ocean primary productivity (i.e., the rate at which marine algae transform dissolved inorganic carbon into organic material) showed higher values for 2020 (relative to the 2003-2019 mean) for seven of the nine investigated regions (with the Sea of Okhotsk and Bering Sea showing lower than average values).
- All regions continue to exhibit positive trends over the 2003-2020 period, with the strongest trends in the Eurasian Arctic, Barents Sea, and Greenland Sea.
- During July and August 2020, a ~600 km long region in the Laptev Sea of the Eurasian Arctic showed much higher chlorophyll-a concentrations (~2 times higher for July and ~6 times higher for August) than the same months of the multiyear average (2003-2019), associated with very early loss of sea ice in spring and summer (see essay Sea Ice).
Introduction
Autotrophic single-celled algae living in sea ice (ice algae) and water column (phytoplankton) are the main primary producers in the Arctic Ocean. Through photosynthesis, they transform dissolved inorganic carbon into organic material. Consequently, primary production provides a key ecosystem service by providing energy to the entire food web in the oceans. Primary productivity is strongly dependent upon light availability and the presence of nutrients, and thus is highly seasonal in the Arctic. The melting and retreat of sea ice during spring are strong drivers of primary production in the Arctic Ocean and its adjacent shelf seas, owing to enhanced light availability and stratification (Barber et al. 2015; Leu et al. 2015; Ardyna et al. 2017). Recent studies have emphasized that primary production occurs under lower light conditions and earlier in the seasonal cycle than previously recognized (Randelhoff et al. 2020). Other studies suggest that increased nutrient supply have also influenced overall production (Henley et al. 2020; Lewis et al. 2020). Furthermore, while declines in Arctic sea ice extent over the past several decades (see essay Sea Ice) have contributed substantially to shifts in primary productivity throughout the Arctic Ocean, the response of primary production to sea ice loss has been both seasonally and spatially variable (e.g., Tremblay et al. 2015; Hill et al. 2018).
Here we present satellite-based estimates of algal chlorophyll-a (occurring in all species of phytoplankton), based on ocean color, and subsequently provide calculated primary production estimates. These results are shown for ocean areas with less than 10% sea ice concentration and, therefore, do not include production by sea ice algae or under-ice phytoplankton blooms, which can be significant (e.g., Lalande et al. 2019).
Chlorophyll-a
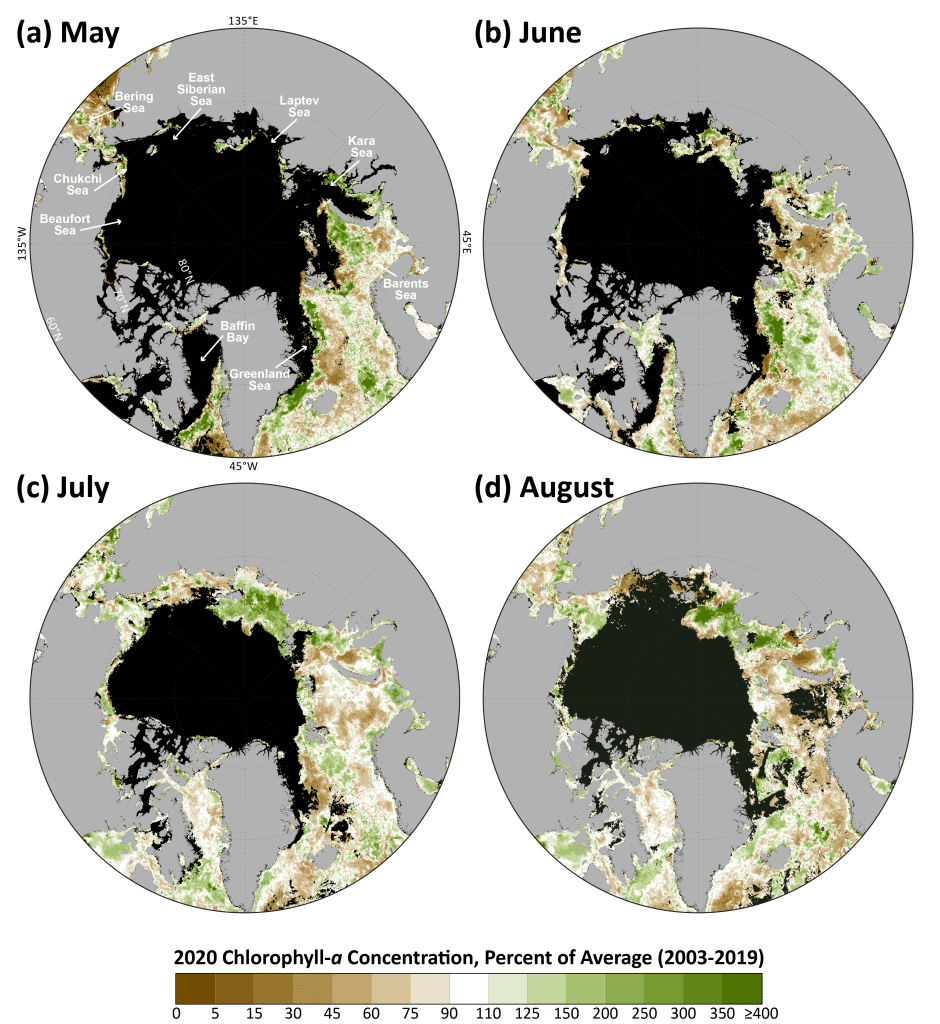
Measurements of the algal pigment chlorophyll (e.g., chlorophyll-a) serve as a proxy for the amount of algal biomass present (e.g., Behrenfeld and Boss 2006) as well as overall plant health. The complete, updated Moderate Resolution Imaging Spectroradiometer (MODIS)-Aqua satellite chlorophyll-a record for the northern polar region for the years 2003-2020 serves as a time series against which individual years can be compared. For this reporting, we show mean monthly chlorophyll-a concentrations calculated as a percentage of the 2003-2019 average, which was chosen as the reference period in order to maximize the length of the satellite-based time series.
The data presented in Fig. 1 show the ratio of chlorophyll-a concentrations for 2020 to chlorophyll-a concentrations for the multiyear average from 2003 to 2019 expressed as percentages, where patterns are spatially and temporally heterogeneous across the Arctic Ocean. These patterns are often associated with the timing of the seasonal break-up and retreat of the sea ice cover (Fig. 2) (see essay Sea Ice): high percentages tend to occur in regions where the break-up is relatively early, while low percentages tend to occur in regions where the break-up is delayed. The most notable enhanced values in 2020 occurred during July and August, with high concentrations of chlorophyll-a occurring in the Laptev Sea of the Eurasian Arctic (Figs. 1c, d), linked with very early sea ice loss and exceptionally warm conditions in the Laptev Sea in August 2020 (see essays Sea Surface Temperature and Sea Ice). In particular, this regional increase in chlorophyll-a concentrations extended ~600 km in length and exhibited on average ~2 times higher (July) and ~6 times higher (August) concentrations compared to the 2003-2019 average. Additional widespread increases in chlorophyll-a concentrations occurred along the ice edge in the Greenland Sea during May and June (Figs. 1a, b) associated with increases in sea ice to the west (Figs. 2a, b), as well as in the Barents Sea during May (Fig. 1a). Some of the lowest percentages of chlorophyll-a concentrations (i.e., low primary productivity) occurred in the northern Bering Sea during May, June, and August (Figs. 1a, b, and d) and in the Barents Sea in June, July, and August (Fig. 1b, c, and d).
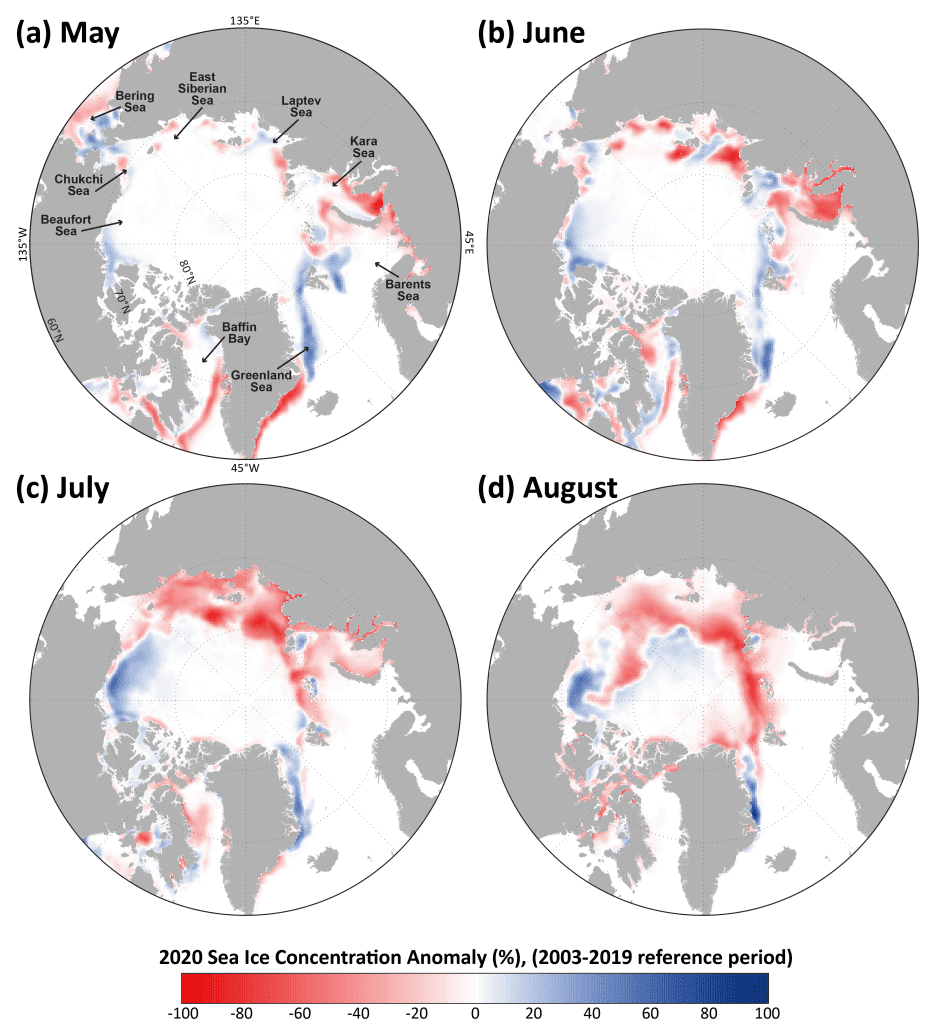
As noted above, some of the lowest percentages of chlorophyll-a concentrations observed in 2020 occurred over the shelf region of the Bering Sea during May, June, and August (Figs. 1a, b, and d). During June, these low percentages extended northward through the Bering Strait and onto the Chukchi Shelf (Fig. 1b). It is unclear from the satellite time series what role sea ice may be playing in these reductions of chlorophyll-a concentrations. For instance, 2020 experienced a resurgence of seasonal sea ice cover across the northern Bering Sea and Bering Strait region (e.g., Fig. 2a) compared to drastic reductions observed in 2018 (Frey et al. 2018; Stabeno and Bell 2019) and 2019 (Frey et al. 2019) (see essay Sea Ice), yet chlorophyll-a concentrations in the region do not appear to respond in a consistent way to these potential sea ice forcings. In general, knowing how regions experience changes in chlorophyll-a concentrations alongside dramatic losses of sea ice cover provides insight into what to expect with future sea ice declines. However, while many of these observed patterns are directly linked to sea ice variability (and therefore light availability), it is noteworthy that there are other important factors at play that add to the complexity of observed chlorophyll-a concentrations such as the distribution and availability of nutrients (e.g., Giesbrecht et al. 2019; Lewis et al. 2020). The impacts of sea ice decline on specific water column phytoplankton properties, such as community composition and carbon biomass (Neeley et al. 2018), as well as broader ecosystem responses (Duffy-Anderson et al. 2019) will also be critical to continue to monitor. Furthermore, it is important to reiterate that the satellite ocean color data do not account for early-season under-ice blooms that may contribute substantially to primary productivity in these regions (e.g., Arrigo et al. 2012). Deployment of a new sediment trap array in the northern Bering Sea, together with a mooring array in autumn 2020 should improve understanding of seasonal carbon production and export in this region, just as new year-round results reported from the Chukchi Ecosystem Observatory in the northern Chukchi Sea (Lalande et al. 2020) have improved understanding of annual production.
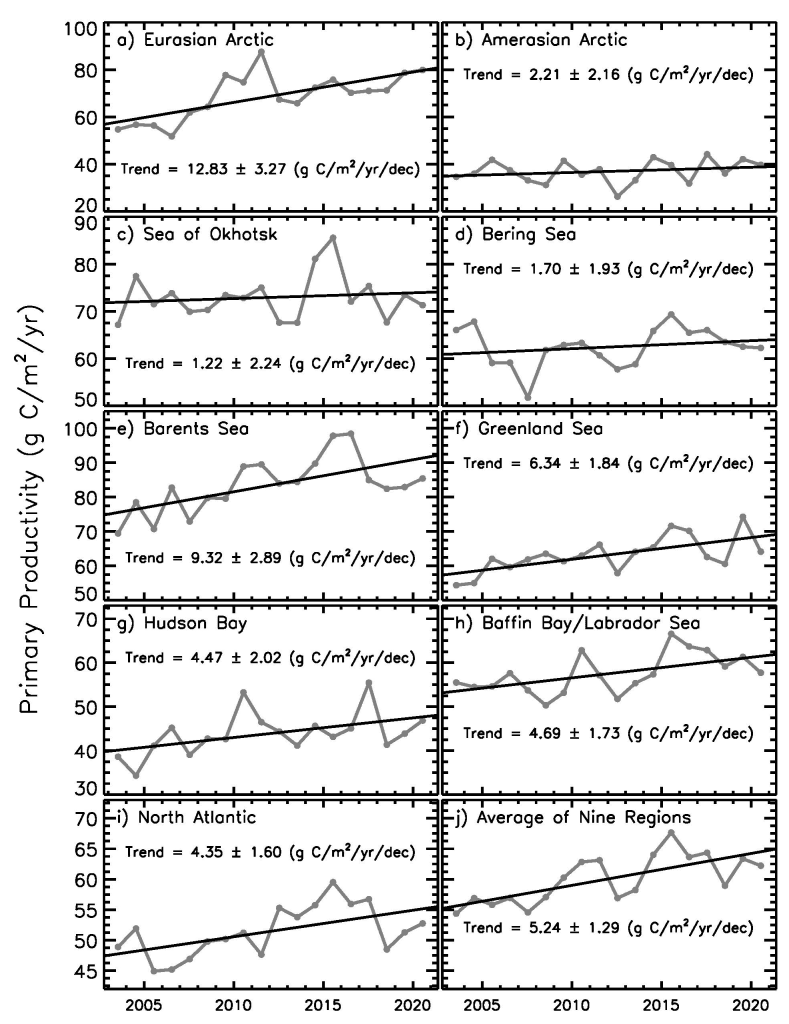
Primary production
Chlorophyll-a concentrations give an estimate of the total standing stock of algal biomass. However, rates of primary production (i.e., the production of organic carbon via photosynthesis) provide a different perspective since not all algae present in the water column are necessarily actively producing. Primary productivity can be estimated by combining remotely sensed chlorophyll-a concentrations with sea surface temperatures, incident solar irradiance, and mixed layer depths (see caption in Fig. 3 for references to details of the method for estimation). Estimates of ocean primary productivity for nine regions (and the average of these nine regions) across the Arctic (relative to the 2003-2019 reference period) were assessed (Fig. 3, Table 1). In particular, the Eurasian Arctic designation includes the Kara Sea, Laptev Sea, and East Siberian Sea, whereas the Amerasian Arctic designation includes the Chukchi Sea, Beaufort Sea, and Canadian Archipelago region. The defined North Atlantic region is south of 60° N and east of 45° W, and as such is not inclusive of the Labrador or Greenland seas. Our results show above average primary productivity for 2020 in all regions except for the Sea of Okhotsk and Bering Sea (Fig. 3, Table 1). In the longer term, positive trends in primary productivity occurred in all regions during the period 2003-2020 (Fig. 3, Table 1). Statistically significant positive trends occurred in the Eurasian Arctic, Barents Sea, Greenland Sea, Hudson Bay, Baffin Bay/Labrador Sea, North Atlantic, and for the average of the nine regions. The steepest trends over the 2003-2020 period were found for the Eurasian Arctic (12.83 g C/m2/yr/decade, or a ~37.7% increase), the Barents Sea (9.32 g C/m2/yr/decade, or a ~21.0% increase), and the Greenland Sea (6.34 g C/m2/yr/decade, or a ~18.7% increase). In summary, while observations of primary productivity have shown complex interannual and spatial patterns over the 2003-2020 study period, overall we observe increasing trends across all sectors of the Arctic Ocean.
| Region | Trend, 2003-20 (g C/m2/yr/decade) |
Mann-Kendall p-value |
% Change | 2020 Anomaly (g C/m2/yr) from a 2003-19 reference period |
2020 Primary Productivity (% of the 2003-19 average) |
|---|---|---|---|---|---|
| Eurasian Arctic | 12.83 | 0.001 | 37.7 | 11.74 | 117.2 |
| Amerasian Arctic | 2.21 | 0.260 | 10.7 | 2.90 | 107.9 |
| Sea of Okhotsk | 1.22 | 0.601 | 2.9 | -1.75 | 97.6 |
| Bering Sea | 1.70 | 0.002 | 4.7 | -0.20 | 99.7 |
| Barents Sea | 9.32 | 0.004 | 21.0 | 2.09 | 102.5 |
| Greenland Sea | 6.34 | 0.021 | 18.7 | 0.98 | 101.6 |
| Hudson Bay | 4.47 | 0.039 | 18.9 | 3.12 | 107.1 |
| Baffin Bay/Labrador Sea | 4.69 | 0.007 | 14.9 | 0.24 | 100.4 |
| North Atlantic | 4.35 | 0.001 | 15.5 | 1.37 | 103.8 |
| Average of nine regions | 5.24 | 0.001 | 16.0 | 2.28 | 103.8 |
Acknowledgments
K. Frey would like to acknowledge financial support by the National Science Foundation Arctic Observing Network (AON) Program (Grants 1702137 and 1917434).
References
Ardyna, M., M. Babin, E. Devred, A. Forest, M. Gosselin, P. Raimbault, and J. -É. Tremblay, 2017: Shelf-basin gradients shape ecological phytoplankton niches and community composition in the coastal Arctic Ocean (Beaufort Sea). Limnol. Oceanogr., 62, 2113-2132, https://doi.org/10.1002/lno.10554.
Arrigo, K. R., and Coauthors, 2012: Massive phytoplankton blooms under Arctic sea ice. Science, 336, 1408, https://doi.org/10.1126/science.1215065.
Barber, D. G., and Coauthors, 2015: Selected physical, biological and biogeochemical implications of a rapidly changing Arctic Marginal Ice Zone. Prog. Oceanogr., 139, 122-150, https://doi.org/10.1016/j.pocean.2015.09.003.
Behrenfeld, M. J., and E. Boss, 2006: Beam attenuation and chlorophyll concentration as alternative optical indices of phytoplankton biomass. J. Mar. Res., 64, 431-451.
Behrenfeld, M. J., and P. G. Falkowski, 1997: Photosynthetic rates derived from satellite-based chlorophyll concentration. Limnol. Oceanogr., 42(1), 1-20.
Comiso, J. C., 2015: Variability and trends of the global sea ice covers and sea levels: effects on physicochemical parameters. Climate and fresh water toxins, L. M. Botana, M. C. Lauzao, and N. Vilarino, Eds., De Gruyter, Berlin, Germany.
Comiso, J. C., R. A. Gersten, L. V. Stock, J. Turner, G. J. Perez, and K. Cho, 2017a: Positive trend in the Antarctic sea ice cover and associated changes in surface temperature. J. Climate, 30, 2251-2267, https://doi.org/10.1175/JCLI-D-16-0408.1 .
Comiso, J. C., W. N. Meier, and R. Gersten, 2017b: Variability and trends in the Arctic Sea ice cover: Results from different techniques. J. Geophys. Res.-Oceans, 122, 6883-6900, https://doi.org/10.1002/2017JC012768.
Duffy-Anderson, J. T., and Coauthors, 2019: Responses of the northern Bering Sea and southeastern Bering Sea pelagic ecosystems following record-breaking low winter sea ice. Geophys. Res. Lett., 46, 9833-9842, https://doi.org/10.1029/2019GL083396.
Frey, K. E., J. C. Comiso, L. W. Cooper, J. M. Grebmeier and L. V. Stock, 2018: Arctic Ocean Primary Productivity: The response of marine algae to climate warming and sea ice decline. Arctic Report Card 2018, E. Osborne, J. Richter-Menge, and M. Jeffries, Eds., https://www.arctic.noaa.gov/Report-Card.
Frey, K. E., J. C. Comiso, L. W. Cooper, J. M. Grebmeier and L. V. Stock, 2019: Arctic Ocean Primary Productivity: The response of marine algae to climate warming and sea ice decline. Arctic Report Card 2019, J. Richter-Menge, M. L. Druckenmiller, and M. Jeffries, Eds., https://www.arctic.noaa.gov/Report-Card.
Giesbrecht, K. E., D. E. Varela, J. Wiktor, J. M. Grebmeier, B. Kelly, and J. E. Long, 2019: A decade of summertime measurements of phytoplankton biomass, productivity and assemblage composition in the Pacific Arctic Region from 2006 to 2016. Deep-Sea Res. Part II Top. Stud. Oceanogr., 162, 93-113, https://doi.org/10.1016/j.dsr2.2018.06.010.
Henley, S. F., M. Porter, L. Hobbs, J. Braun, R. Guillaume-Castel, E. J. Venables, E. Dumont, and F. Cottier, 2020: Nitrate supply and uptake in the Atlantic Arctic sea ice zone: seasonal cycle, mechanisms and drivers. Philos. Trans. Royal Soc. A, 378, 20190361, https://doi.org/10.1098/rsta.2019.0361.
Hill, V., M. Ardyna, S. H. Lee, and D. E. Varela, 2018: Decadal trends in phytoplankton production in the Pacific Arctic Region from 1950 to 2012. Deep-Sea Res. Part II Top. Stud. Oceanogr., 152, 82-94, https://doi.org/10.1016/j.dsr2.2016.12.015.
Lalande, C., J. M. Grebmeier, R. R. Hopcroft and S. Danielson, 2020: Annual cycle of export fluxes of biogenic matter near Hanna Shoal in the northeast Chukchi Sea. Deep-Sea Res. Part II Top. Stud. Oceanogr., 177, 104730, https://doi.org/10.1016/j.dsr2.2020.104730.
Lalande, C., E. -M. Nöthig, and L. Fortier, 2019: Algal export in the Arctic Ocean in times of global warming. Geophys. Res. Lett., 46, 5959-5967, https://doi.org/10.1029/2019GL083167.
Leu, E., C. J. Mundy, P. Assmy, K. Campbell, T. M. Gabrielsen, M. Gosselin, T. Juul-Pedersen, and R. Gradinger, 2015: Arctic spring awakening – Steering principles behind the phenology of vernal ice algal blooms. Prog. Oceanogr., 139, 151-170, https://doi.org/10.1016/j.pocean.2015.07.012.
Lewis, K. M., G. L. van Dijken, and K. R. Arrigo, 2020: Changes in phytoplankton concentration now drive increased Arctic Ocean primary production. Science, 369, 198-202, https://doi.org/10.1126/science.aay8380.
Neeley, A. R., L. A. Harris, and K. E. Frey, 2018: Unraveling phytoplankton community dynamics in the northern Chukchi Sea under sea‐ice‐covered and sea‐ice‐free conditions. Geophys. Res. Lett., 45, 7663-7671, https://doi.org/10.1029/2018GL077684.
Randelhoff, A., and Coauthors, 2020: Arctic mid-winter phytoplankton growth revealed by autonomous profilers. Sci. Adv., 6, eabc2678, https://doi.org/10.1126/sciadv.abc2678.
Stabeno, P., and S. W. Bell, 2019: Extreme conditions in the Bering Sea (2017-2018): record-breaking low sea-ice extent. Geophys. Res. Lett., 46, 8952-8959, https://doi.org/10.1029/2019GL083816.
Tremblay J. -É., L. G. Anderson, P. Matrai, P. Coupel, S. Bélanger, C. Michel, and M. Reigstad, 2015: Global and regional drivers of nutrient supply, primary production and CO2 drawdown in the changing Arctic Ocean. Prog. Oceanogr., 139, 171-196, https://doi.org/10.1016/j.pocean.2015.08.009.
November 16, 2020