

D. Perovich1, W. Meier2,3, M. Tschudi4, S. Hendricks5, A. A. Petty6, D. Divine7, S. Farrell8, S. Gerland7, C. Haas5, L. Kaleschke5, O. Pavlova7, R. Ricker5, X. Tian-Kunze5, M. Webster9, and K. Wood10,11
1Thayer School of Engineering, Dartmouth College, Hanover, NH, USA
2Cooperative Institute for Research in Environmental Sciences, University of Colorado Boulder, Boulder, CO, USA
3National Snow and Ice Data Center, Boulder, CO, USA
4Aerospace Engineering Sciences, University of Colorado, Boulder, CO, USA
5Alfred Wegener Institute, Helmholtz Centre for Polar and Marine Research, Bremerhaven, Germany
6Goddard Space Flight Center, NASA, Greenbelt, MD, USA
7Norwegian Polar Institute, Fram Centre, Tromsø, Norway
8NOAA Earth System Science Interdisciplinary Center, University of Maryland, College Park, MD, USA
9Geophysical Institute, University of Alaska Fairbanks, Fairbanks, AK, USA
10Cooperative Institute for Climate, Ocean, and Ecosystem Studies, University of Washington, Seattle, WA, USA
11Pacific Marine Environmental Laboratory, NOAA, Seattle, WA, USA
Highlights
- The Arctic sea ice cover continues declining trends in the summer minimum and winter maximum extents. In 2020, end of winter extent was the 11th lowest and the end of summer extent was the 2nd lowest in the satellite record (1979-2020).
- Maximum Northern Hemisphere sea ice volume in April 2020 was 18,785 km3, approximately 1,000 km3 below the 2010-2019 average. October 2020 sea ice volume showed the lowest value (4.627 km3) in the past 10 years because of the second largest summer loss of 15.215 km3.
- Sea ice melt onset and opening was very early in the Siberian coastal region, related to very warm spring and early summer air temperatures and offshore winds.
Introduction
Arctic sea ice is an important part of the climate system. Its higher albedo reflects much of the incoming solar radiation during the summer, keeping the region cooler than an ice-free environment. The sea ice cover acts as a physical barrier between the ocean and the atmosphere, limiting energy and moisture exchange. Ice formation and melt substantially modify the biogeochemical balance of the upper ocean. Sea ice also acts as a platform for charismatic megafauna and other components of the ecosystem. Finally, it is both a facilitator and hazard to human activities in the Arctic. In 2020, the Arctic sea ice cover continued the declining trends in extent, thickness, and volume.
For sea ice, 2020 was marked by very warm spring conditions (see essay Surface Air Temperature), leading to early ice loss, particularly in the East Siberian and Laptev Sea regions. During June, Laptev Sea ice extent dropped to record-low levels for that time of year, which led to particularly warm sea surface temperatures later in the summer (see essay Sea Surface Temperature). Ocean warmth also led to a slow freeze-up in autumn 2019, which led to warm autumn air temperatures (see essay Surface Air Temperature) and may have helped pre-condition sea ice in the region for the early melt in spring 2020. In contrast to recent years, early season ice loss in the Beaufort and Chukchi Seas was near the 1981 to 2010 climatological average; however, those seas experienced rapid late loss and ended the summer far below average. This late-summer loss in the Pacific sector drove a faster-than-normal late-August and early September ice loss and had implications for primary productivity (see essay Ocean Primary Productivity). The large-scale conditions described here complement and provide context for the in situ observations from the MOSAiC expedition during October 2019 to October 2020 (see essay MOSAiC).
Sea ice extent
Sea ice extent is a common metric of Arctic sea ice conditions because of its long and consistent record from satellite-borne passive microwave sensors, now covering 42 years. The substantial decline in extent since 1979 is one of the most iconic indicators of climate change. In September 2020, the average monthly extent was 3.92 million km2 (Fig. 1), the second lowest monthly extent in the 42-year satellite record. The linear trend of the monthly average extent for 1979 to 2020 is -82,700 km2 per year or -13.1% per decade relative to the 1981-2010 average (Fig. 2). On 15 September 2020, the annual minimum Arctic sea ice extent of 3.74 million km2 was reached (Fig. 2). This was the second lowest extent in the satellite record and only the second minimum extent below 4 million km2.
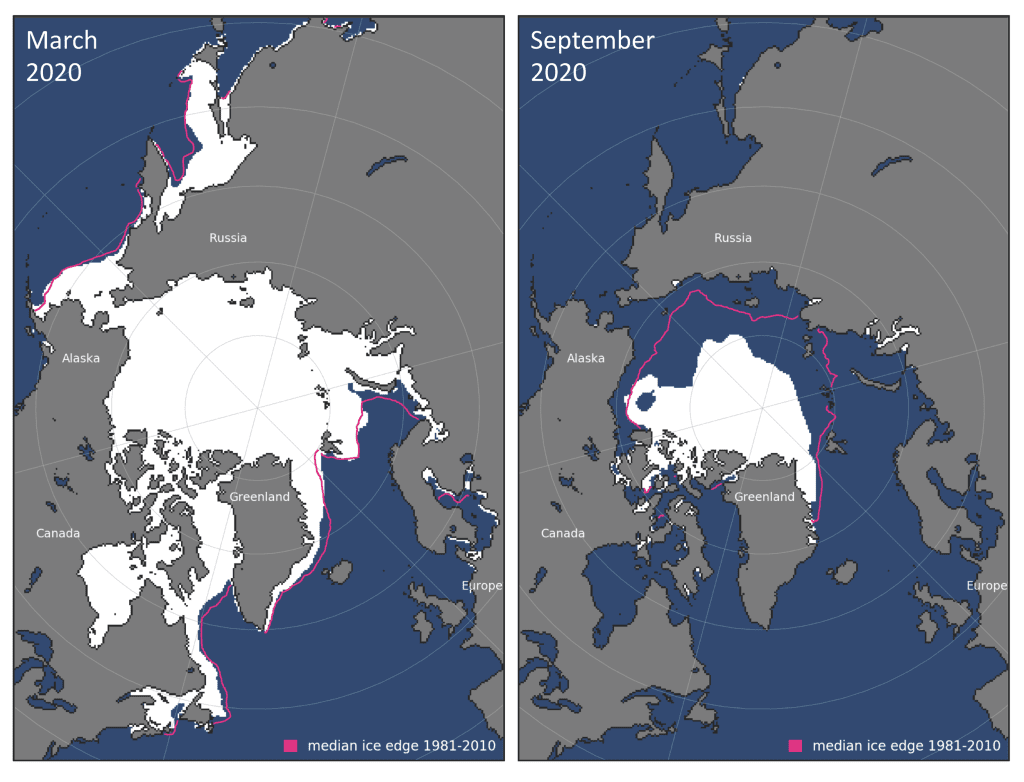

March is the typical month of the maximum annual extent; March 2020 extent was 14.79 million km2 (Fig. 1) and the month has experienced a significant decline of -40,400 km2 (-2.6% per decade) (Fig. 2). On 5 March 2020, the annual maximum sea ice extent was reached, 15.05 million km2, the 11th lowest in the satellite record and the highest since 2013.
The values presented here are from the NSIDC Sea Ice Index (Fetterer et al. 2017), based on passive microwave-derived sea ice concentrations from the NASA Team algorithm (Cavalieri et al. 1996; Maslanik and Stroeve 1999). There are several other passive microwave-derived products (e.g., Ivanova et al. 2014), including the EUMETSAT OSI-SAF CCI climate data record (Lavergne et al. 2019). All products have some limitations and uncertainties (e.g., Kern et al. 2019), but overall the trends agree well (Comiso et al. 2017).
The last 14 years (2007-2020) of the satellite record are the lowest 14 extents in the 42-year satellite record. Fourteen years represents one third of the record, with three such periods in the record. Each of the three 14-year periods show distinct characteristics. The first period, 1979-1992, was marked by a fairly slow decline of -6.9% per decade (relative to the 1981-2010 average climatology). The rate of extent loss accelerated during the second 14-year period, 1993-2006, nearly doubling to -13.3% per decade. The most recent 14-year period has seen the extent loss slow to -4.0% per decade. This number, however, reflects a changed Arctic with consistently low extent throughout the period. The average minimum extents dropped for each period: 6.85 million km2 for 1979-1992, 6.13 million km2 for 1993-2006, and 4.44 million km2 for 2007-2020.
Age of the sea ice
The age of sea ice is also a key descriptor of the state of the sea ice cover. It serves as an indicator for ice physical properties, including snow cover, surface roughness, optical properties, melt pond coverage, salinity, and thickness. Older ice tends to be thicker and thus more resilient to changes in short-term atmospheric and oceanic variations compared to younger ice. The age of the ice is determined using satellite observations and drifting buoy records to track ice parcels over several years (Tschudi et al. 2020). This method has been used to provide a record of the age of the ice since the early 1980s (Tschudi et al. 2019).
The oldest ice (> 4 years old) was once a major component of the Arctic sea ice cover, but now makes up just a small fraction of the March Arctic Ocean ice pack (Fig. 3). In 1985, 33% of the ice pack was very old ice (> 4 years), but by March 2020 old ice only constituted 4.4% of the ice pack within the Arctic Ocean. The total extent of the oldest ice declined from 2.70 million km2 in March 1985 to 0.34 million km2 in March 2020. The March 2020 extent of > 4 year old ice increased from the record-low year in 2019 when it was only 1.2% (0.09 million km2) of the ice cover. This increase was due to 3-4 year old ice surviving a year and aging into > 4 year old ice. The 3-4 year old cover dropped from 6.4% in 2019 to 3.7% in 2020. Overall the percentage of ice 3 years and older was effectively unchanged. Note that these percentages are relative to ice in the Arctic Ocean region (Fig. 3, bottom inset); areas in the peripheral seas outside of this region have little or no older ice and thus do not show any change over time.

Sea ice thickness and volume
Satellite altimetry has enabled the continuous retrieval of sea ice thickness and volume estimates over the entire Arctic basin, starting with the ESA CryoSat-2 radar altimeter, launched in 2010. This was followed in 2018 by the launch of the NASA Ice, Cloud, and land Elevation 2 laser altimeter. Thus, there are now two independent altimetry-based estimates of thickness and volume.
Altimeter measurements have higher relative errors for thin ice because of the achievable precision of the elevation. Using an optimal interpolation scheme, the CryoSat-2 estimates have been combined with thin ice (< 1 m) estimates from the ESA Soil Moisture Ocean Salinity (SMOS) instrument, launched in 2009, to obtain an optimal estimate across thin and thick ice regimes (Ricker et al. 2017). When combined with sea ice concentration, the CryoSat-2/SMOS record of ice thickness is used to indicate variability in sea ice volume.
The time series of sea ice volume from CryoSat-2/SMOS, spanning October 2019 to April 2020, is shown in Fig. 4a relative to the daily range in sea ice volume over the previous nine winters. Northern Hemisphere sea ice volume grew by 14,185 km3 during the winter 2019/20 season, increasing from 5,657 km3 in October 2019 to 19,842 km3 in April 2020. Sea ice volume in winter 2019/20 was consistently below the average of all 10 years. By the end of winter, ice volume in April 2020 was approximately 1,000 km3 (~5%) below the 2010-2019 average and near the lowest volume of the 10 years for April. This record suggests that while September sea ice extent decline has been somewhat slower over the 2010-2019 period, the ice has continued to thin and the low volume during 2019/20 likely helped pre-condition the ice for larger summer extent loss, leading to the second lowest minimum in September 2020.

Sea ice thickness from ICESat-2 (Fig. 4b) also indicates a thinner winter ice cover with an April 2020 mean (modal) thickness of 2.1 m (1.9 m), slightly lower than April 2019. The longer CryoSat-2 record can provide a longer-term context to complement the two years of ICESat-2 data. Both sensors have similar modal thickness and thickness distributions (Fig. 4c) suggesting that two independent instruments can provide consistent but complementary information on thickness.
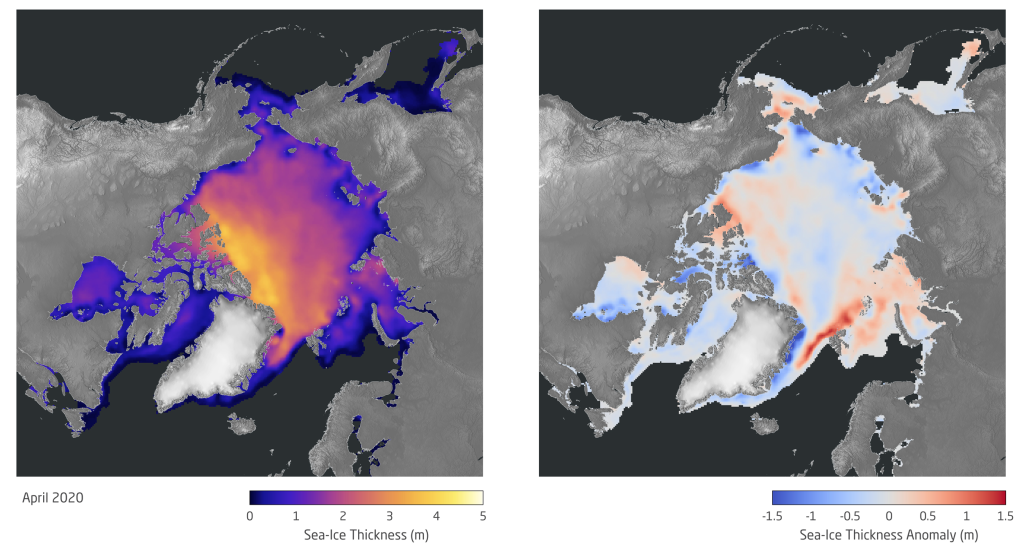
The below-average sea ice volume at the end of winter in April 2020 was driven by wide areas of below-average sea ice thickness in the central Arctic Basin and on the Russian continental shelves (Fig. 5). However, ice thickness in April 2020 was above average in the Beaufort Sea, as well as in the Barents Sea and north of Svalbard (Fig. 5, right side), where the latter was likely caused by an increase in southward advection of thick multiyear sea ice. This advection was observed by the MOSAiC expedition as their drift was more rapid than expected (see essay MOSAiC).
These changes in ice thickness from 2019 are seen particularly in the Fram Strait region, the area between northeast Greenland and Svalbard. Fram Strait is the main exit route for sea ice drifting out of the central Arctic Ocean. Sea ice in Fram Strait has been monitored by the Norwegian Polar Institute since the early 1990s, and trends over the period 1990-2014 show a decrease in both ice thickness and ice volume (Spreen et al. 2020). In August/September 2020, ice drifting through Fram Strait consisted mainly of first-year sea ice, with some sporadic occurrences of older ice. In shallow areas of the shelf east of northeast Greenland, grounded icebergs previously provided conditions well-suited for forming or maintaining multiyear fast ice (e.g., Wang et al. 2020), but in September 2020 few fast ice floes were observed. Sea ice thicknesses in western Fram Strait in August/September 2020 ranged from 1.06 to 3.43 m, with a modal thickness of 1.6 m. Ice thickness in the Fram Strait in August/September 2020 is inferred from 34 direct measurements made on four ice stations, mainly on thicker second year and multiyear ice floes.
Sea ice melt over the spring and summer of 2020 led to volume loss of 15,215 km3, as indicated by the CryoSat-2/SMOS measurements in October 2020, leading to an annual minimum volume of 4,627 km3, the lowest volume in the 10 years of the CryoSat-2/SMOS data record. The spring/summer volume loss was only the second largest loss of sea ice over a melt season (after 2011) due to the low volume at the beginning of the 2020 melt season. Thus, the summer volume loss, record low end-of-summer volume, and the second lowest annual minimum extent marks 2020 as one of the more extreme years in the modern satellite record.
References
Cavalieri, D. J., C. L. Parkinson, P. Gloersen, and H. J. Zwally, 1996 (updated yearly): Sea Ice Concentrations from Nimbus-7 SMMR and DMSP SSM/I-SSMIS Passive Microwave Data, Version 1. NASA National Snow and Ice Data Center Distributed Active Archive Center, Boulder, CO, USA, https://doi.org/10.5067/8GQ8LZQVL0VL.
Comiso, J.C., W.N. Meier, and R. Gersten, 2017. Variability and trends in the Arctic sea ice cover: Results from different techniques. J. Geophys. Res., 122, 6883-6900, https://doi.org/10.1002/2017JC012768.
Fetterer, F., K. Knowles, W. N. Meier, M. Savoie, and A. K. Windnagel, 2017 (updated daily): Sea Ice Index, Version 3. NSIDC: National Snow and Ice Data Center, Boulder, CO, USA, https://doi.org/10.7265/N5K072F8. [Accessed 27 August 2020].
Ivanova, N., O. M. Johannessen, L. T. Pedersen, and R. T. Tonboe, 2014: Retrieval of Arctic sea ice parameters by satellite passive microwave sensors: A comparison of eleven sea ice concentration algorithms. IEEE Trans. Geosci. Rem. Sens., 52(11), 7233-7246, https://doi.org/10.1109/TGRS.2014.2310136.
Kern, S., T. Lavergne, D. Notz, L. T. Pedersen, R. T. Tonboe, R. Saldo, and A. M. Sørensen, 2019: Satellite passive microwave sea-ice concentration data set intercomparison: closed ice and ship-based observations. Cryosphere, 13, 3261-3307, https://doi.org/10.5194/tc-13-3261-2019.
Lavergne, T., and Coauthors, 2019: Version 2 of the EUMETSAT OSI SAF and ESA CCI sea-ice concentration climate data records. Cryosphere, 13, 49-78, https://doi.org/10.5194/tc-13-49-2019.
Maslanik, J., and J. Stroeve, 1999: Near-Real-Time DMSP SSMIS Daily Polar Gridded Sea Ice Concentrations, Version 1. NASA National Snow and Ice Data Center Distributed Active Archive Center, Boulder, CO, USA, https://doi.org/10.5067/U8C09DWVX9LM.
Petty, A. A., N. T. Kurtz, R. Kwok, T. Markus, and T. A. Neumann, 2020: Winter Arctic sea ice thickness from ICESat-2 freeboards. J. Geophys. Res.-Oceans, 125, e2019JC015764, https://doi.org/10.1029/2019JC015764.
Ricker, R., S. Hendricks, L. Kaleschke, X. Tian-Kunze, J. King, and C. Haas, 2017: A weekly Arctic sea-ice thickness data record from merged CryoSat-2 and SMOS satellite data. Cryosphere, 11, 1607-1623, https://doi.org/10.5194/tc-11-1607-2017.
Spreen, G., L. de Steur, D. Divine, S. Gerland, E. Hansen, and R. Kwok, 2020: Arctic sea ice volume export through Fram Strait from 1992 to 2014. J. Geophys. Res.-Oceans, 125, e2019JC016039, https://doi.org/10.1029/2019JC016039.
Tschudi, M. A., W. N. Meier, and J. S. Stewart, 2020: An enhancement to sea ice motion and age products at the National Snow and Ice Data Center (NSIDC). Cryosphere, 14, 1519-1536, https://doi.org/10.5194/tc-14-1519-2020.
Tschudi, M., W. N. Meier, J. S. Stewart, C. Fowler, and J. Maslanik, 2019: EASE-Grid Sea Ice Age, Version 4. NASA National Snow and Ice Data Center Distributed Active Archive Center, Boulder, CO, USA, https://doi.org/10.5067/UTAV7490FEPB.
Wang, C., J. Negrel, S. Gerland, D. V. Divine, P. Dodd, and M. A. Granskog, 2020: Thermodynamics of fast ice off the northeast coast of Greenland (79° N) over a full year (2012-2013). J. Geophys. Res.-Oceans, 125, e2019JC015823, https://doi.org/10.1029/2019JC015823.
Warren, S. G., I. G. Rigor, N. Untersteiner, V. F. Radionov, N. N. Bryazgin, Y. I. Aleksandrov, and R. Colony, 1999: Snow depth on Arctic sea ice. J. Climate, 12, 1814-1829, https://doi.org/10.1175/1520-0442(1999)012<1814:SDOASI>2.0.CO;2.
February 22, 2021