

L. Mudryk1, R. Brown1, C. Derksen1, K. Luojus2, B. Decharme3, S. Helfrich4
1Climate Research Division, Environment and Climate Change Canada, Canada
2Arctic Research Centre, Finnish Meteorological Institute, Finland
3Centre National de Recherches Météorologiques, France
4NOAA/NESDIS Center for Satellite Applications and Research, USA
Highlights
- Snow accumulation during the 2017/18 winter was well above average across the Eurasian Arctic, consistent with an early start to the snow season . North American Arctic snow accumulation was near normal until May and June when what snow remained was generally deeper than usual for the time of year.
- Snow cover extent for Eurasia was above average during April, slightly above average for May, and below average by June (relative to the 1981-2010 average). This month-to-month change is consistent with unusually high early spring accumulation combined with rapid late spring snow loss.
- Despite relatively high spring snow accumulation and snow cover extent over the Arctic during the previous two spring seasons, long-term trends remain negative.
Snow covers the Arctic land surface (land areas north of 60° N) for up to 9 months each year, and influences the surface energy budget, ground thermal regime, and freshwater budget of the Arctic. Snow also interacts with vegetation, affects biogeochemical activity, and influences migration and access to forage for wildlife, with consequences for ecosystems. Previous assessments in the Arctic Report Card using a combination of data from satellites and snow models show that over the past 15 years snow has melted from the land surface earlier in the spring (April, May, June) with a shallower snowpack compared to past decades. Inter-annual variability within these trends is high due to competing influences of temperature and precipitation.
Snow across the Arctic land surface can be characterized using three variables: how much area is covered by snow (snow cover extent – SCE), how long snow continuously remains on the land surface (snow cover duration – SCD), and how much water is stored in solid form by the snowpack (a function of the snow depth and density, commonly expressed as snow water equivalent – SWE).
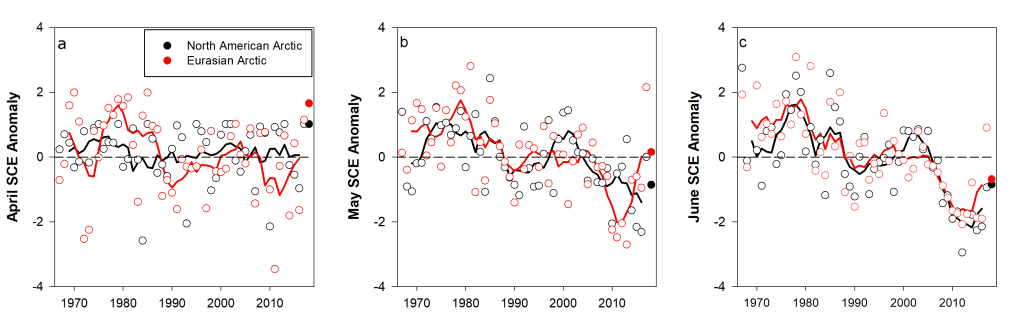
SCE anomalies (relative to the 1981-2010 climatology) for the Arctic in spring 2018 were computed separately for the North American and Eurasian sectors of the Arctic. Anomalies were derived from the NOAA snow chart climate data record, which extends from 1967 to present (maintained at Rutgers University; Estilow et al., 2015; http://climate.rutgers.edu/snowcover/; Fig. 1a-c). Eurasian Arctic spring SCE in 2018 was above average in April, only slightly positive in May, and by June the anomalies were negative with respective to the historical average. SCE anomalies over the North American Arctic were negative for May and June but did not approach the series of record-breaking low SCE values observed in recent years.
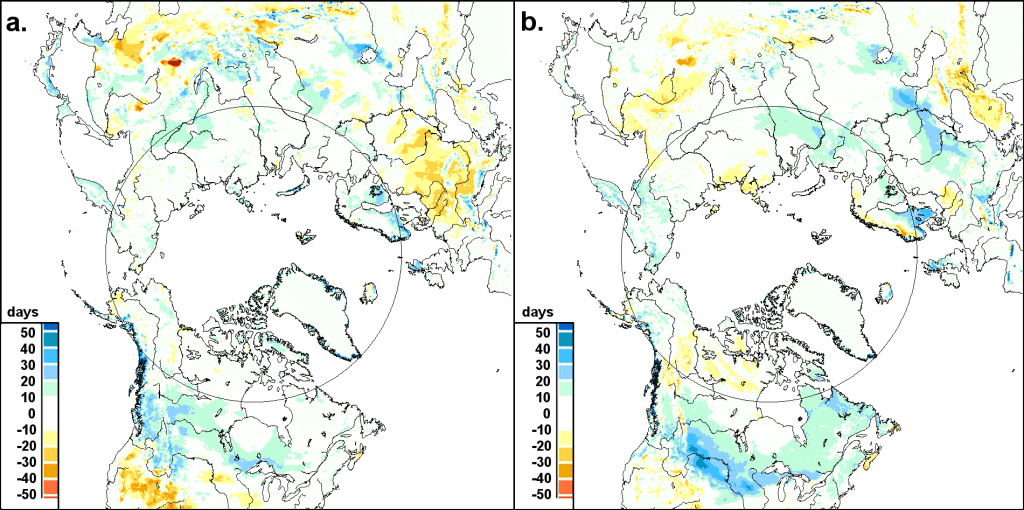
SCD anomalies (Fig. 2) were derived from the NOAA daily Interactive Multisensor Snow and Ice Mapping System (IMS) snow cover product (Helfrich et al., 2007). The IMS data are used to determine SCD due to the increased temporal and spatial resolution of the product. Snow cover onset (Fig. 2a) was normal to slightly earlier than normal over most of the Arctic. Snow-off (Fig. 2b) was slightly later than normal over large regions of Eurasia and over Alaska but slightly earlier over the central Canadian Arctic.
Snow depth anomalies (Fig. 3) were derived from the Canadian Meteorological Centre (CMC) daily gridded global snow depth analysis (Brasnett, 1999). The CMC snow depth product relies on air temperature analyses and precipitation forecasts but also includes assimilation of in situ snow depth observations. This type of product is required to obtain hemispheric estimates of snow depths as in situ observations are too temporally and spatially sparse to be representative. These data indicate that in the 2017/18 snow season, anomalously high snow depths in the Arctic and subarctic boreal zone of Eurasia were established in November 2017 (not shown) and persisted throughout the winter. As a result, April 2018 Eurasian Arctic anomalies averaged 60% above normal and remained above average through June 2018. The North American Arctic saw a mix of positive and negative snow depth anomalies in March and April 2018, but what snow remained by May and June 2018 was generally deeper than average for the time of year.

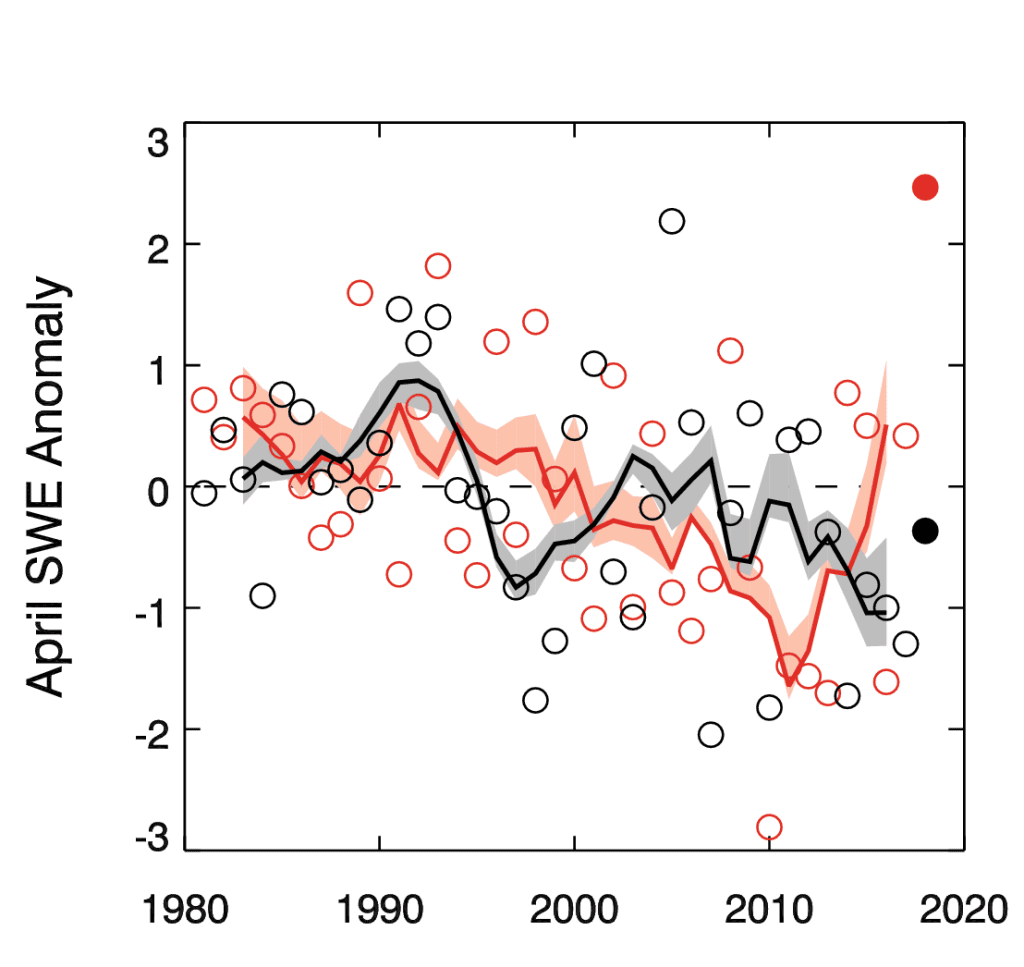
Four products were utilized to generate a multi-dataset SWE anomaly time series (1981-2018) for April (typically the month of maximum SWE across the Arctic; Fig. 4): (1) modern atmospheric reanalysis (The Modern-Era Retrospective Analysis for Research and Applications version 2; MERRA-2; Reichle et al., 2017); (2) reconstructed snow accumulation driven by ERA-interim meteorology with the temperature index model described by Brown et al. (2003); (3) the physical snowpack model Crocus (Brun et al., 2013); and (4) the European Space Agency GlobSnow product derived through a combination of satellite passive microwave data and climate station observations (Takala et al., 2011). As for snow depth, analyses of this type are required to obtain representative gridded estimates of SWE; several products were used in order to characterize their spread. SWE estimates for 2018 indicated the highest amount of SWE since 1981 over the Eurasian Arctic, consistent with the high Arctic snow depth anomalies seen in the CMC analysis. North American Arctic SWE anomalies varied slightly among the products, but on average were close to normal.
In summary, snow accumulation during the 2017/18 winter was well above average across the Eurasian Arctic (Figs. 3 and 4) with the highest level of Eurasian Arctic SWE seen since 1981. This is consistent with an early start to the snow season (and hence a longer period over which accumulation occurred; Fig. 2) and suggests the occurrence of above-average winter snowfall. Snow accumulation over the North American Arctic was close to normal in March and April with remaining regions of anomalously deep snow by May and June. The above average snow accumulation remaining in late spring (May and June) may have contributed to above average river discharge seen over both continents (see essay on River Discharge). During early spring, the above average snow accumulation was also expressed as positive SCE anomalies in April, but snow cover extent reduced quickly during May and June (reflected in the transition to negative SCE anomalies over both North America and Eurasia; Fig. 1). Where snow remained on the ground in these months, it was unusually deep, as indicated by strongly positive snow depth anomalies in the CMC product (Fig. 3).
Despite anomalously high SCE during the 2017 melt season and anomalously high SWE during the 2018 melt season (both primarily observed over the Eurasian continent), long-term trends for both SCE and SWE remain negative. The trends in Arctic SCE over the 1981-2018 period are -0.1%/decade, -3.4%/decade, and -14.9%/decade for April, May, and June, respectively. The April trend in Arctic SWE over the 1981-2018 period is -2.5%/decade, yielding a decrease of about 10% over the entire Arctic since 1981. The loss of spring snow cover in June is approximately the same magnitude as September sea ice extent loss. April SWE trends (near the timing of Arctic SWE maximum) are weaker because they are less sensitive to temperature increases than SCE and more strongly influenced by precipitation trends.
References
Brasnett, B., 1999: A global analysis of snow depth for numerical weather prediction. J. Appl. Meteorol., 38, 726-740.
Brown, R., B. Brasnett, and D. Robinson, 2003: Gridded North American monthly snow depth and snow water equivalent for GCM evaluation. Atmos.-Ocean., 41, 1-14.
Brun, E., V. Vionnet, A. Boone, B. Decharme, Y. Peings, R. Valette, F. Karbou, and S. Morin, 2013: Simulation of Northern Eurasian local snow depth, mass, and density using a detailed snowpack model and meteorological reanalyses. J. Hydrometeorol., 14, 203-219, doi: 10.1175/JHM-D-12-012.1.
Estilow, T. W., A. H. Young, and D. A. Robinson, 2015: A long-term Northern Hemisphere snow cover extent data record for climate studies and monitoring. Earth Syst. Sci. Data, 7, 137-142.
Helfrich, S., D. McNamara, B. Ramsay, T. Baldwin, and T. Kasheta, 2007: Enhancements to, and forthcoming developments in the Interactive Multisensor Snow and Ice Mapping System (IMS). Hydrol. Process., 21, 1576-1586.
Reichle, R., C. Draper, Q. Liu, M. Girotto, S. Mahanama, R. Koster, and G. De Lannoy, 2017: Assessment of MERRA-2 land surface hydrology estimates. J. Clim., 30, 2937-2960, doi: 10.1175/JCLI-D-16-0720.1.
Takala, M., K. Luojus, J. Pulliainen, C. Derksen, J. Lemmetyinen, J. -P. Kärnä, and J. Koskinen, 2011: Estimating northern hemisphere snow water equivalent for climate research through assimilation of space-borne radiometer data and ground-based measurements. Remote Sens. Environ., 115, 3517-3529.
November 28, 2018