
R. M. Holmes1, A. I. Shiklomanov2,3, A. Suslova1, M. Tretiakov3, J. W. McClelland4, R. G. M. Spencer5, S. E. Tank6
1Woods Hole Research Center, Falmouth, MA, USA
2University of New Hampshire, Durham, NH, USA
3Arctic and Antarctic Research Institute, St. Petersburg, Russia
4University of Texas at Austin, Marine Science Institute, Port Aransas, TX, USA
5Florida State University, Tallahassee, FL, USA
6University of Alberta, Edmonton, AB, Canada
Highlights
- In 2018, the combined daily discharge of the six largest Eurasian rivers peaked on June 4, five days earlier than the average over the 1980-89 reference period. The combined daily discharge of the Yukon and Mackenzie rivers peaked on May 29, four days earlier than the average during the reference period.
- In 2018, summer/autumn discharge (July 15-September 30) for the eight largest Arctic rivers was 20% greater than the 1980-89 reference period.
- Since last covered in the Arctic Report Card in 2015, Arctic river discharge has continued to increase, providing powerful evidence for the ongoing intensification of the Arctic hydrologic cycle.
The Arctic Ocean contains only about 1% of global ocean volume but receives greater than 10% of global river discharge (Aagaard and Carmack, 1989; McClelland et al., 2012). Consequently, terrestrial influences via river inputs are much stronger in the Arctic Ocean than in other ocean basins. Rapid change in the Arctic system is altering land-ocean linkages, impacting coastal and ocean physics, chemistry, and biology. Because rivers integrate processes occurring throughout watersheds, changes in the discharge and chemistry of large rivers can also signal widespread terrestrial change (Rawlins et al., 2010; Holmes et al., 2013).
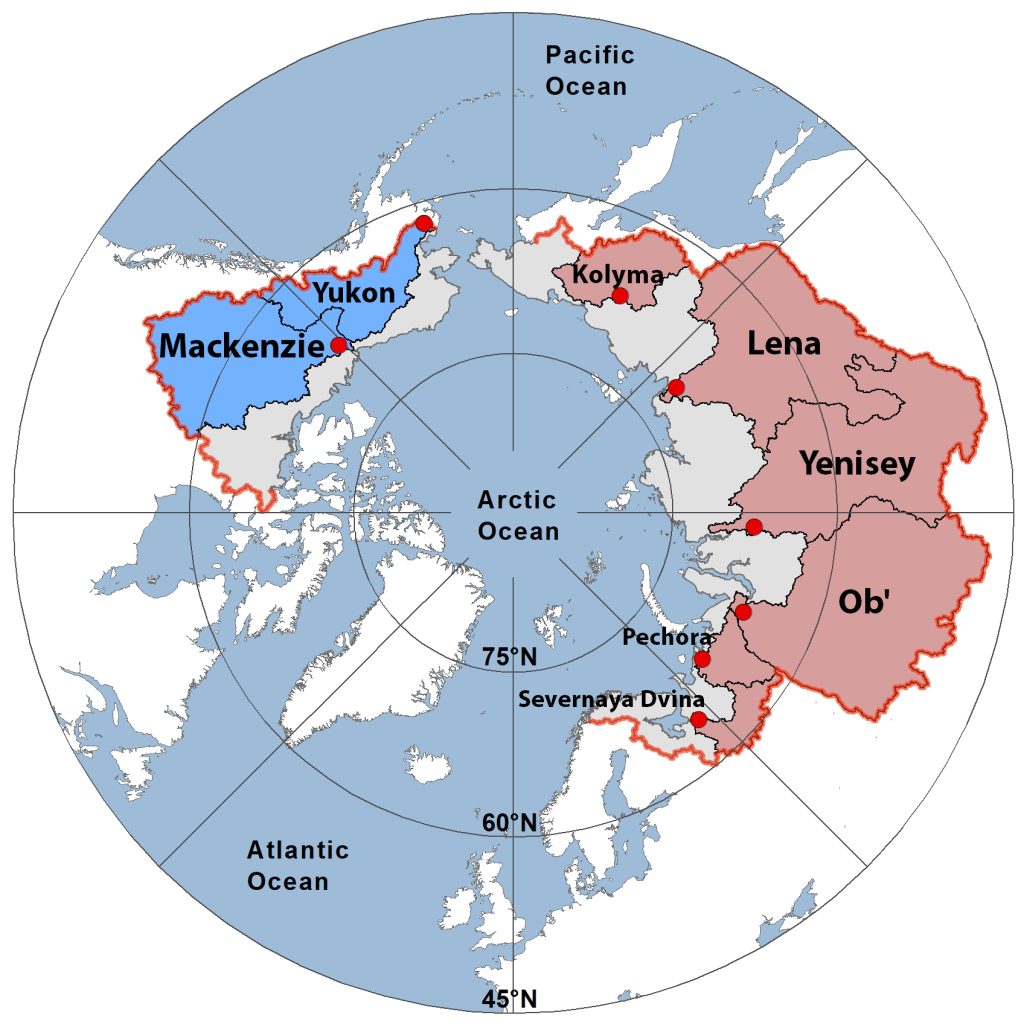
Reported here are river discharge values for the eight largest Arctic rivers, updating the 2015 Arctic Report Card chapter (Holmes et al., 2015). Together, the watersheds of these eight rivers cover approximately two-thirds of pan-Arctic drainage area and account for over 60% of river water inputs to the Arctic Ocean (Fig. 1). Discharge measurements for the six Russian rivers began in 1936, whereas discharge measurements did not begin until 1973 for the Mackenzie River and 1976 for the Yukon River. Thus, we used 1980-89 as a reference period, the first decade with discharge measurements for all eight rivers.
A long-term increase in Arctic river discharge has been well documented (Peterson et al., 2002; McClelland et al., 2006). There is still some uncertainty about what is driving this trend, but documented increases in cold seasons precipitation provide a particularly compelling explanation (Shiklomanov and Lammers, 2009; Overeem and Syvitski, 2010; Rawlins et al., 2010; Déry et al., 2016; Rood et al., 2017). The long-term increasing discharge trend has been greatest for rivers of the Eurasian Arctic and constitutes the strongest evidence of intensification of the Arctic freshwater cycle (Rawlins et al., 2010).
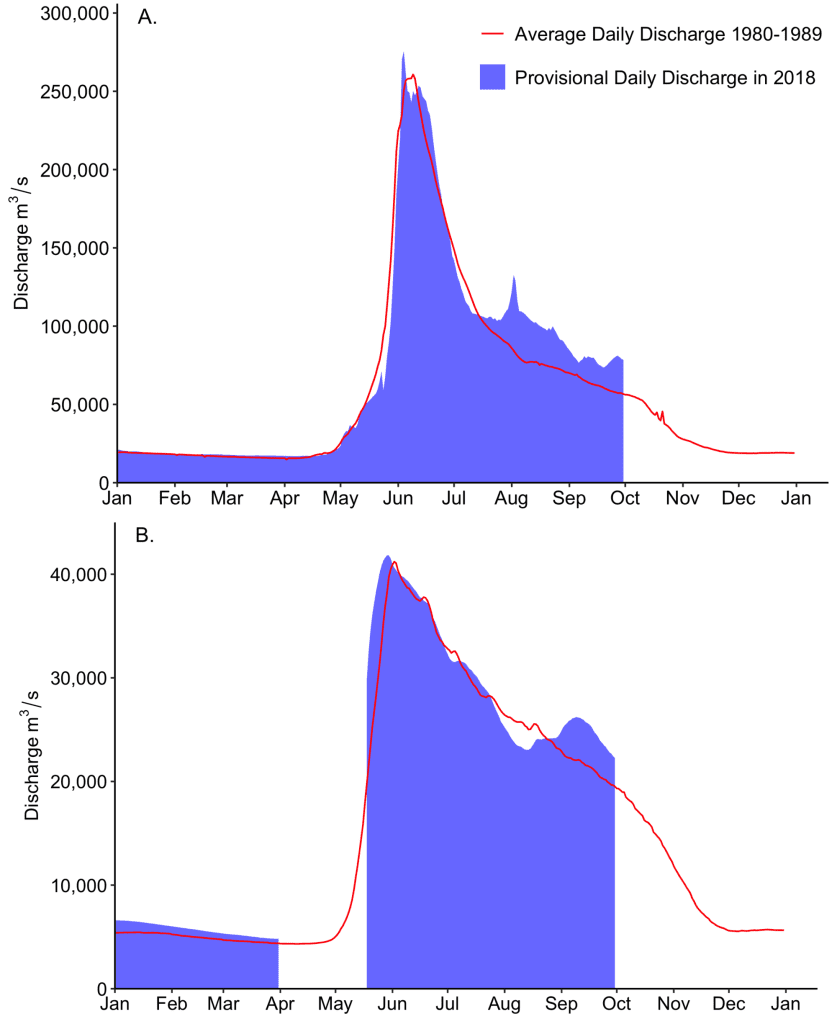
In 2018, the combined daily discharge of the six Eurasian Arctic rivers peaked on June 4, five days earlier than the 1980-89 average (Fig. 2a). For the first nine months of 2018 (January 1-September 30), Eurasian river discharge was 7% greater than the 1980-89 average for the same period (Table 1). Discharge was particularly high in the Eurasian rivers during summer and autumn 2018, with their combined discharge over the period July 15-September 30 being 25% greater than the 1980-89 average for that same period (Fig. 2).
| January – August Discharge (km3) | ||||||||
|---|---|---|---|---|---|---|---|---|
| Pechora | S. Dvina | Ob’ | Yenisey | Lena | Kolyma | Yukon | Mackenzie | |
| 2018 | 82 | 94 | 353 | 502 | 571 | 91 | NA | 241 |
| 1980-89 Average | 94 | 83 | 318 | 503 | 490 | 65 | 169 | 227 |
The combined daily discharge of the Yukon and Mackenzie rivers peaked on May 29, 2018, four days earlier than the 1980-89 average (Fig. 2b). Discharge for the North American rivers from July 15-September 30 was 4% greater than the average over the 1980-89 reference period. When the Eurasian and North American rivers are considered together, their combined discharge in 2018 over the July 15-September 30 period was 20% greater than the average over the 1980-89 reference period.
In 2017, Eurasian Arctic river discharge was 12% greater than the average for the 1980-89 reference period (Table 2). In 2016 and 2015, river discharge was 5% and 15% greater than the 1980-89 average, respectively. In fact, over the past 15 years, Eurasian Arctic river discharge exceeded the long-term average in all but two years, 2003 and 2012 (Fig. 3). Taken together, these results indicate a continuing long-term trend of increasing Eurasian Arctic river discharge.
| Discharge (km3/y) | |||||||||
| Yukon | Mackenzie | Pechora | S. Dvina | Ob’ | Yenisey | Lena | Kolyma | Sum | |
| 2017 | 192 | 290 | 109 | 127 | 446 | 608 | 590 | 108 | 2470 |
| 2016 | 242 | 281 | 87 | 97 | 431 | 530 | 652 | 66 | 2386 |
| 2015 | 213 | 265 | 137 | 80 | 527 | 649 | 585 | 64 | 2520 |
| Average 2010-17 | 213 | 288 | 107 | 98 | 414 | 585 | 596 | 90 | 2391 |
| Average 2000-09 | 206* | 304 | 124 | 103 | 419 | 641 | 590 | 72 | 2459 |
| Average 1990-99 | 216* | 275* | 117 | 111 | 405 | 613 | 532 | 68 | 2337 |
| Average 1980-89 | 205 | 273 | 108 | 100 | 376 | 582 | 549 | 68 | 2261 |
| Average 1970-79 | 183* | 303* | 108 | 94 | 441 | 591 | 529 | 65 | 2314 |
| Average 1960-69 | – | – | 112 | 98 | 376 | 546 | 535 | 73 | – |
| Average 1950-59 | – | – | 110 | 108 | 380 | 566 | 511 | 74 | – |
| Average 1940-49 | – | – | 102 | 100 | 424 | 578 | 498 | 72 | – |
| Average for Period of Record | 206 | 288 | 111 | 100 | 402 | 588 | 542 | 73 | 2310 |
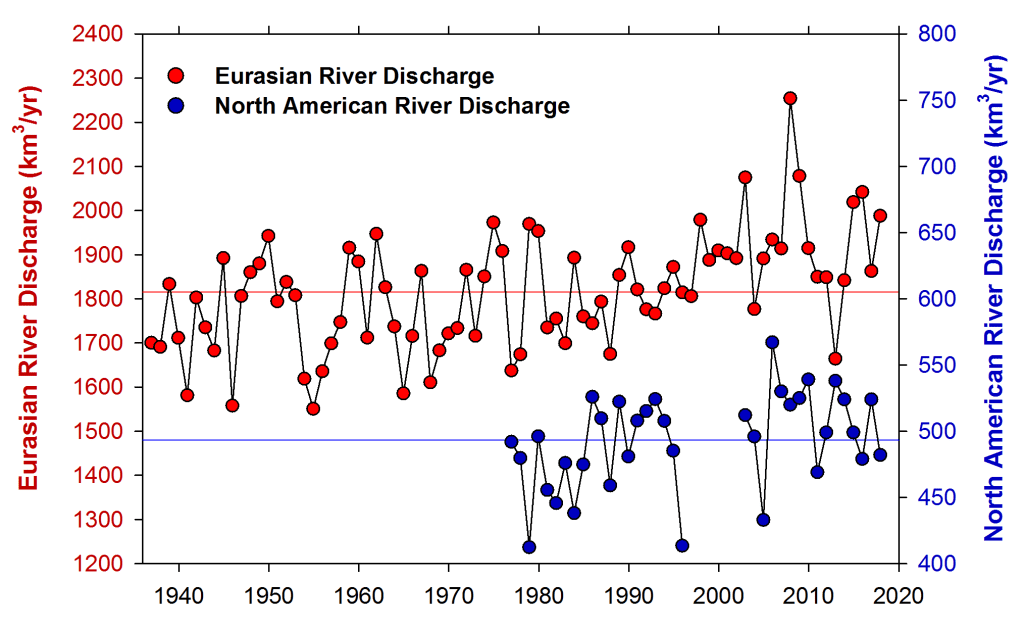
In 2017, the combined discharge of the two largest North American Arctic rivers, the Yukon and Mackenzie, was 482 km3, slightly above the 1980-89 reference period (Table 2). In 2016 the combined discharge of the Yukon and Mackenzie river was 9% greater than the 1980-89 reference period, whereas in 2015 the combined discharge of these two rivers was very similar to the reference period (Table 2). Since 1976, the increase in the combined river discharge has been 3.3±1.6% per decade for the Eurasian rivers and 2.0±1.8% per decade for the North American rivers (Fig. 3; Mann-Kendall trend analysis ±95% confidence interval).
Considering the eight Eurasian and North American Arctic rivers together, their combined discharge in 2017 (2470 km3) was 9% greater than the average discharge for the period 1980-89 (Table 2). Values for 2016 (2387 km3) and 2015 (2521 km3) were 6% and 11% greater than the 1980-89 average, respectively. Overall these results indicate that Arctic river discharge continues to march upwards, providing powerful evidence for the intensification of the Arctic hydrologic cycle.
Acknowledgments
We thank the United States Geological Survey (Yukon), Water Survey of Canada (Mackenzie) and Roshydromet (Severnaya Dvina, Pechora, Ob’, Yenisey, Lena, and Kolyma) for the discharge data used here. Most of these data are now available through the Arctic Great Rivers Observatory (www.arcticgreatrivers.org). This work was supported by grants from the National Science Foundation in support of the Arctic Great Rivers Observatory (NSF 1602615, 1603149, 1602680, 1602879). The processing and analysis of near real time data for Russian Arctic rivers was supported in part by the Russian Foundation for Basic Research (grant 18-05-60192).
References
Aagaard, K., and E. C. Carmack, 1989: The role of sea ice and other fresh water in the Arctic circulation. J. Geophys. Res., 94(C10), 14,485-14,498.
Déry, S. J., T. A. Stadnyk, M. K. MacDonald, and B. Gauli-Sharma, 2016: Recent trends and variability in river discharge across northern Canada. Hydrol. Earth Syst. Sci., 20, 4801-4818, doi: 10.5194/hess-20-4801-2016.
Holmes, R. M., M. T. Coe, G. J. Fiske, T. Gurtovaya, J. W. McClelland, A. I. Shiklomanov, R. G. M. Spencer, S. E. Tank, and A. V. Zhulidov, 2013: Climate change impacts on the hydrology and biogeochemistry of Arctic Rivers, in Global Impacts of Climate Change on Inland Waters. C. R. Goldman, M. Kumagai, and R. D. Robarts, Eds., Wiley, pp. 3-26.
Holmes, R. M., A. I Shiklomanov, S. E. Tank, J. W. McCelland, and M. Tretiakov, 2015: River Discharge [in Arctic Report Card 2015], https://www.arctic.noaa.gov/Report-Card.
McClelland, J. W., S. J. Déry, B. J. Peterson, R. M. Holmes, and E. F. Wood, 2006: A pan-arctic evaluation of changes in river discharge during the latter half of the 20th century. Geophys. Res. Lett., 33, L06715, doi: 06710.01029/02006GL025753.
McClelland, J. W., R. M. Holmes, K. H. Dunton, and R. Macdonald, 2012: The Arctic Ocean estuary. Estuar. Coast., 35, 353-368, doi: 10.1007/s12237-010-9357-3.
Overeem, I., and J. P. M. Syvitski, 2010: Shifting discharge peaks in Arctic rivers, 1977-2007. Geogr. Ann. A, 92, 285-296.
Peterson, B. J., R. M. Holmes, J. W. McClelland, C. J. Vorosmarty, R. B. Lammers, A. I. Shiklomanov, I. A. Shiklomanov, and S. Rahmstorf, 2002: Increasing river discharge to the Arctic Ocean. Science, 298, 2171-2173.
Rawlins, M. A., et al., 2010: Analysis of the arctic system freshwater cycle intensification: Observations and expectations. J. Climate, 23, 5715-5737, doi: 10.1175/2010JCLI3421.1.
Rood, S. B., S. Kaluthota, L. J. Philipsen, N. J. Rood, and K. P. Zanewich, 2017: Increasing discharge from the Mackenzie River system to the Arctic Ocean. Hydrol. Process., 31, 150-160, doi: 10.1002/hyp.10986.
Shiklomanov A. I., and R. B. Lammers, 2009: Record Russian river discharge in 2007 and the limits of analysis. Environ. Res. Lett., 4, 045015, doi: 10.1088/1748-9326/4/4/045015.
November 13, 2018