

G. V. Frost1, M. J. Macander1, U. S. Bhatt2, L. T. Berner3, J. W. Bjerke4, H. E. Epstein5, B. C. Forbes6, S. J. Goetz3, M. J. Lara7,8, G. K. Phoenix9, S. P. Serbin10, H. Tømmervik4, D. A. Walker11, and D. Yang10,12
1Alaska Biological Research, Inc., Fairbanks, AK, USA
2Geophysical Institute, University of Alaska Fairbanks, Fairbanks, AK, USA
3School of Informatics, Computing and Cyber Systems, Northern Arizona University, Flagstaff, AZ, USA
4Norwegian Institute for Nature Research, FRAM – High North Research Centre for Climate and the Environment, Tromsø, Norway
5Department of Environmental Sciences, University of Virginia, Charlottesville, VA, USA
6Arctic Centre, University of Lapland, Rovaniemi, Finland
7Department of Plant Biology, University of Illinois, Urbana, IL, USA
8Department of Geography, University of Illinois, Urbana, IL, USA
9School of Biosciences, University of Sheffield, Sheffield, UK
10Environmental and Climate Sciences Department, Brookhaven National Laboratory, Upton, NY, USA
11Institute of Arctic Biology, University of Alaska Fairbanks, Fairbanks, AK, USA
12Department of Ecology and Evolution, Stony Brook University, Stony Brook, NY, USA
Highlights
- The circumpolar average peak tundra greenness value in 2022 declined from the record high values of the previous two years, but still represented the fourth highest value since 2000.
- Tundra greenness in 2022 was high in most of the North American Arctic, but unusually low in northeastern Siberia, consistent with persistent summer sea-ice in the adjacent Chukchi Sea.
- Wildfires, extreme weather events, and other disturbances have become more frequent, highlighting components of Arctic change that drive increased regional variability in tundra greenness.
Introduction
Earth’s northernmost continental landmasses and island archipelagos are home to the Arctic tundra biome, a 5.1 million km2 region characterized by low-growing, treeless vegetation (CAVM Team 2003). The tundra biome forms a “ring” of cold-adapted vegetation atop the globe, bordered by the Arctic Ocean to the north and the boreal forest biome to the south. The biological, physical, and climatic conditions of Arctic tundra ecosystems are changing profoundly, as vegetation and underlying permafrost soils are strongly influenced by warming air temperatures and the rapid decline of sea ice on the nearby Arctic Ocean (Bhatt et al. 2021; see essays Surface Air Temperature and Sea Ice). In the late 1990s, a sharp increase in the productivity of tundra vegetation became evident in global satellite observations, a phenomenon that has come to be known as “the greening of the Arctic.” Arctic greening is dynamically linked with Earth’s changing climate, permafrost, seasonal snow, and sea-ice cover, and continues to be a subject of multi-disciplinary scientific research.
Satellite observations of tundra greenness
In 2022, the era of spaceborne global vegetation monitoring entered its fifth decade. Global vegetation has been consistently monitored from space since 1982 by the Advanced Very High Resolution Radiometer (AVHRR) onboard NOAA satellites. In 2000, the Moderate Resolution Imaging Spectroradiometer (MODIS) entered the constellation of Earth-observing satellites and provides a more recent record with higher spatial resolution and improved calibration. Both sensors monitor vegetation greenness using the Normalized Difference Vegetation Index (NDVI), a spectral metric that exploits the unique way in which green vegetation absorbs and reflects light in the visible and infrared wavelengths. The AVHRR and MODIS records both indicate that the yearly maximum tundra greenness (MaxNDVI) has increased across most of the circumpolar Arctic during 1982-2021 and 2000-22, respectively (Figs. 1a,b).
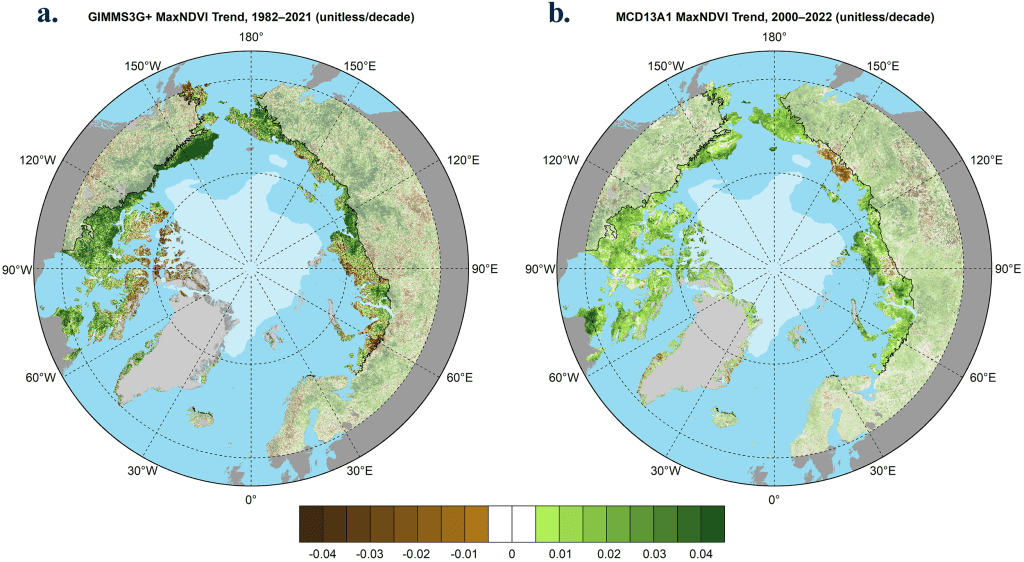
Several tundra regions display particularly strong positive (greening) trends in both records. In North America, greening has been strongest on Alaska’s North Slope and the Canadian mainland. In Eurasia, strong greening has occurred in the Russian Far East (Chukotka), but browning is evident in the East Siberian Sea region and parts of the Taymyr Peninsula. Trends in northwestern Siberia and the European Arctic provide mixed signals of greening and browning across the two satellite records, which may be partly due to their different observational periods. Regional contrasts in greening highlight the complexity of Arctic change, and the rich web of interactions that exist between tundra ecosystems and the local properties of sea ice, permafrost, seasonal snow, soil composition and moisture, disturbance processes, wildlife (see essays Terrestrial Snow Cover, Arctic Pollinators, and Arctic Geese of North America), and human activities (Heijmans et al. 2022; Jorgenson et al. 2022; Macander et al. 2022). Parsing the underlying drivers of complex Arctic trends is an important step toward improved monitoring of tundra ecosystem function (Rogers et al. 2022).
The boreal forest biome (see Figs. 1a,b), which occupies large portions of continental Eurasia and North America north of the Arctic Circle, has also emerged as a focal point of global environmental change. In this region, greenness trends resemble a patchwork quilt, with areas of interspersed greening and “browning” (i.e., productivity decreases) that are closely linked to complex interactions among climate change, wildfire history, pathogens, human land-use, and other factors (Berner and Goetz 2022; Dial et al. 2022).
In 2021—the most recent year with observations from both AVHRR and MODIS—circumpolar mean MaxNDVI for tundra regions declined from the record high values set in 2020 for both satellite records. AVHRR-observed MaxNDVI declined 8.3% from 2020; nonetheless, the 2021 value still exceeded the 1991-2020 mean value and represented the 15th highest value recorded in the full 40-year record (Fig. 2). Notably, the six highest circumpolar average peak greenness values in the long-term AVHRR record (1982-2021) have all been recorded in the last 10 years. The 2020 to 2021 decline in MaxNDVI was less pronounced for MODIS (2.7%), and the 2021 value was the second highest value in the 22-year record for that sensor. Circumpolar MaxNDVI time-series for the two sensors show virtually identical trends for the period of overlap (2000-21), although the AVHRR record displays higher variability, especially over the last 10 years. This is likely due in part to the lower spatial resolution and less advanced calibration of the AVHRR sensor compared to MODIS.

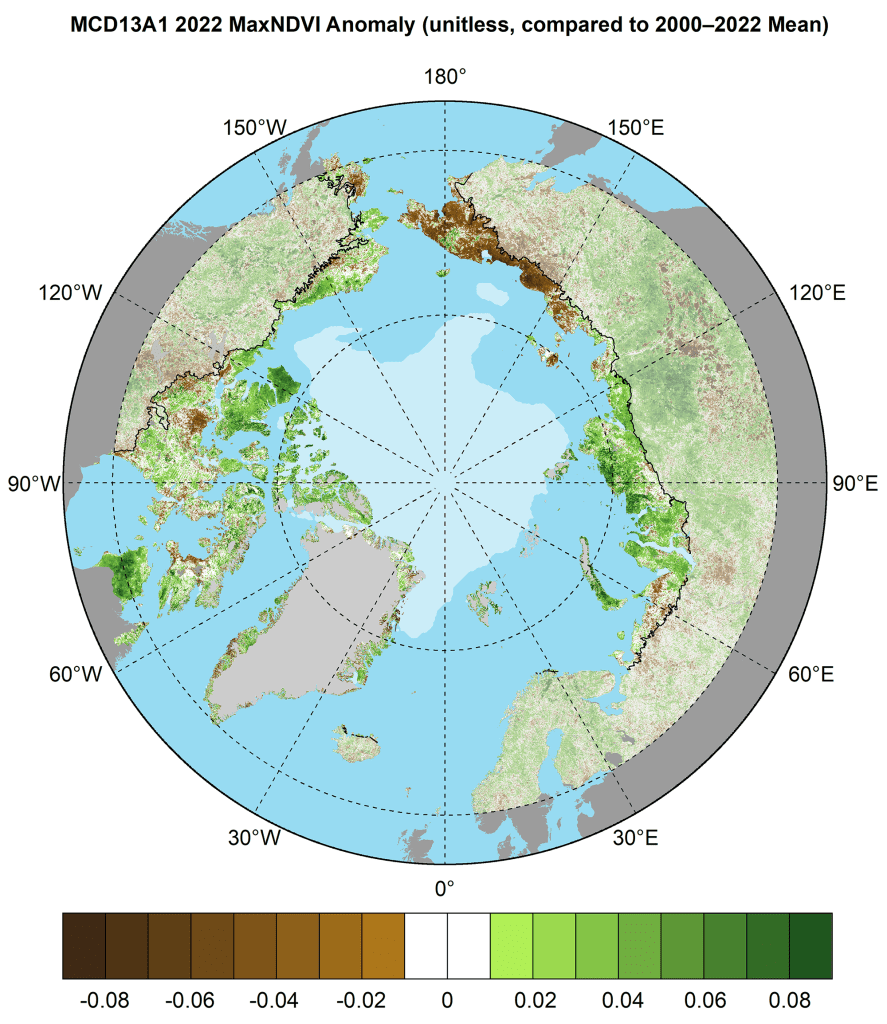
In 2022, the circumpolar MODIS-observed MaxNDVI value declined 0.9% from the previous year, but nonetheless represented the 4th highest value in the 23-year MODIS record and continued a series of exceptionally high values that began in 2020 (Fig. 2). Tundra greenness was relatively high in the Canadian Arctic Archipelago, northern Quebec, and central Siberia, but was strikingly low in northeastern Siberia, which experienced unusually persistent summer sea ice and northerly winds in summer 2022 (Fig. 3; see essays Sea Ice and Surface Air Temperature). The overall trend in MODIS-observed circumpolar MaxNDVI is strongly positive, and circumpolar values have exceeded the 23-year mean in eleven of the last thirteen growing seasons (Fig. 2).
Interpretation of greening trends
What are the drivers that underlie tundra greening trends, and what types of change might an observer see on the ground? Recent low-altitude remote sensing and field-based studies provide detail and context for understanding changes in vegetation and landscape features that contribute to the greenness trends observed by satellites (Magnússon et al. 2022; Yang et al. 2022). Increases in the abundance and height of Arctic shrubs are a key driver of Arctic greening, and have important impacts on biodiversity, surface energy balance, permafrost temperatures, and biogeochemical cycling. However, many Arctic landscapes are a complex mosaic of lakes, ponds, marshes, and upland vegetated terrain, and this heterogeneity presents challenges in quantifying the drivers and impacts of vegetation change and landscape disturbance.
Several Arctic regions experienced widespread disturbance and extreme weather in 2022. For example, western Alaska’s Yukon-Kuskokwim Delta experienced extensive wildfires, continuing a series of years with burned areas far exceeding normal historical conditions. Summer heat waves were prevalent across the European, Asian, Greenland-Iceland, and North American Arctic in 2022 (see essay Surface Air Temperature).
Although the satellite record provides unequivocal evidence of widespread tundra greening, there is substantial regional variability in trends. Some Arctic regions exhibit little or no trend, and a few, such as the East Siberian Sea sector, exhibit widespread browning, which is likely due in part to ground subsidence and increased surface water triggered by permafrost thaw (Magnússon et al. 2022). In addition, areas of tundra greening and browning can be interspersed even within local landscapes. For example, complex mosaics of greening and browning in northwestern Canada are driven by interactions among tundra vegetation, local soil and permafrost conditions, and topography (Seider et al. 2022). While warming is likely to continue to drive Arctic greening, extreme events and other causes of browning are also increasing in frequency (Christensen et al. 2021), highlighting the emergence of increased variability as a component of Arctic climate change.
Methods and data
The satellite record of Arctic tundra greenness began in 1982 using AVHRR, a sensor that collects daily observations and continues to operate onboard polar-orbiting satellites. As of September 2022, however, processed AVHRR data were only available through the 2021 growing season. Therefore, we also report observations from the Moderate Resolution Imaging Spectroradiometer (MODIS), a more modern sensor with improved calibration and spatial resolution that became operational in 2000. The long-term AVHRR dataset analyzed here for 1982-2021 is the Global Inventory Modeling and Mapping Studies 3g V1.2 dataset (GIMMS-3g+), which is based on corrected and calibrated AVHRR data with a spatial resolution of about 8 km (Pinzon and Tucker 2014). For MODIS, we computed tundra greenness trends for 2000-22 at a much higher spatial resolution of 500 m, combining 16-day Vegetation Index products from Terra (MOD13A1, version 6.1) and Aqua (MYD13A1, version 6.1), referred to as MCD13A1. Circumpolar maps depicting greenness trends cover the full Arctic tundra biome (CAVM Team 2003), as well as boreal forests and non-Arctic tundra north of 60° N latitude. For time series plots, data were masked to include only ice-free land within the extent of the Circumpolar Arctic Vegetation Map. MODIS data were further masked to exclude permanent water based on the 2015 MODIS Terra Land Water Mask (MOD44W, version 6). We summarize the GIMMS-3g+ and MODIS records for Maximum NDVI (MaxNDVI), the peak yearly value that is typically observed during the months of July and August.
Acknowledgments
We thank Jorge Pinzon at the Biospheric Sciences Laboratory, NASA Goddard Space Flight Center, for providing updates for the GIMMS-3g+ dataset.
References
Berner, L. T., and S. J. Goetz, 2022: Satellite observations document trends consistent with a boreal forest biome shift. Glob. Change Biol., 28(10), 3275-3292, https://doi.org/10.1111/gcb.16121.
Bhatt, U. S., and Coauthors, 2021: Climate drivers of Arctic tundra variability and change using an indicators framework. Environ. Res. Lett., 16, 055019, https://doi.org/10.1088/1748-9326/abe676.
CAVM Team, 2003: Circumpolar Arctic vegetation map (1:7,500,000 scale). Conservation of Arctic Flora and Fauna (CAFF) Map No. 1 U.S. Fish and Wildlife Service, Anchorage, AK.
Christensen, T. R., and Coauthors, 2021: Multiple ecosystem effects of extreme weather events in the Arctic. Ecosystems, 24, 122-136, https://doi.org/10.1007/s10021-020-00507-6.
Dial, R. J., C. T. Maher, R. E. Hewitt, and P. F. Sullivan, 2022: Sufficient conditions for rapid range expansion of a boreal conifer. Nature, 608, 546-551, https://doi.org/10.1038/s41586-022-05093-2.
Heijmans, M. M. P. D., and Coauthors, 2022: Tundra vegetation change and impacts on permafrost. Nat. Rev. Earth Environ., 3, 68-84, https://doi.org/10.1038/s43017-021-00233-0.
Jorgenson, M. T., and Coauthors, 2022: Rapid transformation of tundra ecosystems from ice-wedge degradation. Global Planet. Change, 216, 103921, https://doi.org/10.1016/j.gloplacha.2022.103921.
Macander, M. J., P. R. Nelson, T. W. Nawrocki, G. V. Frost, K. M. Orndahl, E. C. Palm, A. F. Wells, and S. J. Goetz, 2022: Time-series maps reveal widespread change in plant functional type cover across Arctic and boreal Alaska and Yukon. Environ. Res. Lett., 17, 054042, https://doi.org/10.1088/1748-9326/ac6965.
Magnússon, R. Í., A. Hamm, S. V. Karsanaev, J. Limpens, D. Kleijn, A. Frampton, T. C. Maximov, and M. M. P. D. Heijmans, 2022: Extremely wet summer events enhance permafrost thaw for multiple years in Siberian tundra. Nat. Commun., 13, 1556, https://doi.org/10.1038/s41467-022-29248-x.
Pinzon, J. E., and C. J. Tucker, 2014: A non-stationary 1981-2012 AVHRR NDVI3g time series. Remote Sens., 6, 6929-6960, https://doi.org/10.3390/rs6086929.
Rogers, A., S. P. Serbin, and D. A. Way, 2022: Reducing model uncertainty of climate change impacts on high latitude carbon assimilation. Glob. Change Biol., 28, 1222-1247, https://doi.org/10.1111/gcb.15958.
Seider, J. H., T. C. Lantz, T. Hermosilla, M. A. Wulder, and J. A. Wang, 2022: Biophysical determinants of shifting tundra vegetation productivity in the Beaufort Delta region of Canada. Ecosystems, https://doi.org/10.1007/s10021-021-00725-6.
Yang, D., and Coauthors, 2022: Remote sensing from unoccupied aerial systems: Opportunities to enhance Arctic plant ecology in a changing climate. J. Ecol., https://doi.org/10.1111/1365-2745.13976.
November 21, 2022