T. J. Ballinger1, A. Crawford2, M. C. Serreze3, S. Bigalke4, J. E. Walsh1,5, B. Brettschneider6, R. L. Thoman1,5, U. S. Bhatt7, E. Hanna8, H. Motrøen Gjelten9, S. -J. Kim10, J. E. Overland11, and M. Wang11,12
1International Arctic Research Center, University of Alaska Fairbanks, Fairbanks, AK, USA
2Department of Environment and Geography, University of Manitoba, Winnipeg, MB, Canada
3National Snow and Ice Data Center, Cooperative Institute for Research in Environmental Sciences, University of Colorado Boulder, Boulder, CO, USA
4Department of Geography, Portland State University, Portland, OR, USA
5Alaska Center for Climate Assessment and Policy, University of Alaska Fairbanks, Fairbanks, AK, USA
6National Weather Service Alaska Region, NOAA, Anchorage, AK, USA
7Geophysical Institute, University of Alaska Fairbanks, Fairbanks, AK, USA
8Department of Geography and Lincoln Climate Research Group, University of Lincoln, Lincoln, UK
9Norwegian Meteorological Institute, Oslo, Norway
10Korea Polar Research Institute, Incheon, Republic of Korea
11Pacific Marine Environmental Laboratory, NOAA, Seattle, WA, USA
12Cooperative Institute for Climate, Ocean, and Ecosystem Studies, University of Washington, Seattle, WA, USA
Headlines
- Arctic (60-90° N) annual surface air temperatures for October 2023-September 2024 ranked 2nd warmest since 1900.
- Autumn 2023 and summer 2024 were especially warm across the Arctic with temperatures ranking 2nd and 3rd warmest, respectively.
- An early August 2024 heatwave produced record daily temperature maxima in several northern Alaska and Canada communities.
Overview
Rising surface air and ocean temperatures characterize the changing Arctic (Ballinger et al. 2023; Timmermans and Labe 2023; see essay Sea Surface Temperature). The increase in Arctic (60-90° N) surface air temperature continues to exceed that for the planet as a whole (90° S-90° N), a phenomenon termed Arctic Amplification. Recent studies have shown that, after accounting for natural variability, the Arctic is warming approximately three times faster than the global mean based on observational data and climate model simulations since 1980 (Sweeney et al. 2023; Zhou et al. 2024). There are many documented physical indicators of a warming Arctic. Recent decades have witnessed springtime snow cover declines on Arctic lands (see essay Terrestrial Snow Cover), summer sea ice losses (see essay Sea Ice), and Greenland Ice Sheet mass loss (see essay Greenland Ice Sheet). Extreme events are also becoming more frequent (Overland 2024) and their character is changing over time (e.g., Arctic cold extremes are warming at twice the rate as pan-Arctic annual temperatures since 1979; Polyakov et al. 2024). The warming Arctic has palpable ecological impacts at various spatial scales, which have been documented in past and present Arctic Report Cards; for example, western Alaska salmon (Schoen et al. 2023) and western Arctic caribou (see essay Migratory Tundra Caribou in a Warmer Climate) populations have shown sensitivity to rising temperatures.
As with Surface Air Temperature essays in previous Arctic Report Cards, the sections that follow offer a historical perspective on this past year’s Arctic air temperatures and highlight notable seasonal anomaly patterns and extremes.
Annual and seasonal air temperatures in context
Air temperatures at the annual scale are described in terms of the water year (i.e., October 2023-September 2024 represents 2024). Three-month seasons are therefore referenced as follows: autumn 2023 (October-December), winter (January-March), spring (April-June), and summer (July-September) 2024. These seasons span the annual cycles of the Vital Sign variables consistently described in the Arctic Report Card.
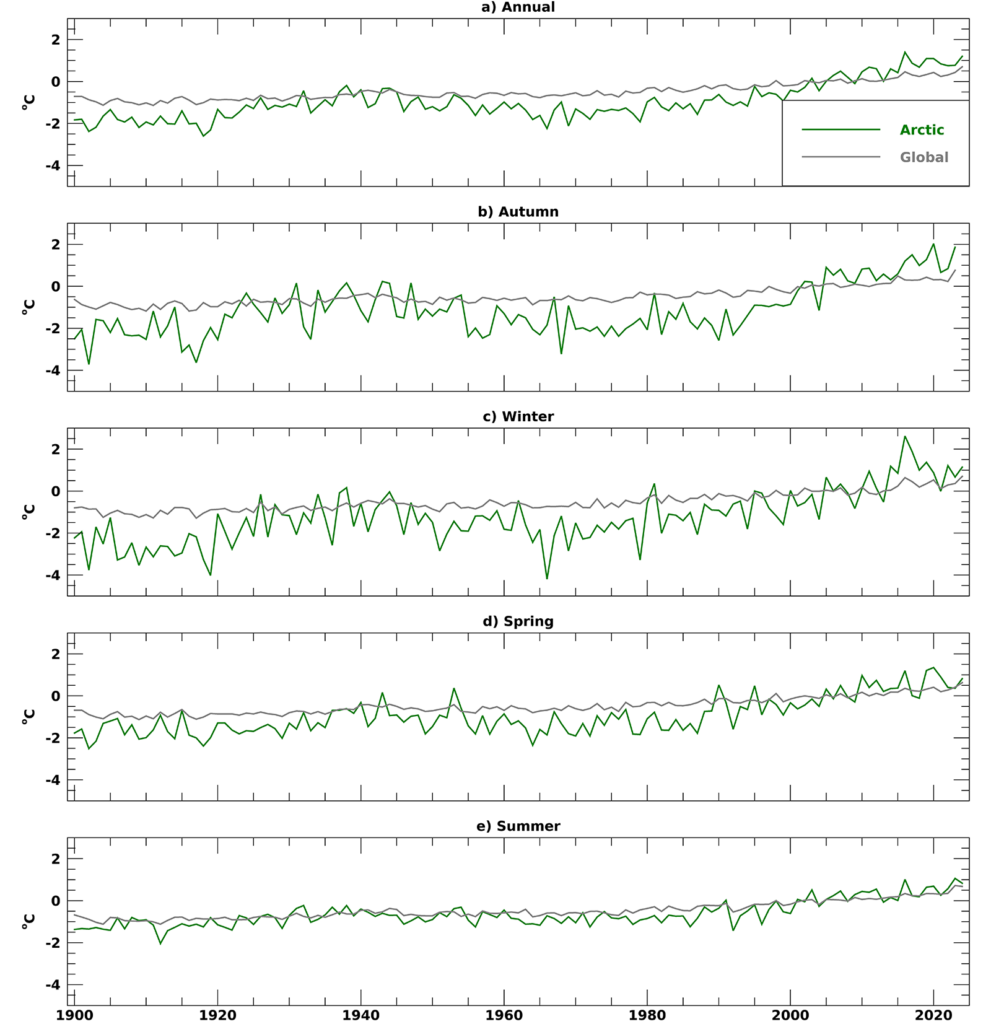
Annual Arctic and global surface air temperature anomalies (i.e., departures from average) from NASA’s GISTEMP version 4 dataset (see Methods and data) are shown in Fig. 1a. This past year was the Arctic’s 2nd warmest on record since 1900 with anomalies of 1.20°C above the 1991-2020 mean. While 2024 is on track to be the warmest year on record globally since at least 1900, Arctic temperature anomalies continue to be larger. This is the 11th consecutive year in which Arctic regional temperature departures exceeded those of the Earth as a whole. This past decade has been the Arctic’s warmest, and has been characterized by several new annual and seasonal records.

Arctic seasonal temperature anomalies were also comparatively higher than the global average (Fig. 1b-d). This is striking given that seasonal global temperature records were also set during autumn 2023, and winter and spring 2024. Seasonal temperature departures were some of the warmest in the Arctic since 1900, with autumn at 1.86°C (2nd warmest), winter at 1.14°C (6th warmest), spring at 0.82°C (6th warmest), and summer at 0.83°C (3rd warmest).
The annual and seasonal air temperature anomalies display a clear and rather consistent depiction of Arctic Amplification (Fig. 1). Several mechanisms and feedbacks underlie Arctic Amplification, and some have seasonally-dependent expressions. Poleward heat and moisture transport driven by weather pattern variability can contribute to warm extremes year-round, whereas albedo feedbacks involving the amount and quality of snow and ice cover are constrained by sunlight that is prevalent in the warm season and absent at the highest northern latitudes during winter months (Cohen et al. 2020). During autumn and winter, when Arctic Amplification is strongest, the accumulation of heat in the Arctic Ocean is released to the overlying atmosphere driving warmer air temperatures (Taylor et al. 2022). Patterns of seasonal air temperature anomalies align with some of these processes responsible for Arctic Amplification.
Seasonal air temperature anomaly patterns
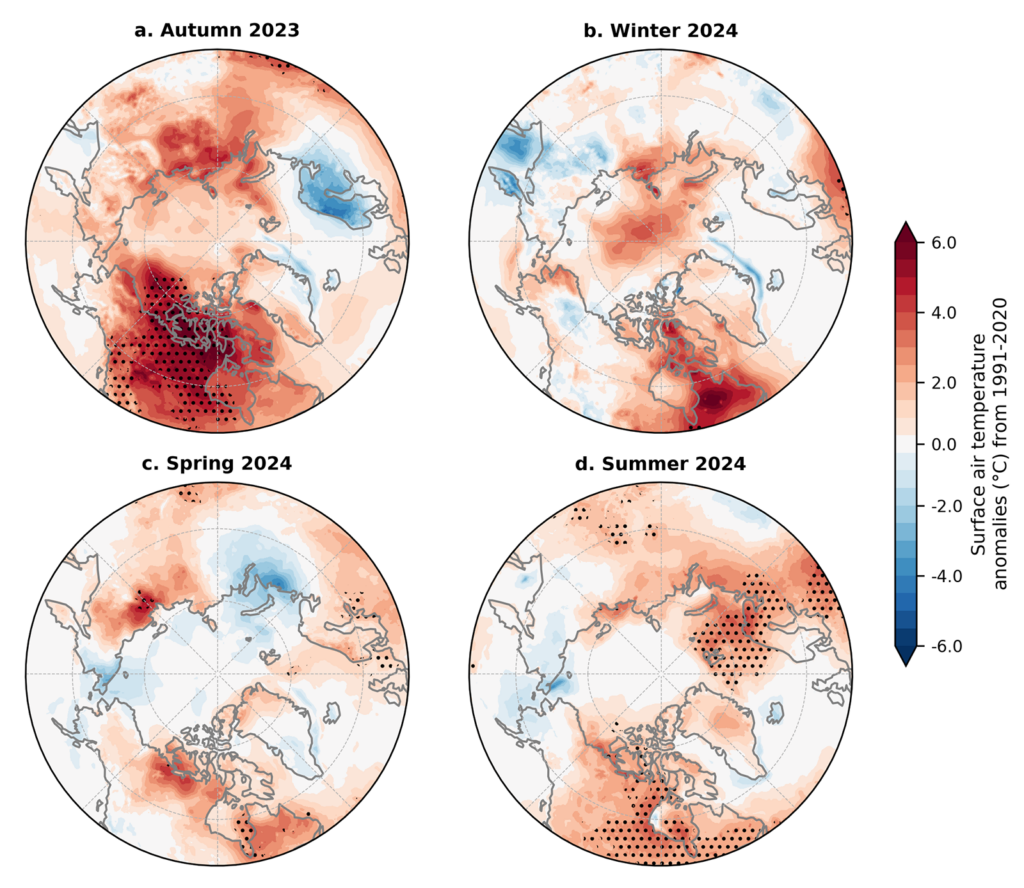
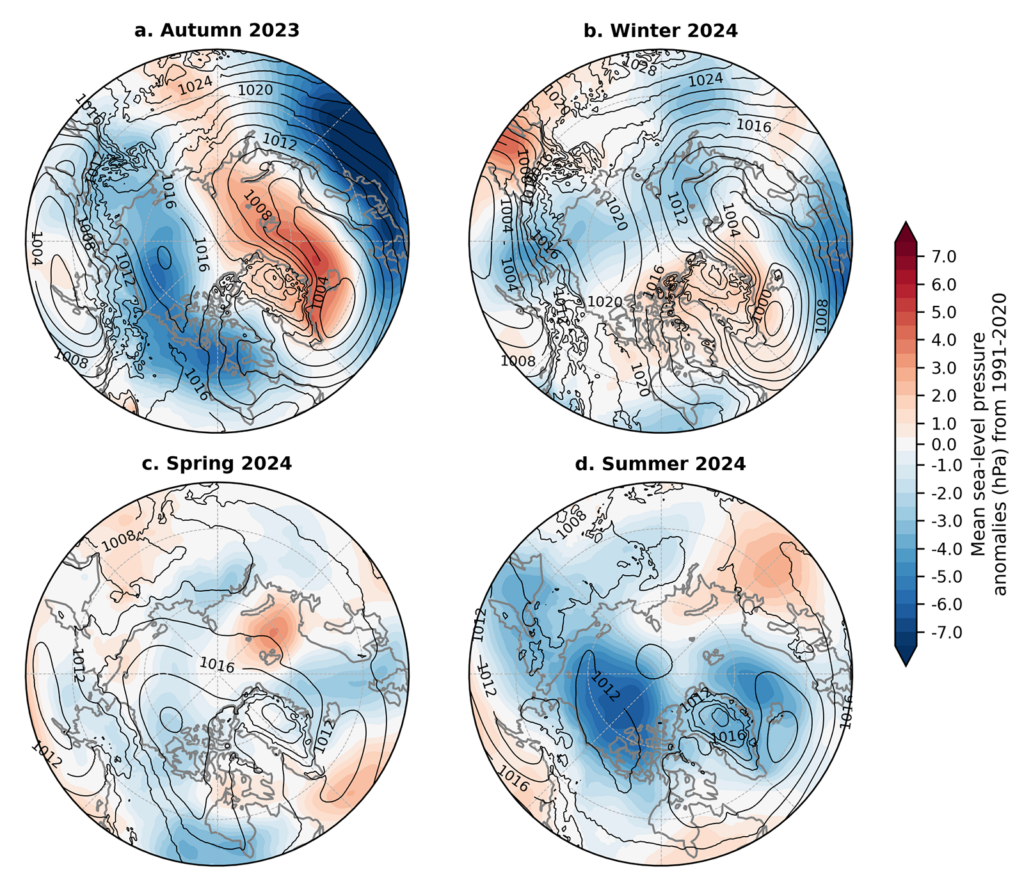
Seasonal air temperature anomaly patterns are shown in Fig. 2. Autumn 2023 was characterized by positive anomalies covering much of the high latitude Eurasian and North American Arctic lands. Of note is a +4-6°C area over much of northern and western Canada, the North Slope of Alaska, and the eastern Beaufort Sea (Fig. 2a). Autumn anomalies of 6°C, representing record high temperatures since 1950, covered much of the Canadian Archipelago and adjacent northern mainland coasts of Nunavut and the Northwest Territories. Below-average sea-level pressure (SLP) prevailed over the North American high latitudes during this time, suggesting more frequent storms produced warm air advection that contributed to the positive anomalies (Fig. 3a). Above-average sea surface temperature and delayed sea ice formation in the Beaufort Sea and Canadian Arctic Archipelago also may have contributed to warmer conditions. This warm pocket in high-latitude North America was punctuated by periods of extremes, including a series of record and above-freezing daily maximum temperatures observed at Clyde River, Baffin Island during 29 November to 3 December (ECCC 2024). Few areas were characterized by negative anomalies with an exception of Scandinavia where -2 to -3°C air temperature anomalies prevailed over much of Norway, Sweden, and Finland along with drier conditions (see essay Precipitation).


Winter 2024 saw positive anomalies over the Central Arctic Ocean (~3-4°C) with smaller magnitude anomalies generally found over Arctic lands (Fig. 2b). Exceptions include the North Slope of Alaska, northern Baffin Island, northern Quebec, and Severnaya Zemlya, where the largest positive anomalies (~5-6°C) occurred. The latter two areas were associated with negative pressure anomalies to the west (Fig. 3b) that enhanced warm air advection from the south. The largest cold anomalies appeared within the Kamchatka Peninsula and the Sea of Okhotsk and relatively small temperature anomalies over Eurasia appear linked to a cold February over the region. Overall, the pan-Arctic temperature pattern in winter shows fewer large warm or cold extremes relative to the preceding autumn.
Spring 2024 featured continued positive anomalies of 2-4°C over northern Canada and eastern Siberia (Fig. 2c). Small negative temperature anomalies extended offshore from the northeastern and northwestern Russian coastlines. In contrast to autumn 2023 and winter 2024, air temperatures over the Arctic Ocean during spring were average to slightly below average, linked to a relatively weak SLP anomaly pattern over the region (Fig. 3c).
Continued warmth across parts of northern Canada and northern Eurasia characterized summer 2024. Record high air temperatures since 1950 were found in Nunavut, northern portions of Manitoba, Ontario, and Quebec, and across much of Hudson Bay where seasonal departures were 2-3°C above the 1991-2020 mean. An early August heat wave produced multiple high temperature records in northern Alaska and the northern Canadian provinces. This included 31.7°C (89°F) at Deadhorse on Alaska’s North Slope and 34.8°C (95°F) in Inuvik, Northwest Territories (Thoman 2024). Notable areas with record temperature anomalies were also found in the eastern Arctic, namely extending from northern Scandinavia and across the Norwegian Sea and Barents Sea to the northern Svalbard coast. A few areas, including the western Chukchi Sea, central Bering Sea, and adjacent lands were marked by negative temperature anomalies associated with an extensive area of lower-than-normal SLP across the western Arctic (Fig. 3d).
Methods and data
The NASA Goddard Institute for Space Studies surface temperature analysis version 4 (GISTEMP v4) is used to describe long-term Arctic (60-90° N) and Global (90° S-90° N) surface air temperatures since 1900 (Fig. 1). GISTEMP v4 air temperatures over lands are obtained from the NOAA Global Historical Climatology Network version 4 (GHCN v4) dataset and ocean surface temperatures are taken from the NOAA Extended Reconstructed Sea Surface Temperature version 5 (ERSST v5) dataset. The GISTEMP product is described in detail in Hansen et al. (2010) and Lenssen et al. (2019).
We use ERA5 reanalysis (Hersbach et al. 2020) two-meter (i.e., surface) air temperature and sea-level pressure fields in Figs. 2 and 3, respectively, to provide spatial context to recent Arctic temporal variability shown in Fig. 1. Temporal comparison of GISTEMP v4 and ERA5 Arctic surface air temperature time series shows minimal interannual differences during the last four decades (Ballinger et al. 2023). All values and fields are presented as anomalies with respect to the 1991-2020 mean.
References
Ballinger, T. J., and Coauthors, 2023: Surface air temperature. Arctic Report Card 2023, R. L. Thoman, T. A. Moon, and M. L. Druckenmiller, Eds., https://doi.org/10.25923/x3ta-6e63.
Cohen, J., and Coauthors, 2020: Divergent consensuses on Arctic amplification influence on midlatitude severe winter weather. Nat. Climate Change, 10, 20-29, https://doi.org/10.1038/s41558-019-0662-y.
ECCC, 2024: Past weather and climate: Historical data. Environment and Climate Change Canada, Station climate IDs 2400800 and 2400802, accessed 4 September 2024, https://climate.weather.gc.ca/historical_data/search_historic_data_e.html.
Hansen, J., R. Ruedy, M. Sato, and K. Lo, 2010: Global surface temperature change. Rev. Geophys., 48, RG4004, https://doi.org/10.1029/2010RG000345.
Hersbach, H., and Coauthors, 2020: The ERA5 global reanalysis. Quart. J. Roy. Meteor. Soc., 146, 1999-2049, https://doi.org/10.1002/qj.3803.
Lenssen, N. J. L., G. A. Schmidt, J. E. Hansen, M. J. Menne, A. Persin, R. Ruedy, and D. Zyss, 2019: Improvements in the GISTEMP uncertainty model. J. Geophys. Res.-Atmos., 124, 6307-6326, https://doi.org/10.1029/2018JD029522.
Overland, J. E., 2024: Emergence of Arctic extremes. Climate, 12, 109, https://doi.org/10.3390/cli12080109.
Polyakov, I. V., T. J. Ballinger, R. Lader, and X. Zhang, 2024: Modulated trends in Arctic surface air temperature extremes as a fingerprint of climate change. J. Climate, 37, 2381-2404, https://doi.org/10.1175/JCLI-D-23-0266.1.
Schoen, E. R., K. G. Howard, J. M. Murphy, D. E. Schindler, P. A. H. Westley, and V. R. von Biela, 2023: Divergent responses of western Alaska salmon to a changing climate. Arctic Report Card 2023, R. L. Thoman, T. A. Moon, and M. L. Druckenmiller, Eds., https://doi.org/10.25923/f2hv-5581.
Sweeney, A. J., Q. Fu, S. Po-Chedley, H. Wang, and M. Wang, 2023: Internal variability increased Arctic amplification during 1980-2022. Geophys. Res. Lett., 50, e2023GL106060, https://doi.org/10.1029/2023GL106060.
Taylor, P. C., and Coauthors, 2022: Process drivers, inter-model spread, and the path forward: A review of amplified Arctic warming. Front. Earth Sci., 9, 758361, https://doi.org/10.3389/feart.2021.758361.
Thoman, R., 2024: Update: August 2024 Arctic Heatwave. Alaska and Arctic Climate Newsletter, https://alaskaclimate.substack.com/p/update-august-2024-arctic-heatwave.
Timmermans, M. -L., and Z. Labe, 2023: Sea surface temperature. Arctic Report Card 2023, R. L. Thoman, T. A. Moon, and M. L. Druckenmiller, Eds., https://doi.org/10.25923/e8jc-f342.
Zhou, W., L. R. Leung, and J. Lu, 2024: Steady threefold Arctic amplification of externally forced warming masked by natural variability. Nat. Geosci., 17, 508-515, https://doi.org/10.1038/s41561-024-01441-1.
November 14, 2024

