K. Poinar1, J. E. Box2, T. L. Mote3, B. D. Loomis4, B. E. Smith5, B. C. Medley4, T. G. Askjaer6, K. D. Mankoff7,8, R. S. Fausto2, and M. Tedesco9
1University at Buffalo, Buffalo, NY, USA
2Geological Survey of Denmark and Greenland, Copenhagen, Denmark
3Department of Geography, University of Georgia, Athens, GA, USA
4Goddard Space Flight Center, NASA, Greenbelt, MD, USA
5University of Washington, Seattle, WA, USA
6Danish Meteorological Institute, Copenhagen, Denmark
7Goddard Institute of Space Studies, NASA, New York, NY, USA
8Autonomic Integra, New York, NY, USA
9Lamont-Doherty Earth Observatory, Columbia Climate School, Columbia University, Palisades, NY, USA
Headlines
- The Greenland Ice Sheet lost 55 ± 35 Gt of mass in 2024, the lowest annual ice loss since 2013. This occurred due to above-average snowfall and below-average melting and despite higher glacier flow rates than the 1991-2020 average.
- Persistent summertime low pressure over southern Greenland and Iceland promoted northerly winds along western Greenland, snowfall, cloudiness, and cool conditions that limited ice melt.
- Flow rates of ice into the ocean in 2024 were substantially above the 1991-2020 average, despite moderate slowing since 2022.
Introduction
The Greenland Ice Sheet contains the equivalent of 7.4 meters of global sea level rise, currently frozen atop the world’s largest island (Morlighem et al. 2017). Ice sheet mass loss affects human and natural environments worldwide through coastal erosion, saltwater intrusion, habitat loss, heightened storm surges, tidal flooding, and permanent inundation. The Greenland Ice Sheet has experienced net-annual mass loss for 27 years running, for every year since 1998 (Poinar et al. 2023). It is currently the second largest contributor to sea-level rise, after ocean water thermal expansion due to warming (Zemp et al. 2019). We summarize the mass changes for the 2024 mass balance year, 1 September 2023 through 31 August 2024, and discuss influential factors.
Ice-sheet mass balance
The Greenland Ice Sheet gains mass chiefly from snow accumulation and loses mass through meltwater runoff and discharge of solid ice into the ocean (i.e., calving icebergs). The sum of these quantities is the ice-sheet mass balance: the net gain or loss of ice, usually summarized over a mass balance year.
From 1 September 2023 to 31 August 2024, the GRACE-FO (Gravity Recovery and Climate Experiment Follow-on) satellite mission measured an ice-sheet mass balance of -55 ± 35 Gt (mean ± 1 st. dev.), the third-lowest amount of annual ice loss in the 23-year GRACE/GRACE-FO observational record (Fig. 1a). The 2002-23 average annual mass balance (September-August) measured by GRACE/GRACE-FO was -266 ± 16 Gt (Fig. 1b). The 2024 mass balance was more than 1 st. dev. above average.
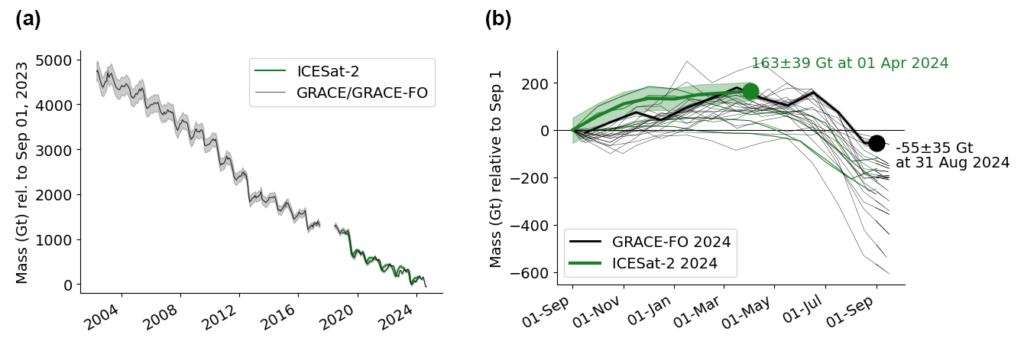
ICESat-2 measures ice-sheet surface height, from which we infer ice-sheet mass balance from 1 September 2023 through 1 April 2024, a 214-day period that ends before the onset of the melt season (Fig. 1b). The ICESat-2 and GRACE-FO mass balances through 1 April 2024 agree within 7 Gt (4%).
Surface mass balance
The sum of snow accumulation and meltwater runoff is termed surface mass balance (SMB) and is primarily responsive to snow accumulation, air temperature, albedo, snow cover, and bare-ice area. We summarize observations that influenced SMB over the 2024 mass balance year and report them relative to the 1991-2020 climatology.
Snow accumulation
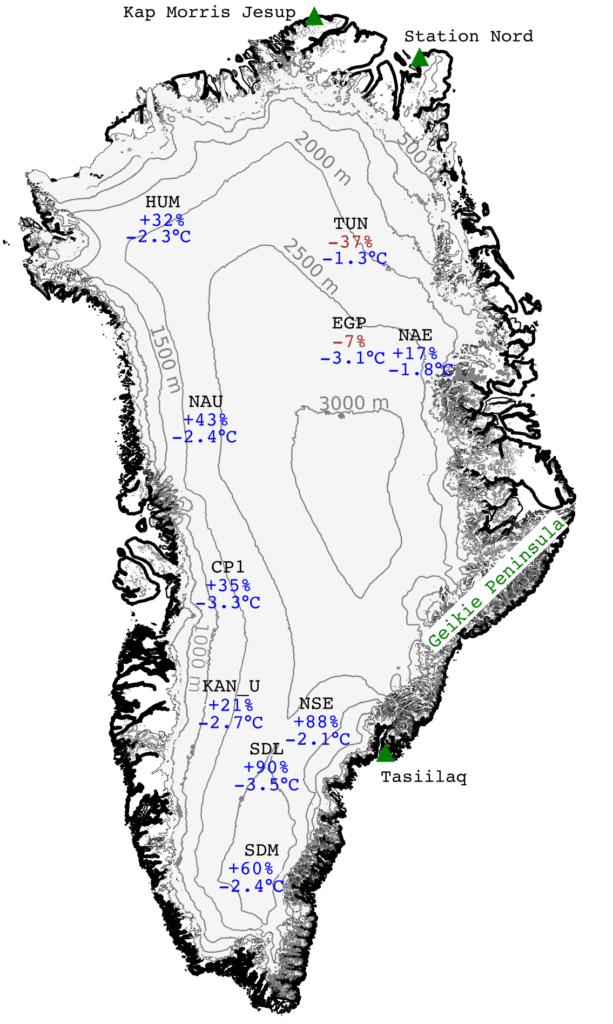
Following Vandecrux et al. (2023), we integrate surface height data observed at ten inland automatic weather stations from September 2023 through June 2024 to estimate snow accumulation up to the start of the melt season (Fig. 2). Above-average pre-melt snow accumulation is evident at eight sites, with the largest positive anomalies observed across the southern ice sheet; below-average snow accumulation was observed only at two northeastern sites. These two sites contrast with coastal observations at Station Nord (location shown in Fig. 2), where the highest winter snowfall was recorded in the period of observations beginning in 1961. In Southeast Greenland, the Tasiilaq station (location shown in Fig. 2) recorded its second-highest snowfall since record-keeping began in 1898.
Temperature
We report monthly mean air temperatures measured at weather stations in Greenland. Air temperatures observed over the 2024 mass balance year were close to the 1991-2020 average, with seasonal and regional variation. During autumn (SON 2023), temperatures were above average; during winter (DJF 2023/24), spring (MAM 2024), and summer (JJA 2024), temperatures were close to or slightly below average at most stations. (Also see close-to-average temperatures reported across Greenland in the essay Surface Air Temperature.) At Kap Morris Jesup station in north Greenland (location shown in Fig. 2), average temperatures were the highest on record in September (+2.2°C anomaly) and December (+3.4°C anomaly).
Albedo and ice melt
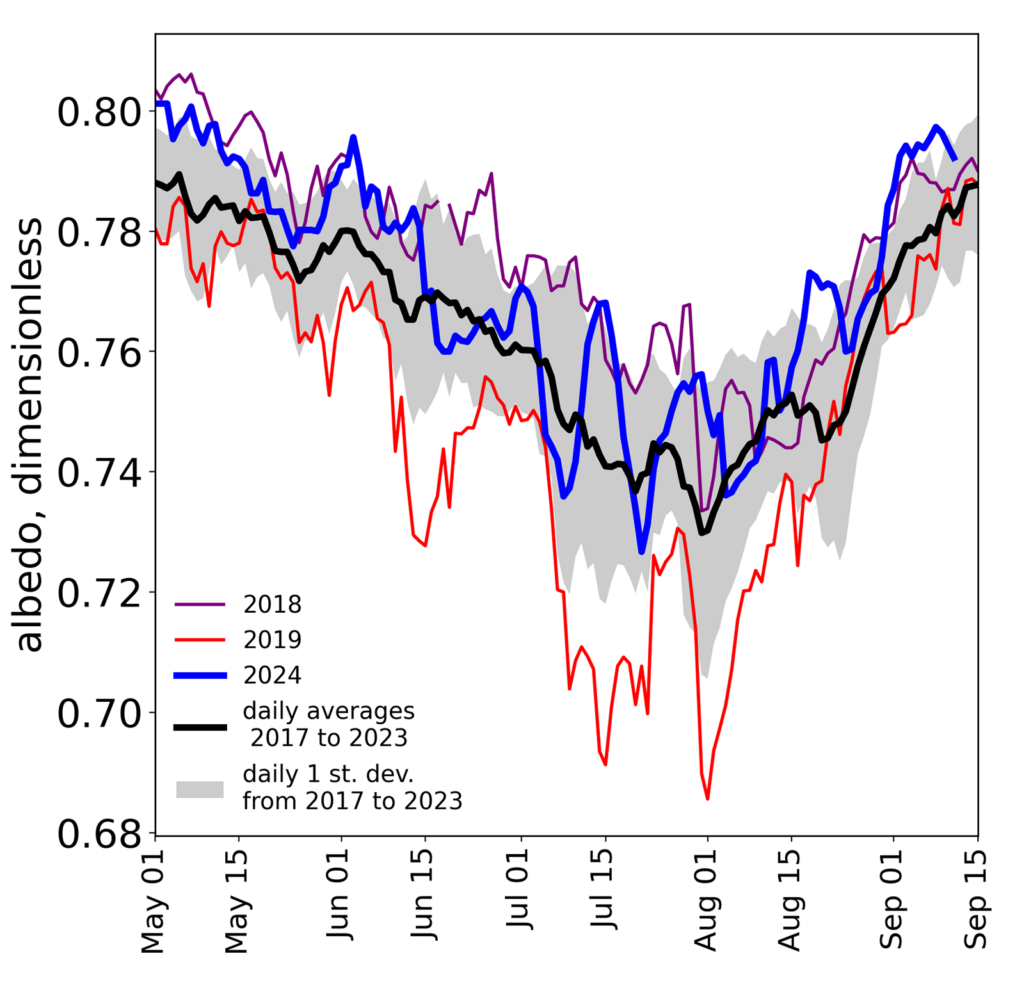
Albedo is a measure of the sunlight reflectivity of a surface. High albedo from snow accumulation therefore helps protect the ice sheet from melting and possible mass loss. The 2024 Greenland snow and ice surface was brighter than average (Fig. 3), largely because of cloudy conditions and precipitation, including snowfall, during the melt season. These conditions occurred in western Greenland in part due to anomalously low atmospheric pressure during much of the melt season (see essay Surface Air Temperature) that induced northerly winds. Through May and early June, snow cover slowed the onset of melt (Fig. 4a), and surface melt extent remained largely below the 1991-2020 mean all summer, with the lowest-melt periods (e.g., late July) coinciding with periods of high albedo (Fig. 3). This corresponded to a below-average number of melt days observed across much of the western ice sheet (Fig. 4b).
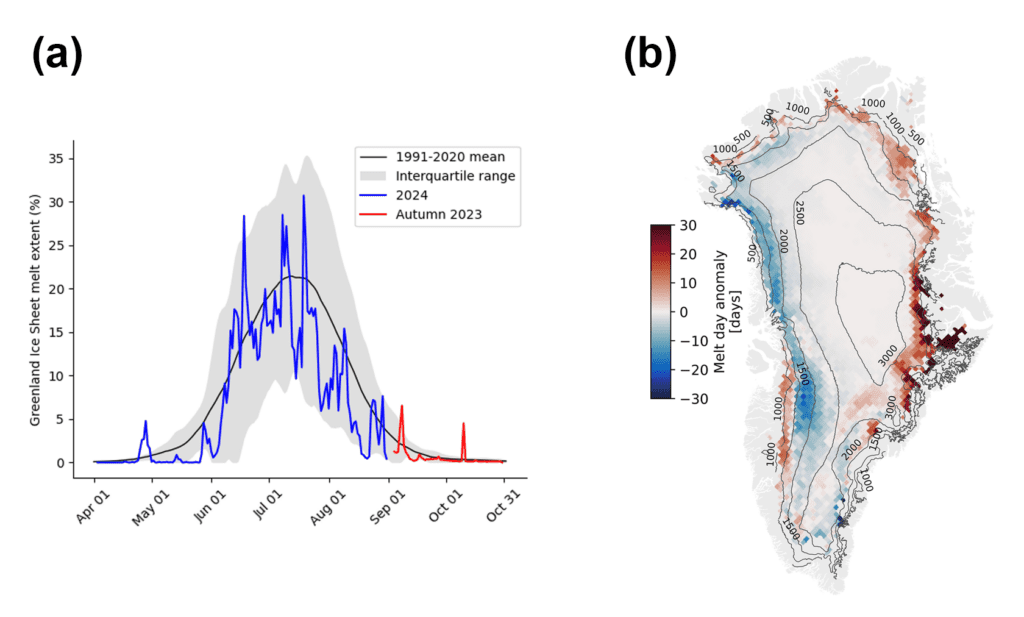
The lower-pressure conditions had a different effect in eastern Greenland, where the 2024 melt season had above-average duration. On the Geikie Peninsula (location shown in Fig. 2), melt-day anomalies as high as +46 days occurred (Fig. 4b). In Southeast Greenland, melt reached substantially farther inland than usual, with areas between 2700 and 3000 m above sea level seeing twice as many melt days as typical.
Solid ice discharge
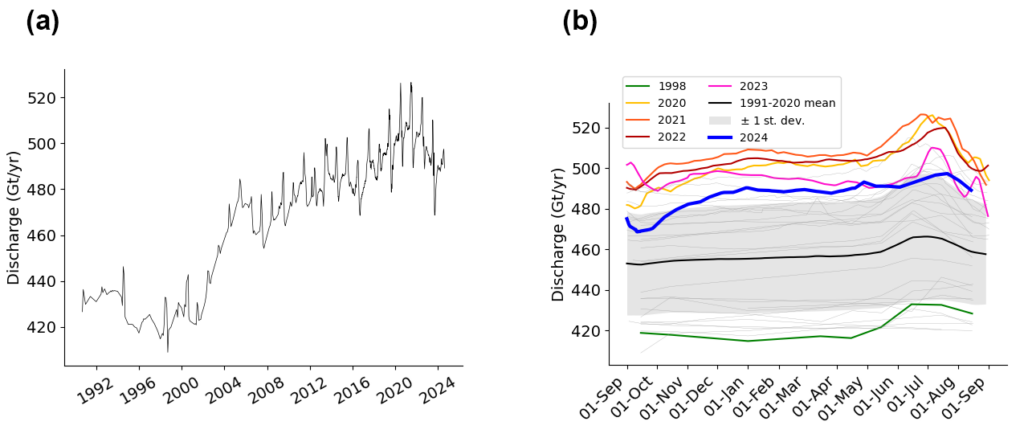
Discharge of solid ice occurs as the hundreds of marine-terminating glaciers that ring the ice sheet export (calve) ice into the ocean; this decreases the ice sheet mass balance. We report an approximation of ice discharge: measurements of ice flux through specific locations near outlet glacier termini distributed across the ice sheet (Mankoff et al. 2020). Discharge typically peaks in July and reaches a minimum in autumn (Fig. 5). In the 2024 mass balance year through 13 August 2024, the mean discharge was 487.3 Gt/yr, approximately 1 st. dev. above the 1991-2020 mean of 458 ± 27 Gt/yr (mean ± 1 st. dev.). Total solid ice discharge at all observation times during the 2024 mass balance year exceeded the 1991-2020 mean. The above-average discharge in 2024 continues an ongoing high-discharge period that began in 2005 and peaked over 2020-21.
Methods and data
The GRACE (Gravity Recovery and Climate Experiment, 2002-17) and GRACE-FO (Follow On, 2018-present) satellite missions detect gravity anomalies to measure changes in total ice mass (GRACE/GRACE-FO Level-2: JPL RL06.1 doi:10.5067/GFL20-MJ061; Technical Notes 13 & 14: https://podaac.jpl.nasa.gov/gravity/gracefo-documentation). We apply a regional averaging kernel (Wahr et al. 1998) to the GRACE/GRACE-FO Level-2 products that is consistent with the JPL and GSFC mascon solutions (Watkins et al. 2015; Loomis et al. 2019). The GRACE/GRACE-FO source data include peripheral glaciers and ice masses that are not part of the Greenland Ice Sheet. We scale these numbers by 0.84 to approximate changes on the ice sheet only (Colgan et al. 2015).
Weather data are obtained from 20 Danish Meteorological Institute (DMI) land-based weather stations with records starting from 1784 (Nuuk), 11 Mittarfeqarfiit stations, and Summit Station (from DMI over 1991-2019 and provided by NOAA GEOSummit since 2019). Temperature and surface ablation measurements come from ten automatic weather station transects from the Programme for Monitoring of the Greenland Ice Sheet (PROMICE) at the Geological Survey of Greenland and Denmark (GEUS), following Van As et al. (2016).
Surface melt duration and extent are derived from daily Special Sensor Microwave Imager/Sounder (SSMIS) 37 GHz horizontally polarized passive microwave radiometer satellite data (Mote 2007). This detects the presence of melt, but not the magnitude of it.
PROMICE combines ice thickness estimates with ice velocity measurements to approximate solid-ice discharge over Greenland (Mankoff et al. 2020). The approximation arises in the areas between the measurement sites and the downstream calving fronts, as the product does not measure accumulation or ablation in these areas, nor does it account for short-term ice front advance or retreat.
Changes in ice surface elevation measured by ICESat-2 reflect ice mass gain or loss as well as changes in density, snow accumulation, and melt. ICESat-2 mass-difference estimates were calculated by correcting ICESat-2 elevation measurements (Smith et al. 2023) for these anomalies (Medley et al. 2022) following the processing strategy for ICESat-2 level-3B products (Smith 2023). The largest error comes from the density, snow accumulation, and melt anomalies, together estimated at 14% of the value (Medley et al. 2022).
Acknowledgments
Sentinel-3 data processing was supported by the European Space Agency (ESA) EO Science for Society contract CCN 4000125043/18/I-NB and the ESA Network of Resources via Polar View and Polar TEP.
References
Colgan, W., and Coauthors, 2015: Hybrid glacier Inventory, Gravimetry and Altimetry (HIGA) mass balance product for Greenland and the Canadian Arctic. Remote Sens. Environ., 168, 24-39, https://doi.org/10.1016/j.rse.2015.06.016.
Loomis, B. D., S. B. Luthcke, and T. J. Sabaka, 2019: Regularization and error characterization of GRACE mascons. J. Geodesy, 93, 1381-1398, https://doi.org/10.1007/s00190-019-01252-y.
Mankoff, K. D., A. Solgaard, W. Colgan, A. P. Ahlstrøm, S. A. Khan, and R. S. Fausto, 2020: Greenland ice sheet solid ice discharge from 1986 through March 2020. Earth Syst. Sci. Data, 12, 1367-1383, https://doi.org/10.5194/essd-12-1367-2020.
Medley, B., T. A. Neumann, H. J. Zwally, B. E. Smith, and C. M. Stevens, 2022: Simulations of firn processes over the Greenland and Antarctic ice sheets: 1980-2021. Cryosphere, 16, 3971-4011, https://doi.org/10.5194/tc-16-3971-2022.
Morlighem, M., and Coauthors, 2017: BedMachine v3: Complete bed topography and ocean bathymetry mapping of Greenland from multibeam echo sounding combined with mass conservation. Geophys. Res. Lett., 44(21), 11051-11061, https://doi.org/10.1002/2017GL074954.
Mote, T. L., 2007: Greenland surface melt trends 1973-2007: Evidence of a large increase in 2007. Geophys. Res. Lett., 34(22), L22507, https://doi.org/10.1029/2007GL031976.
Poinar, K., and Coauthors, 2023: Greenland Ice Sheet. Arctic Report Card 2023, R. L. Thoman, T. A. Moon, and M. L. Druckenmiller, Eds., https://doi.org/10.25923/yetx-rs76.
Smith, B., 2023: Algorithm Theoretical Basis Document (ATBD) for Land-ice DEM (ATL14) and Land-ice height change (ATL15). NASA Goddard Space Flight Center, https://nsidc.org/sites/default/files/documents/technical-reference/icesat2_atl14_atl15_atbd_v003.pdf.
Smith, B., S. Dickinson, B. P. Jelley, T. A. Neumann, D. Hancock, J. Lee, and K. Harbeck, 2023: ATLAS/ICESat-2 L3B Slope-Corrected Land Ice Height Time Series, Version 6 [Data Set]. NASA National Snow and Ice Data Center Distributed Active Archive Center, Boulder, CO, USA, accessed: 25 August 2024, https://doi.org/10.5067/ATLAS/ATL11.006.
van As, D., R. S. Fausto, J. Cappelen, R. S. W. van de Wal, R. J. Braithwaite, H. Machguth, and PROMICE project team, 2016: Placing Greenland ice sheet ablation measurements in a multi-decadal context. GEUS Bull., 35, 71-74, https://doi.org/10.34194/geusb.v35.4942.
Vandecrux, B., and Coauthors, 2023: The historical Greenland Climate Network (GC-Net) curated and augmented level-1 dataset. Earth Syst. Sci. Data, 15, 5467-5489, https://doi.org/10.5194/essd-15-5467-2023.
Wahr, J., M. Molenaar, and F. Bryan, 1998: Time variability of the Earth’s gravity field: Hydrological and oceanic effects and their possible detection using GRACE. J. Geophys. Res., 103(B12), 30205-30229, https://doi.org/10.1029/98JB02844.
Watkins, M. M., D. N. Wiese, D. N. Yuan, C. Boening, and F. W. Landerer, 2015: Improved methods for observing Earth’s time variable mass distribution with GRACE using spherical cap mascons. J. Geophys. Res.-Sol. Ea., 120(4), 2648–2671, https://doi.org/10.1002/2014JB011547.
Zemp, M., and Coauthors, 2019: Global glacier mass changes and their contributions to sea-level rise from 1961 to 2016. Nature, 568, 382-386, https://doi.org/10.1038/s41586-019-1071-0.
November 15, 2024

