M. C. Serreze1, S. Bigalke2, R. Lader3, A. Crawford4, and T. J. Ballinger3
1National Snow and Ice Data Center, Cooperative Institute for Research in Environmental Sciences, University of Colorado Boulder, Boulder, CO, USA
2Department of Geography, Portland State University, Portland, OR, USA
3International Arctic Research Center, University of Alaska Fairbanks, Fairbanks, AK, USA
4Department of Environment and Geography, University of Manitoba, Winnipeg, MB, Canada
Headlines
- Summer (July-September) 2024 precipitation averaged across the pan-Arctic (poleward of 60° N) was at a record high.
- During 1950 through 2024, annual Arctic precipitation has increased, and the increase is most pronounced in winter.
- During October-December 2023 there was below-average precipitation over the East Greenland and Barents Seas and above-average precipitation extending from the U.K. eastward into Eurasia.
Introduction
Patterns of Arctic precipitation vary strongly both regionally and seasonally, with very dry (even polar desert conditions) over much of the Canadian Arctic Archipelago and central Arctic Ocean contrasting with much wetter conditions over the Atlantic side of the Arctic. Locally, precipitation is strongly boosted by forced uplift of air masses by orography (orographic precipitation). Interannual variability in Arctic precipitation relates to variations in the passage of cyclones and their warm and cold fronts, as well as convective precipitation, which is caused by rising warm, moist air and mostly restricted to land areas in summer when there is strong surface heating but can also occur over the ice-free ocean in some circumstances. Reflecting such variability, the October 2023-September 2024 water year for the Arctic region poleward of 60° N was characterized by large regional anomalies in precipitation, notably in autumn and summer. During 1950-2024, pan-Arctic precipitation exhibits an upward trend in annual means, and is seasonally most pronounced for autumn and winter. In this essay, water year seasons are defined as autumn (October-December), winter (January-March), spring (April-June), and summer (July-September).
Precipitation at a glance
The prominent features of the 2023/24 water year were: 1) large positive precipitation anomalies in autumn over the Alaska panhandle and from the U.K. extending eastward across Europe, paired with negative anomalies over the East Greenland and Barents Seas; 2) a band of heavy precipitation events in winter extending north from the Gulf of Alaska, across eastern Alaska and into the East Siberian Sea; and 3) summer dryness over large parts of the Eurasian and North American continents, but with wet conditions over central and northern Alaska and Scandinavia. Overall, pan-Arctic (north of 60° N) precipitation for the 2023/24 water year in the ERA5 reanalysis was the 11th highest over the 1950 to 2024 record. Corresponding ranks for autumn, winter, spring, and summer are 17th, 17th, 20th and 1st.
Figure 1 shows seasonal precipitation totals derived from ERA5 during the 2023/24 water year expressed as anomalies with respect to the 1991-2020 means. A notable feature of autumn is the especially wet conditions over the Alaska panhandle, pointing to orographic uplift. Another interesting feature is a dipole pattern, pairing positive precipitation anomalies from the U.K. to southern Norway with negative anomalies extending from the East Greenland Sea into the Norwegian and Barents Seas. The origins of this pattern are two-fold. First, the main center of extratropical cyclone formation was shifted to the south and east, lying over the North Sea and Scandinavia instead of around Iceland. Second, storms that did form around Iceland were steered almost due east (instead of the more normal northeast), striking northern Europe instead of the Norwegian and Barents Seas. Elsewhere, autumn anomalies were generally small, except for a wet area southeast of Greenland.

As was the case for the 2022/23 water year, winter precipitation anomalies were generally weak for 2023/24. One exception was sharply below average precipitation over the Alaska panhandle, a strong reversal from the situation in this area for autumn. Spring was also characterized by generally modest precipitation anomalies.
As noted above, for the region poleward of 60° N, summer (July-September) of 2024 was the wettest on record. This is largely due to above average precipitation over interior Alaska, the Canadian Arctic Archipelago, northern Scandinavia and the Barents Sea. However, precipitation was below average over northwestern Eurasia, parts of Canada south of the Archipelago, and the northern North Atlantic.
Heavy precipitation events
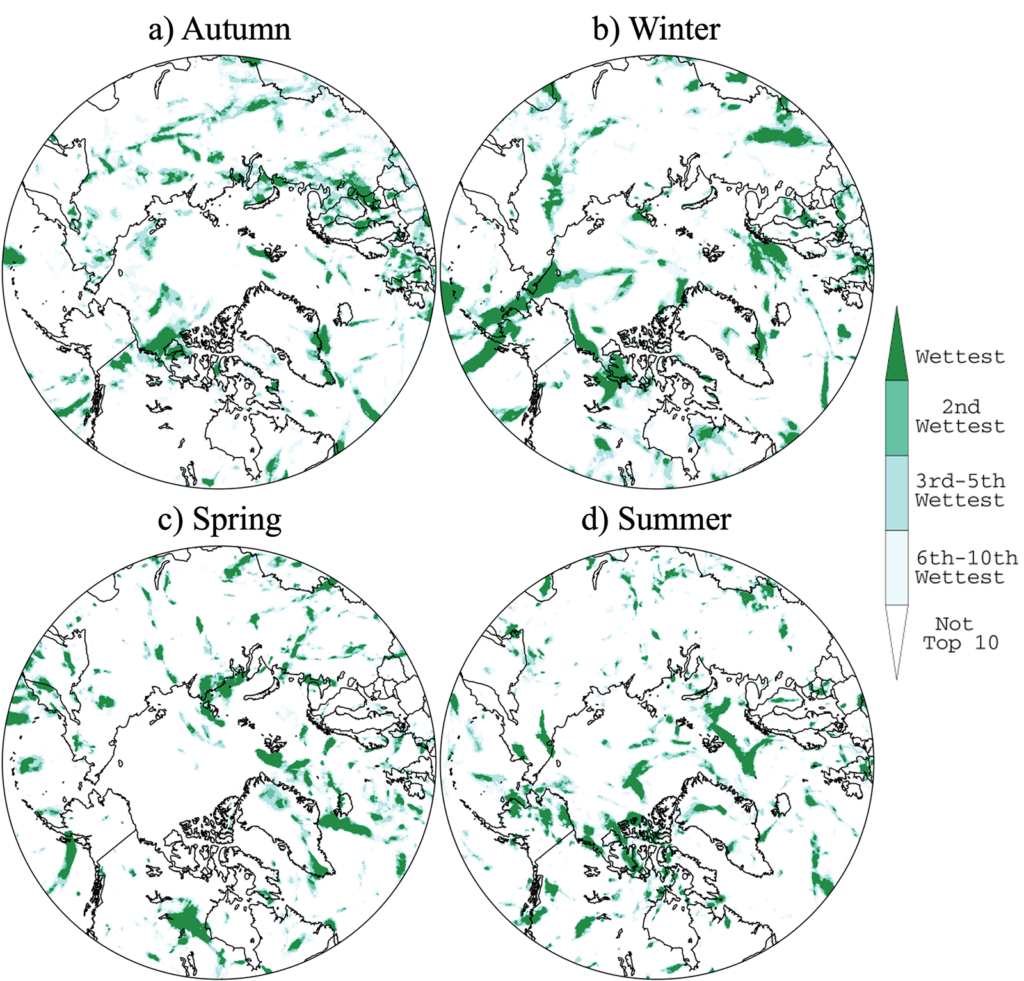
For any given year, there is a statistical expectation of regionally heavy precipitation events that can approach or exceed previous records, even in a stable climate. Following the approach of previous Arctic Report Cards, Fig. 2 plots heavy precipitation events during the 2023/24 water year in terms of ranks of the maximum 5-day precipitation events (Rx5) in each season (relative to the 1950-2023 baseline). Generally, heavy precipitation events are scattered across the Arctic in all four seasons with no coherent pattern. The one feature of note is the band of heavy precipitation events in winter stretching northward from south of the Aleutians across eastern Alaska into the East Siberian Sea, which is aligned with warmer-than-average conditions (see Fig. 2b in essay Surface Air Temperature). There were heavy precipitation events from western and northern Alaska to the Canadian Arctic Archipelago in summer, particularly during August.

Historical perspective
Simulations from climate models are in strong agreement that the Arctic region should see an increase in precipitation due to higher atmospheric water vapor content as the climate warms, facilitating increased moisture transport from lower latitudes. While an upward trend in annual precipitation is now detectable (Box et al. 2021; Walsh et al. 2022a), there is considerable interannual and multiyear variability and large variations in regional trends (Ye et al. 2021; Yu and Zhong 2021). There is also evidence of a transition from solid to liquid precipitation in the warmer parts of the Arctic (Box et al. 2021), although the coldest areas of the Arctic are expected to see snowfall increases in the future (McCrystall et al. 2021; Bigalke and Walsh 2022).
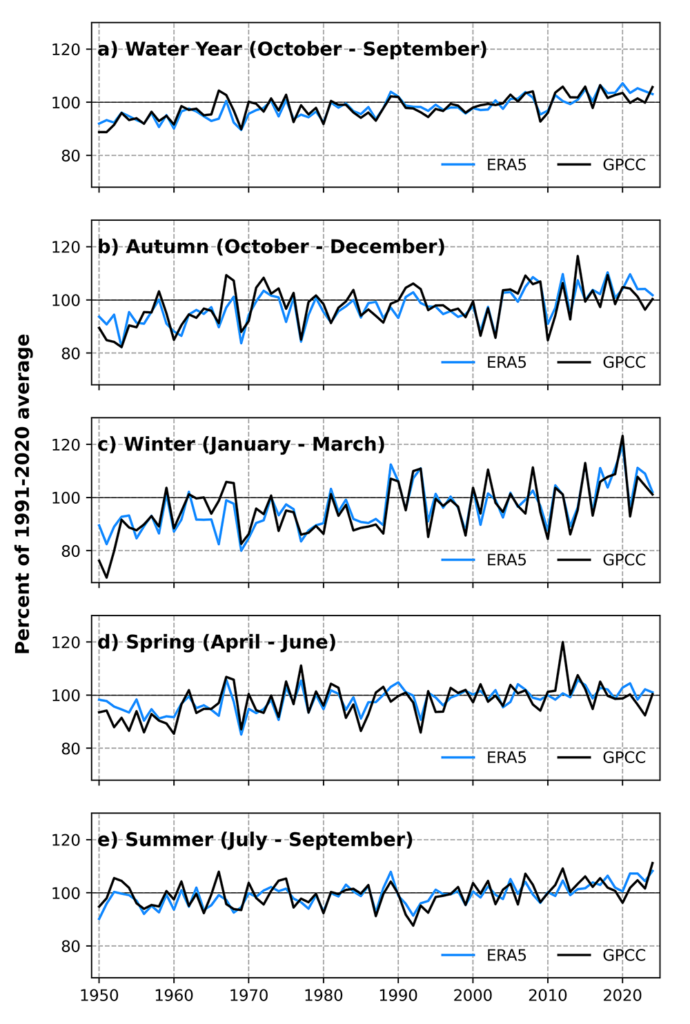
As is the case with previous Arctic Report Cards, the Arctic precipitation time series from ERA5 (as a percentage of 1991-2020 averages for the region poleward of 60° N) is plotted along with the corresponding time series from the station-based dataset of the Global Precipitation Climatology Center (GPCC) during 1950-2023 (Fig. 3). The GPCC dataset is for land only, while ERA5 data cover ocean areas as well as land. While the percent anomaly time series are generally similar, there are some substantial differences for individual years due to the absence of coverage over the Arctic Ocean in GPCC and inherent uncertainties in each data source. Nevertheless, the time series agree with respect to a positive long-term trend in annual precipitation and the record high precipitation for summer 2024.

Based on the ERA5 precipitation time series for the region poleward of 60° N that includes the 2023/24 water year, the trend in annual mean precipitation stands at +0.74 cm per decade, or a 10.4% percent change since 1951 (Fig. 3). Corresponding seasonal trends are +0.22 cm per decade for autumn, +0.22 cm per decade for winter, +0.12 cm per year for spring, and +0.18 cm per decade for summer. Autumn and winter hence show the strongest seasonal trends. In terms of percent change relative to the 1991-2020 average, winter is stronger (+2.17 % per decade) compared to autumn (+1.61% per decade). Summer is 0.99% per decade, spring is 1.05% per decade, and the water year as a whole is 1.41% per decade.
Methods and data
Because of the challenges of collecting in situ precipitation gauge measurements in the Arctic, we use gridded precipitation fields from both the ERA5 atmospheric reanalysis of the European Centre for Medium Range Weather Forecasts (ECMWF) (Hersbach at al. 2020) and the Global Precipitation Climatology Centre’s GPCC Full Data Version Data Version 2022 (Becker et al. 2013; https://opendata.dwd.de/climate_environment/GPCC/html/fulldata-daily_v2022_doi_download.html). ERA5 data are available from January 1940 onward, but the quality of the output is more reliable starting in 1979 (Hersbach et al. 2020), after which modern satellite data are assimilated into the analysis and forecast system. ERA5 is the latest atmospheric reanalysis effort and performs slightly better than other atmospheric reanalyses at matching observed precipitation totals from Arctic extreme events (Loeb et al. 2022). Given the model-derived nature of ERA5, comparisons are made with the GPCC’s Full Data Product, a monthly gridded gauge-based product available from 1891 onward (Schneider et al. 2022). Our comparisons of pan-Arctic precipitation computed from these two sources is limited to the post-1950 time period because both products were impacted by missing data during World War II.
References
Becker, A., P. Finger, A. Meyer-Christoffer, B. Rudolf , K. Schamm, U. Schneider, and M. Ziese, 2013: A description of the global land-surface precipitation data products of the Global Precipitation Climatology Centre with sample applications including centennial (trend) analysis from 1901-present. Earth Sys. Sci. Data, 5, 71-99, https://doi.org/10.5194/essd-5-71-2013.
Bigalke, S., and J. E. Walsh, 2022: Future changes of snow in Alaska under stabilized global warming scenarios. Atmosphere, 13, 541, https://doi.org/10.3390/atmos13040541.
Box, J. E., and Coauthors, 2021: Recent developments in Arctic climate observation indicators. AMAP Arctic Climate Change Update 2021: Key Trends and Impacts, Arctic Monitoring and Assessment Programme (AMAP), Tromso, Norway, 7-29, https://www.amap.no/documents/doc/amap-arctic-climate-change-update-2021-key-trends-and-impacts/3594.
Hersbach, H., and Coauthors, 2020: The ERA5 global reanalysis. Quart. J. Roy. Meteor. Soc., 146, 1999-2049, https://doi.org/10.1002/qj.3803.
Loeb, N. A., A. Crawford, J. C. Stroeve, and J. Hanesiak, 2022: Extreme precipitation in the eastern Canadian Arctic and Greenland: An evaluation of atmospheric reanalyses. Front. Env. Sci., 10, 866929, https://doi.org/10.3389/fenvs.2022.866929.
McCrystall, M. R., J. Stroeve, M. C. Serreze, B. C. Forbes, and J. A. Screen, 2021: New climate models reveal faster and larger increases in Arctic precipitation than previously projected. Nat. Commun., 12(1), 6765, https://doi.org/10.1038/s41467-021-27031-y.
Schneider, U., P. Finger, E. Rustemeier, M. Ziese, and S. Hänsel, 2022: Global precipitation analysis products of the GPCC, Global Precipitation Climatology Centre, https://opendata.dwd.de/climate_environment/GPCC/PDF/GPCC_intro_products_v2022.pdf.
Walsh, J. E., S. Bigalke, S. A. McAfee, R. Lader, M. C. Serreze, and T. J. Ballinger, 2022: Precipitation. Arctic Report Card 2022, M. L. Druckenmiller, R. L. Thoman, and T. A. Moon, Eds., https://doi.org/10.25923/yxs5-6c72.
Ye, H., D. Yang, A. Behrangi, S. L. Stuefer, X. Pan, E. Mekis, Y. Dibike, and J. E. Walsh, 2021: Precipitation Characteristics and Changes. Arctic Hydrology, Permafrost and Ecosystems (D. Yang and D. L. Kane, Eds.), Springer Nature Switzerland, https://doi.org/10.1007/978-3-030-50930-9_2.
Yu, L., and S. Zhong, 2021: Trends in Arctic seasonal and extreme precipitation in recent decades. Theor. Appl. Climatol., 145, 1541-1559, https://doi.org/10.1007/s00704-021-03717-7.
November 15, 2024

