M. -L. Timmermans1 and Z. M. Labe2
1Department of Earth and Planetary Sciences, Yale University, New Haven, CT, USA
2Geophysical Fluid Dynamics Laboratory, NOAA, Princeton, NJ, USA
Headlines
- August 2024 mean sea surface temperatures (SSTs) were ~2-4°C warmer than 1991-2020 August mean values in most Arctic Ocean marginal seas.
- Anomalously cool August 2024 SSTs (~1-4°C cooler) were observed in the Chukchi Sea.
- August mean SSTs show warming trends for 1982-2024 in almost all Arctic Ocean regions that are ice-free in August, with mean SST increases of ~0.3°C per decade in the region north of 65° N.
Arctic Ocean sea-surface temperatures (SSTs) in the summer are primarily influenced by the amount of incoming solar radiation absorbed by the sea surface and by the flow of warm waters into the Arctic from the North Atlantic and North Pacific Oceans. Solar warming of the Arctic Ocean surface is influenced by the sea-ice distribution (with greater warming occurring in ice-free regions), cloud cover, and upper-ocean stratification. Inflows of relatively warm Arctic river waters can provide an additional heat source in coastal regions.
Arctic SST is an essential indicator of the strength of the ice-albedo feedback cycle in any given summer sea-ice melt season. As the brighter sea-ice cover decreases, more incoming solar radiation is absorbed by the darker ocean surface and, in turn, the warmer ocean melts more sea ice. Marine ecosystems are also influenced by SSTs, which affect the timing and development of primary production cycles, as well as available habitat. In addition, higher SSTs are associated with delayed autumn sea ice freeze-up and increased ocean heat storage throughout the year. An essential point for consideration, however, is that the total heat content contained in the ocean surface layer (i.e., the mixed layer) depends on the mixed-layer depth; a shallower mixed layer with higher SSTs could contain the same amount of heat as a deeper mixed layer with lower SSTs. We focus only on SSTs here and do not quantify ocean heat content (in the mixed layer and in deeper warm layers) due to a lack of in situ observations. While pan-Arctic assessments are limited by a lack of observations, particularly in the boundary regions of the Arctic basin, global climate model studies suggest an increasing role for ocean heat content in accelerating Arctic sea-ice loss (e.g., Oldenburg et al. 2024).
The SST data analyzed span June 1982 through August 2024, with 1991-2020 used as the climatological reference period (i.e., “normal”; see Methods and data). Here, we focus most closely on August 2024 mean SSTs in context with the climatological record. August mean SSTs provide the most appropriate representation of Arctic Ocean summer SSTs because sea-ice extent is near a seasonal low at this time of year, and there is not yet the influence of surface cooling and subsequent sea-ice growth that typically takes place in the latter half of September. For this reason, there is more temporal variability in SST (quantified by the standard deviation) in September compared to August. As an example, the mean of each year’s standard deviation of weekly Arctic Ocean (north of 65° N) average SST over the 1991-2020 reference period is approximately 0.1°C in August but increases to 0.3°C in September. This variance in September is even higher if considering the individual marginal seas separately.
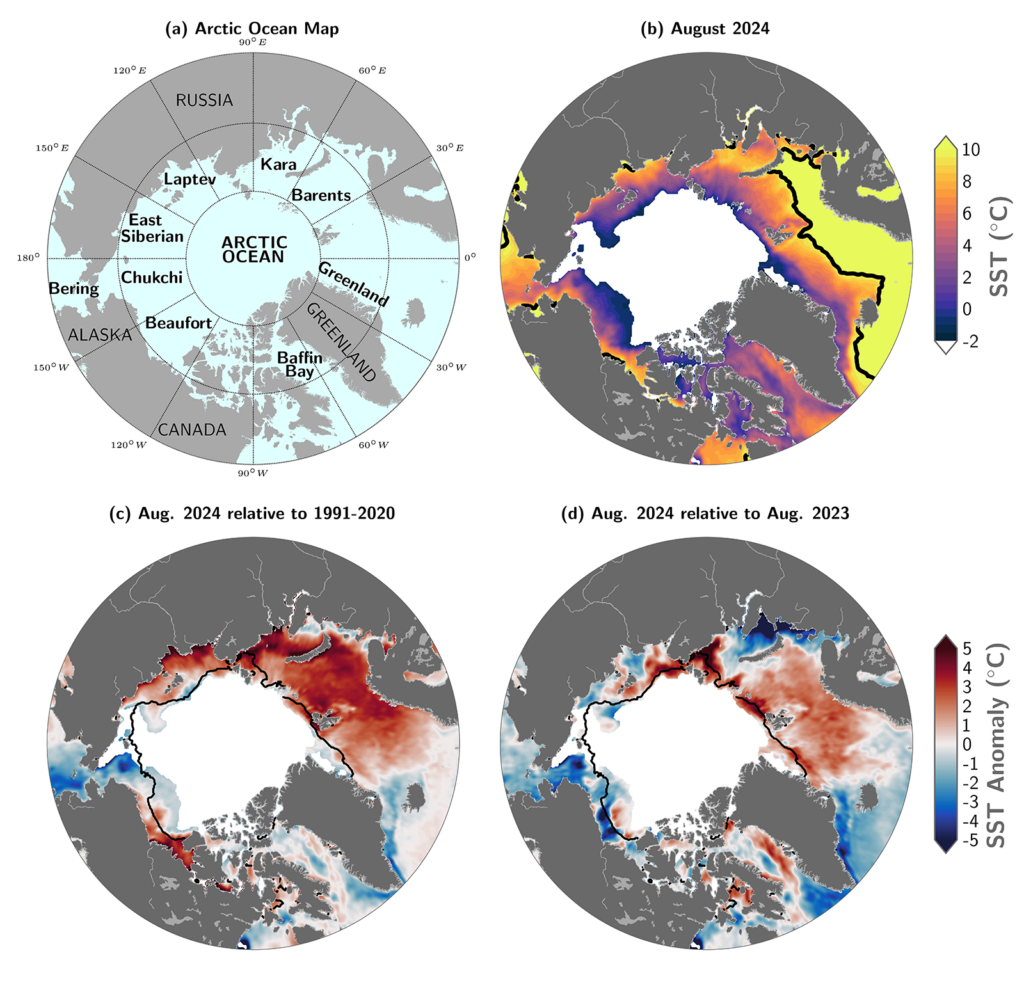
August 2024 mean SSTs were as high as ~12°C in the southern Barents Sea and reached values as high as ~7°C in other Arctic basin marginal regions (Fig. 1a,b). August 2024 mean SSTs were anomalously warm compared to the 1991-2020 August mean in the Barents, Kara, Laptev, and southern Beaufort Seas (around 1°C-4°C higher), and anomalously cold in the East Siberian, Chukchi, and northern Beaufort Seas (around 0.5°C-4.0°C lower than the 1991-2020 mean; Fig. 1c). The cold SSTs in the Arctic Pacific sector also extend through the Bering Sea. This general pattern of August 2024 SSTs is consistent with regional patterns of anomalously warm and cold surface-air temperatures in July-August 2024 (see essay Surface Air Temperature). Regional SST variations differ significantly from year to year. For example, there were considerably higher SSTs in the northern Barents Sea in August 2024 compared to August 2023, with differences of up to 2°C, and mostly lower 2024 SSTs in the Kara and southern Beaufort Seas (Fig. 1d).
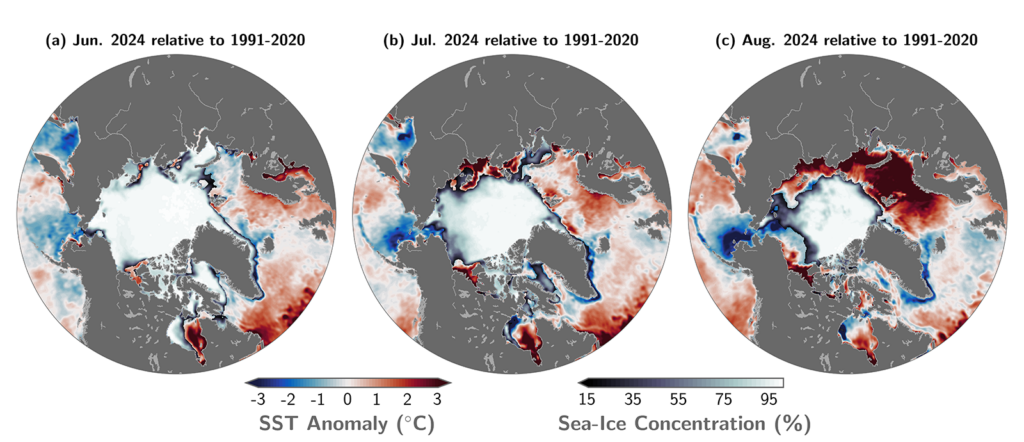
Below-normal August 2024 SSTs in the Chukchi Sea were also observed in June and July, as well as in the eastern sector of the Bering Sea (Fig. 2). This is consistent with relatively cold July/August 2024 surface-air temperatures in the region (see essay Surface Air Temperature) and persistent areas of higher sea-ice concentration (see essay Sea Ice). Above-normal August 2024 SSTs in the Kara and Laptev Seas were also observed in July (Fig. 2b,c) as sea ice began to retreat from those regions, suggesting the ice-albedo feedback was playing a role in ice retreat and SST warming. The transition from below-normal to above-normal August SSTs from June to August in the Barents Sea corresponded with the transition from anomalously cool surface air temperatures in June to warm in July/August (see essay Surface Air Temperature).
The Arctic Ocean has experienced mean August SST warming trends from 1982 to 2024, with statistically significant (at the 95% confidence interval) linear warming trends in almost all regions (Fig. 3). Mean August SSTs for the entire region of the Arctic Ocean north of 65° N exhibit a linear warming trend of 0.03±0.01°C/yr (Fig. 4a). For context, both the North Pacific and North Atlantic (between 50° N and 65° N) show linear warming trends over this same period of 0.04±0.01°C/yr.
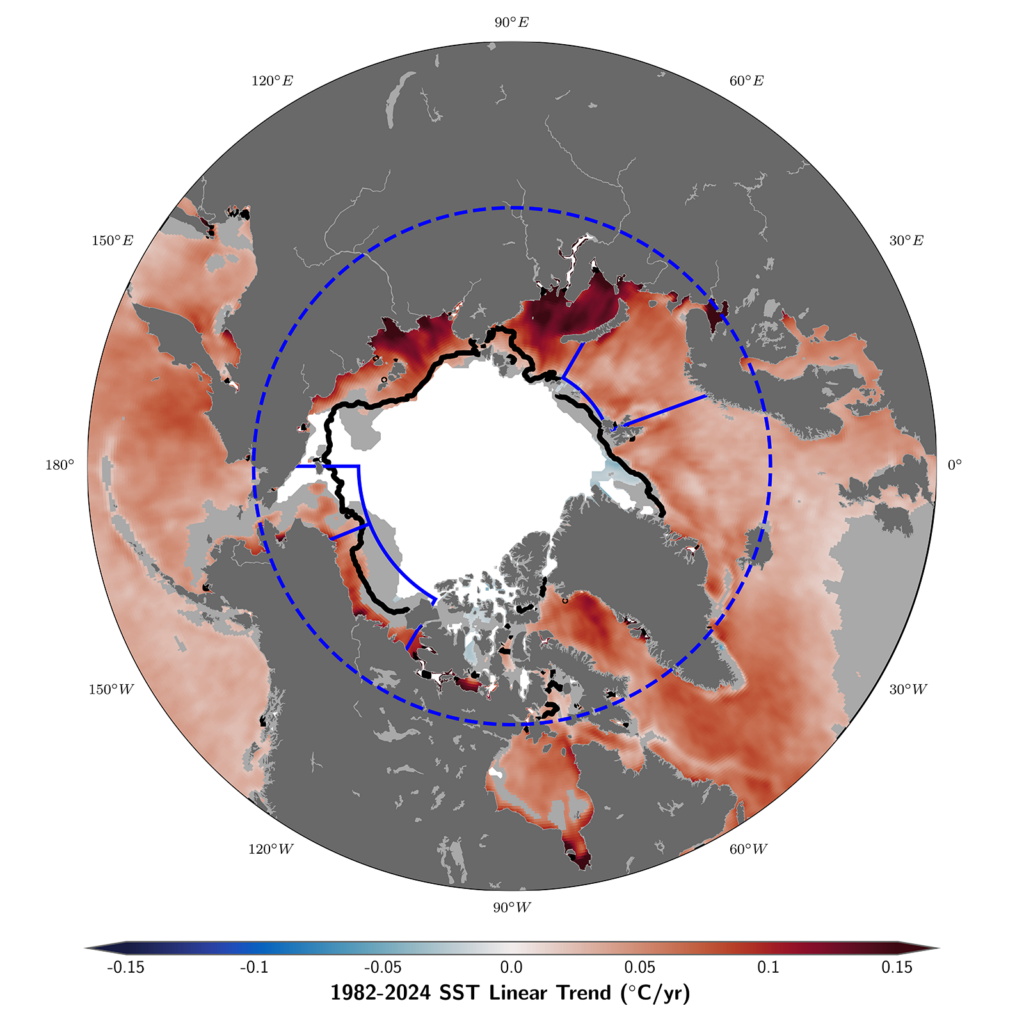
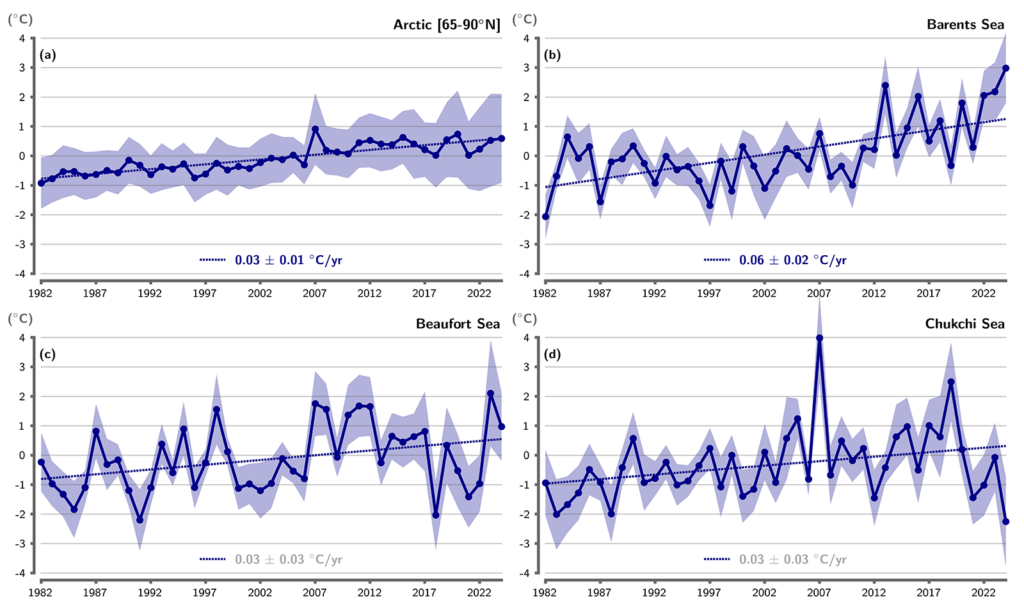
Regionally, the Kara and Laptev Seas show the strongest warming trends in the Arctic Ocean, with August SST linear trends in these seas of around 0.12°C/yr (Fig. 3). This is consistent with large declines in August sea-ice extent in these regions (Timmermans and Labe 2020). Statistically significant linear trends in August SST are also observed in the Barents Sea (0.06±0.02°C/yr), where August 2024 mean SSTs were the warmest on record (Fig. 4b). On the other hand, there is no statistically significant trend in August SSTs in the Beaufort and Chukchi Seas (Fig. 4c,d), although the southernmost portion of the Beaufort Sea does show a statistically significant warming trend (Fig. 3). The Beaufort Sea shows considerable interannual variability in mean August SST values (Fig. 4c), while Chukchi Sea trends are notably influenced by anomalously cool SSTs in the region in recent years with record low August 2024 mean SSTs (Fig. 4d).
Methods and data
The SST data presented here are from the 0.25° × 0.25° NOAA Optimum Interpolation Sea Surface Temperature (OISST) Version 2.1 product, a blend of in situ and satellite measurements (Reynolds et al. 2002, 2007; Huang et al. 2021); https://psl.noaa.gov/data/gridded/data.noaa.oisst.v2.highres.html. The datafile “sst.mon.mean.nc” (comprising monthly means from the daily data) was retrieved from https://downloads.psl.noaa.gov/Datasets/noaa.oisst.v2.highres/ (accessed 3 September 2024). Note that in January 2023, OISST Version 2.1 replaced the 1° × 1° NOAA OISST Version 2, which was analyzed in Arctic Report Cards before 2023; while overall SST trends and patterns are similar between versions, the difference merits caution when comparing Arctic Report Cards across years (for further details, see Timmermans and Labe 2023).
For setting a proxy SST in sea-ice covered regions, OISST Version 2.1 sets SST equal to the freezing temperature (computed using a climatological sea-surface salinity) where ice concentrations are greater than 35% (see Banzon et al. 2020). Therefore, uncertainty in inferring SSTs (and SST trends) may be significant in the vicinity of the sea-ice edge, which varies in location each year, and when sea ice covers a significant portion of the region of interest.
Note that Timmermans and Labe (2023) excluded the region north of 80° N in their calculation of the Arctic Ocean SST trend. For the same calculation in this essay (Fig. 4a), we consider the entire region to 90° N. Considering the larger region yields a somewhat smaller trend (although statistically indistinguishable) because the extra area considered mostly remains perennially ice covered. Given the rapid pace of sea-ice loss and poleward expansion of ice-free areas, we choose to include even the northernmost regions of the Arctic Ocean in the calculation. Recent work has produced a combined SST and sea-ice temperature dataset (Nielsen-Englyst et al. 2023); given the rate of sea-ice area change, in future work it may be sensible to additionally examine trends in this combined field.
Sea-ice concentration data are the Near-Real-Time NOAA/NSIDC Climate Data Record of Passive Microwave Sea Ice Concentration, Version 2 (https://nsidc.org/data/g10016) (Peng et al. 2013; Meier et al. 2021a,b). The 1991-2020 median ice edge is from the NOAA/NSIDC Climate Data Record of Passive Microwave Sea Ice Concentration, Version 4 (https://nsidc.org/data/g02202) with a threshold of 15% concentration defined as the ice edge.
Acknowledgments
M. -L. Timmermans acknowledges support from the National Science Foundation Office of Polar Programs and the Office of Naval Research. Z. Labe acknowledges support through base funding from the National Oceanic and Atmospheric Administration to the Geophysical Fluid Dynamics Laboratory (GFDL). We also thank Drs. Xia Li and William Gregory for their insightful comments and suggestions on the GFDL internal review of the essay. NOAA OI SST V2 High Resolution Dataset data provided by the NOAA PSL, Boulder, Colorado, USA, from their website at https://psl.noaa.gov.
References
Banzon, V., T. M. Smith, M. Steele, B. Huang, and H. -M. Zhang, 2020: Improved estimation of proxy sea surface temperature in the Arctic. J. Atmos. Ocean. Tech., 37, 341-349, https://doi.org/10.1175/JTECH-D-19-0177.1.
Huang, B., C. Liu, V. Banzon, E. Freeman, G. Graham, B. Hankins, T. Smith, and H. Zhang, 2021: Improvements of the Daily Optimum Interpolation Sea Surface Temperature (DOISST) Version 2.1. J. Climate, 34(8), 2923-2939, https://doi.org/10.1175/JCLI-D-20-0166.1.
Meier, W. N., F. Fetterer, A. K. Windnagel, and J. S. Stewart, 2021a: NOAA/NSIDC Climate Data Record of Passive Microwave Sea Ice Concentration, Version 4. [1982-2021]. NSIDC: National Snow and Ice Data Center, Boulder, CO, USA, accessed 3 September 2024, https://doi.org/10.7265/efmz-2t65.
Meier, W. N., F. Fetterer, A. K. Windnagel, and J. S. Stewart, 2021b: Near-Real-Time NOAA/NSIDC Climate Data Record of Passive Microwave Sea Ice Concentration, Version 2. [1982-2021], accessed 3 September 2024, https://doi.org/10.7265/tgam-yv28.
Nielsen-Englyst, P., J. L. Høyer, W. M. Kolbe, G. Dybkjær, T. Lavergne, R. T. Tonboe, S. Skarpalezos, and I. Karagali, 2023: A combined sea and sea-ice surface temperature climate dataset of the Arctic, 1982-2021. Remote Sens. Environ., 284, 113331, https://doi.org/10.1016/j.rse.2022.113331.
NOAA, 2024: Optimum Interpolation Sea Surface Temperature (OISST) high resolution dataset, version 2.1. NOAA/PSL, accessed 3 September 2024, https://psl.noaa.gov/data/gridded/data.noaa.oisst.v2.highres.html.
Oldenburg, D., Y. Kwon, C. Frankignoul, G. Danabasoglu, S. Yeager, and W. M. Kim, 2024: The respective roles of ocean heat transport and surface heat fluxes in driving Arctic Ocean warming and sea ice decline. J. Climate, 37, 1431-1448, https://doi.org/10.1175/JCLI-D-23-0399.1.
Peng, G., W. N. Meier, D. J. Scott, and M. H. Savoie, 2013: A long-term and reproducible passive microwave sea ice concentration data record for climate studies and monitoring. Earth Syst. Sci. Data, 5, 311-318, https://doi.org/10.5194/essd-5-311-2013.
Reynolds, R. W., N. A. Rayner, T. M. Smith, D. C. Stokes, and W. Wang, 2002: An improved in situ and satellite SST analysis for climate. J. Climate, 15, 1609-1625, https://doi.org/10.1175/1520-0442(2002)015<1609:AIISAS>2.0.CO;2.
Reynolds, R. W., T. M. Smith, C. Liu, D. B. Chelton, K. S. Casey, and M. G. Schlax, 2007: Daily high-resolution-blended analyses for sea surface temperature. J. Climate, 20, 5473-5496, https://doi.org/10.1175/2007JCLI1824.1.
Timmermans, M. -L., and Z. M. Labe, 2020: Sea surface temperature. Arctic Report Card 2020, R. L. Thoman, J. Richter-Menge, and M. L. Druckenmiller, Eds., https://doi.org/10.25923/v0fs-m920.
Timmermans, M. -L., and Z. M. Labe, 2023: Sea surface temperature. Arctic Report Card 2023, M. L. Druckenmiller, R. L. Thoman, and T. A. Moon, Eds., https://doi.org/10.25923/e8jc-f342.
November 13, 2024

