
The Observational Foundation of the Arctic Report Card – a 15-Year Retrospective Analysis on the Arctic Observing Network (AON) and Insights for the Future System
S. Starkweather1,2, H. Shapiro3, S. Vakhutinsky4, and M. Druckenmiller4
1Cooperative Institute for Research in Environmental Sciences, University of Colorado Boulder, Boulder, CO, USA
2Earth System Research Laboratory, NOAA, Boulder, CO, USA
3Arctic Research Consortium of the United States, Fairbanks, AK, USA
4National Snow and Ice Data Center, Boulder, CO, USA
Highlights
- Since 2007, the overall performance of the Arctic Observing Network (AON) and its data products that support the Vital Signs of the Arctic Report Card (ARC) has increased from “Fair” to “Good”, according to expert input to a Value Tree Assessment. Advancements in the AON have resulted in moderate to significant improvements in five out of seven ARC Vital Sign metrics, however persistent constraints and significant observing gaps still exist, limiting understanding and posing uncertainty.
- Important additions to the observing system and advancements in process-level understanding of the Arctic environment account for these improvements to the ARC.
- A public data portal has been developed at the Arctic Data Center to house a searchable catalog of these data products (Arctic Report Card Data Portal).
Introduction
Over the last 15 years, observations of the Arctic environment have revealed broad, system-wide, and cumulative changes, with potentially catastrophic consequences to Arctic and global society (Richter-Menge et al. 2019; IPCC 2019; CAFF 2017, 2019; AMAP 2017; AC 2009, 2016; ICC 2008, 2014). Yet relative to other regions, structural gaps in sustained observing systems have hampered scientific understanding of the drivers and implications of these changes (Lee et al. 2019; Murray et al. 2018; AOS EOC 2018). Arctic observing systems encounter many challenges. Extreme physical conditions drive up the cost and limit the capabilities of conventional technology systems. A lack of regional infrastructure, including telecommunications, also increases costs and constrains deployments and real-time transmissions. The patchwork of national approaches across eight Arctic states and other observing partners increases planning complexity.
These challenges and imperatives gave rise to the vision of an internationally coordinated Arctic Observing Network (AON; NRC 2006) of sustained and integrated observations targeting the most critical aspects of a rapidly changing Arctic. Tracking, evaluating, and continuously improving the quality of the AON in support of these outcomes, for both research and operational systems, is a critical effort. The inception of the AON vision coincided with the first publication date of the Arctic Report Card (ARC), which is significant because the ARC is an example of a key product that benefits from the AON’s improvements. The 15-year archive of the ARC, along with input from the subject matter experts who have authored it, provide a substantial foundation for a retrospective analysis exploring how the AON’s support of the ARC has changed over this period.
Analysis approach
Strategic improvement to the complex of Arctic observations (for example, see essay Barrow Arctic Observatory) requires a comprehensive evidence base that systematically identifies gaps and opportunities for optimized investment. Such an evidence base must recognize the interconnected nature of Arctic observations and their connection to delivering public value. Value Tree Analysis (VTA) is a multi-criteria decision support methodology that supports these objectives (IDA 2017). Through expert elicitation, a process which synthesizes the opinions of authorities on a subject, VTA systematically links observational inputs (i.e., satellite or in situ measurements) to the value-added data product and application outputs they support, ultimately linking those outputs to desired outcomes. The desired outcomes in the value tree are specified by a benefit framework. The International Arctic Observing Assessment Framework (IAOAF) was developed by international partners to support analyses specifically for the AON (IDA 2017).
The methodology of VTA is used to weigh the relative impact of individual observing systems and data products, while revealing up- and downstream dependencies across the system. The completed analysis generates a systems-level view of how the value derived from Earth observations propagates forward to achieve societal benefit. The results of a VTA can also reveal where value propagation terminates due to technical hurdles, like prolonged latencies in the delivery of a parameter. By generating a cohesive view of these issues, VTA provides funders and policymakers with an evidence base for informing decisions to strategically fill observing gaps and remove impediments to value propagation.
Analysis scope
The ARC-focused analysis covers the period from 2007 to 2020, using the seven ARC parameters now termed Vital Signs. These parameters have been covered most consistently throughout the ARC series. Under each Vital Sign, this analysis centers on the data products, both observational and model-derived, that support key findings. Key findings are defined as those that establish the annual status of a key variable (e.g., terrestrial snow cover extent) in the context of its long-term trend. Authors from each Vital Sign validated the catalog of data products referenced in the 15-year history of their essay and independently provided the weights and performance scores in the VTA, based on their collective expertise.
Findings
Since 2007, over the course of the ARC series, Vital Signs have employed more than 100 different data products to support key findings of Arctic change. In ARC2020, the 27 data products employed were largely derived from gridded products based on satellite or blended analyses (14), but were also supported by reanalyses or modeled products (8) and in situ networks (5). Reanalyses and model products themselves are fed by a complex of observational inputs, the full accounting of which exceeded the scope of this analysis. Hence, the 27 observing system inputs to the ARC-focused analysis reflects a conservative count of data inputs. The need for multinational and interagency support for the systems that underpin ARC findings is evident in the mix of products, which are developed for both operational (8) and research (19) purposes, supported by the US, Canada, Japan, and European nations. In an effort to support transparency around the key findings of the ARC2020, a specialty public data portal has been developed at the Arctic Data Center to house a searchable catalog of these data products.
The results of the VTA revealed the diverse scope of inputs required to develop the seven ARC Vital Signs (see Fig. 1 and Glossary of Acronyms for this discussion). The most widely used observing systems are the Passive Microwave (PM) satellite (currently DMSP/SSMIS), NASA’s hyperspectral MODIS satellite, and in situ automated weather stations (AWS). Given the persistent issues with atmospheric reanalysis and satellite retrievals near the surface in high latitudes, AWS networks continue to provide critical insights on surface conditions. The PM provides high utility for cryospheric observations, even under cloudy conditions, making it a good fit for the Arctic. The dependence of five Vital Signs on the PM (four shown in Fig. 1; a fifth, Ocean Primary Productivity, did not meet the criticality threshold for inclusion in the graphic) reveals an important vulnerability given that the last satellite is beyond its planned life without a replacement scheduled (Lavergne et al. 2019). This contrasts with the Normalized Difference Vegetation Index (NDVI, see essay Tundra Greenness) that is redundantly supported by multiple systems (MODIS, AVHRR, and LandSat). Here, authors note that they choose to work with AVHRR, despite its lower spatial resolution, because the longer record (compared to MODIS) and comprehensive coverage (compared to LandSat) better supports the goals of the ARC.
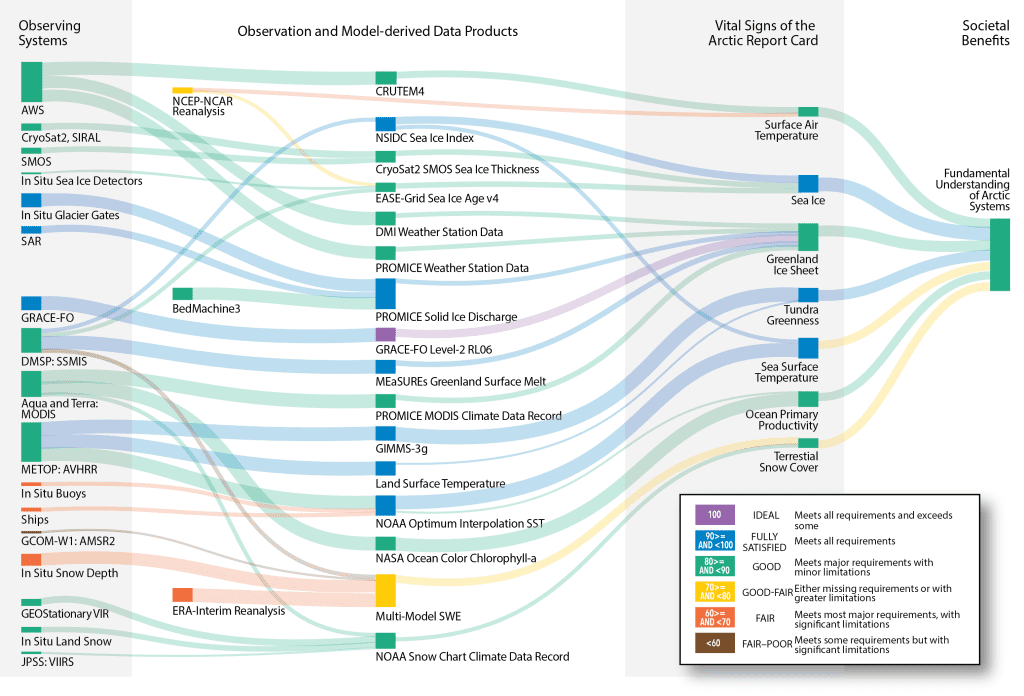
Most authors reported that the objective of the ARC itself, which primarily is to support rapid reporting of key findings, became a driver for the types of products they used in combination with their own preferences or desire to maintain continuity. For example, earlier versions of the ARC essay on ocean conditions included findings related to ocean temperature and salinity profiles, both of which were derived from scores of in situ instruments and ship cruises. While the consolidation of those observations into comprehensive findings was informative, it hindered the primary ARC objective of rapid assimilation of quality-assured data collections and was abandoned. In some cases, authors specifically developed climate data records to support their work on ARC and related assessments, meaning ARC has become a driving force in improving the AON. For example, a series of improvements to MODIS-derived albedo estimates since 2007 have resulted in the establishment of a Climate Data Record (Box et al. 2017, and essay Greenland Ice Sheet). Overall, from an ARC2020 perspective, authors reported a composite, weight-normalized observing system performance of 81 and data product performance of 86 (see Key in Fig.1 for all performance scores in this essay). Both ratings, which fall into the category of ‘Good’, are specific to the ARC itself and not reflective of the performance of the AON across all applications. Authors’ combined ratings for how well their essay supported the IAOAF Societal Benefit Area (SBA) Fundamental Understanding of Arctic Systems (77) reflects that even an ‘Ideal’ Vital Sign would not address all the requirements of this SBA due to its breadth.
For the Value Tree Analysis, authors were asked to rate the performance of their ARC Vital Sign (i.e., how well the Vital Sign does at conveying long-term trends in the subject of interest) and how it has changed since it first appeared in the ARC (Table 1). Over the last 15 years, five of seven Vital Signs have seen moderate (+10) to large (+40) performance improvements. Taken as a composite across all Vital Signs, the quality of the AON and its data products in support of ARC has risen from a performance score of 61 to 84, or from ‘Fair’ to ‘Good’ (see Key in Fig.1) The Greenland (+30) and Sea Ice (+20) Vital Signs both credit their gains to new observations. In the case of Greenland, these include the GRACE satellite’s Greenland mass balance observations and a new network of AWS stations across Greenland (Fausto and Van As 2019). For Sea Ice, both CryoSat and ICESat provide new capabilities to estimate sea ice thickness from space-borne radar and laser altimeters, respectively. The Tundra Greenness and Surface Air Temperature authors credit the improvements in their performance (+40 and +10, respectively) to improved representation of Arctic processes in models and data products. Terrestrial Snow Cover (+40) authors credit improved understanding of uncertainty across seasons.
| Vital Sign | Performance Rating, 2007 or first year in the ARC | Performance Rating, 2020 | What accounts for changes in the ratings? (In the words of the Vital Signs’ authors) |
|---|---|---|---|
| Surface Air Temperature | 60 | 70 | “Over the last 15 years, there have been weather model improvements […] which have improved the quality of Arctic air temperature forecasts and reanalyses, particularly downstream of AWS sites. Within the last decade, the addition of AWS sites in Alaska and coastal Greenland and on the Greenland Ice Sheet (e.g., PROMICE sites) has also improved the depiction of Arctic Surface Air Temperature.” Thomas Ballinger |
| Sea Ice | 60 | 80 | “[2007] Sea ice extent was available, but there was no real ice thickness information for most of the Arctic Ocean, and ice type information was limited…[2020] CryoSat-2 and ICESat-2 are now providing comprehensive thickness info. Also long-term ice age is available.” Walt Meier |
| Greenland Ice Sheet | 50 | 80 | “We are now able to comment on most ice sheet changes using observational records. Records are longer and our confidence in results and understanding of ice sheet processes is significantly advanced. There are multiple sources for a number of important observations, and many more observational (especially remote sensing) tools now.” Twila Moon |
| Tundra Greenness | 50 | 90 | “[2007] Originally, there were issues with the dataset at high latitudes, specifically > 72 degrees north.
[2020] Since [then], […], we have worked extensively with the dataset developers to improve the quality of the data at high latitudes.” Howard Epstein |
| Sea Surface Temperature | 90 | 90 | “[These ratings are] not 100 percent because of limitations of spatial resolution, which is a shortcoming in coastal regions where Sea Surface Temperature variability over small spatial scales is significant.” Mary Louise Timmermans |
| Ocean Primary Productivity | 80 | 80 | “The same satellite data sets have been used since 2011, […] not much changed here, however, with a longer time series, the statistical significance of the change can be more accurate.” Karen Frey |
| Terrestrial Snow Cover | 40 | 80 | “In the early years of the Arctic Report Card, we only analyzed the trend in snow cover extent using two products. Over time, we added new datasets from remote sensing and models. This has provided more comprehensive information on how Arctic snow is changing (snow extent, duration, snow water equivalent), and increased confidence in the trends. Over the past fifteen years, a wide range of reference data has also been used to improve our understanding of seasonal changes to Arctic snow.” Lawrence Mudryk |
While these improvements are encouraging, there are still significant gaps in the AON of relevance to ARC Vital Signs. For this reason, authors were also asked about needed future improvements to the AON and its data products that would increase the performance score of their essays. The Terrestrial Snow Cover authors indicated that new earth observation capabilities, such as Ku-band radar, are needed to improve estimates of snow water equivalent (SWE) across the Arctic (particularly in mountain areas), which would allow better validation of other SWE analyses over these regions. Sea Ice authors would like to include snow depth and melt ponding over sea ice in the essay, as well as representations of melt-onset and freeze-up dates. They note that these observations are largely available, but there is a significant time lag in the preparation of the data products. Sea Surface Temperature and Sea Ice estimates are poorly resolved in coastal areas, indicating a need for higher resolution in their respective satellite systems. In the case of Ocean Primary Productivity, NASA’s PACE mission may address needs for higher accuracy chlorophyll-a concentrations in the optically complex Arctic waters, but this would not address the limitations of visible band instruments under the persistently cloudy Arctic conditions.
Conclusions
Earth observations are a public good for which policy makers require a strong evidence base to maximize the benefits that observing systems yield. The catalog of data products from the ARC provides a meaningful input to such an evidence base, particularly in support of the IAOAF SBA Fundamental Understanding of the Arctic System. The data products and observing systems that have formed the basis for the ARC Vital Signs have matured since 2007, due to both sponsorship of new observations and focused improvements to data products. While the improvements observed over the seven Vital Signs are encouraging, it is important to note that the results of this analysis are biased by that which has been possible to consistently observe in the Arctic. There are many critical topics worthy of the type of assessment presented in the ARC, but the absence of related observations and data products on a timely and consistent basis eliminates them from consideration. There is a pressing need to strategically identify the most urgently needed improvements for this broader scope of concerns. The quality of the AON in support of scientific assessments is a critical indicator that should itself be monitored. The ARC and these methodologies provide a starting point for such comprehensive analyses.
Glossary of acronyms
Satellites or Sensors:
AMSR2 – Advanced Microwave Scanning Radiometer
AVHRR – Advanced Very High Resolution Radiometer
DMSP – Defense Meteorological Satellite Program
GCOM-W1 – Global Change Observation Mission
GRACE – Gravity Recovery and Climate Experiment
JPSS – Joint Polar Satellite System
MODIS – Moderate Resolution Imaging Spectroradiometer
SAR – Synthetic Aperture Radar
SIRAL – SAR/Interferometric Radar Altimeters
SMOS – Soil Moisture and Ocean Salinity mission
SSMIS – Special Sensor Microwave Imager/Sounder
VIIRS – Visible Infrared Imaging Radiometer Suite
VIR – Visible and Infrared
Data Centers/Products/Terms:
AWS – Automated Weather Station
CRUTEM – Climatic Research Unit Temperature
DMI – Danish Meteorological Institute
EASE-Grid – Equal Area Scalable Earth Grid
ECMWF – European Centre for Medium-range Weather Forecasts
ERA – ECMWF Reanalysis
MEaSUREs – Making Earth Science Data Records for Use in Research Environments
NCEP – National Center for Environmental Prediction
NCAR – National Center for Atmospheric Research
NSIDC – National Snow and Ice Data Center
PROMICE – Program for the Monitoring of the Greenland Ice Sheet
References
Arctic Council (AC), 2009: Arctic Marine Shipping Assessment 2009 Report. B. Ellis and L. Brigham, Eds., 194 pp., https://oaarchive.arctic-council.org/handle/11374/54.
Arctic Council (AC), 2016: Arctic Resilience Report. M. Carson and G. Peterson, Eds. Stockholm Environment Institute and Stockholm Resilience Centre, Stockholm, Sweden, http://www.arctic-council.org/arr.
Arctic Monitoring and Assessment Program (AMAP), 2017: Snow, water, ice and permafrost. Summary for policy-makers. Arctic Monitoring and Assessment Programme (AMAP), Oslo, Norway, 20 pp., https://www.amap.no/documents/doc/snow-water-ice-and-permafrost.-summary-for-policy-makers/1532.
Arctic Observing Summit Executive Organizing Committee (AOS EOC), 2018: Report of the 4th Arctic Observing Summit: AOS 2018, Davos, Switzerland, 24-26 June 2018. International Study of Arctic Change (ISAC) Program Office, Arctic Institute of North America, Calgary, Canada.
Box, J. E., D. van As, and K. Steffen, 2017: Greenland, Canadian and Icelandic land ice albedo grids (2000-2016). Geol. Surv. Den. Greenl., 38, 53-56.
Conservation of Arctic Flora and Fauna (CAFF), 2017: State of fresh water report. Conservation of Arctic Flora and Fauna International Secretariat, Akureyri, Iceland, https://www.caff.is/freshwater/freshwater-monitoring-publications/488-state-of-the-arctic-freshwater-biodiversity-report-full-report.
Conservation of Arctic Flora and Fauna (CAFF), 2019: State of the arctic marine biodiversity report. Conservation of Arctic Flora and Fauna International Secretariat, Akureyri, Iceland, https://www.caff.is/marine/marine-monitoring-publications/state-of-the-arctic-marine-biodiversity-report.
Fausto, R. S., and D. van As, 2019: Programme for monitoring of the Greenland ice sheet (PROMICE): Automatic weather station data. Version: v03, Dataset published via Geological Survey of Denmark and Greenland, https://doi.org/10.22008/promice/data/aws.
Institute for Defense Analyses (IDA), 2017: International Arctic Observations Assessment Framework. IDA Science and Technology Policy Institute, Washington, DC, U.S.A., and Sustaining Arctic Observing Networks, Oslo, Norway, 73 pp., https://www.arcticobserving.org/news/268-international-arctic-observations-assessment-framework-released.
Intergovernmental Panel on Climate Change (IPCC), 2019: IPCC Special Report on the Ocean and Cryosphere in a Changing Climate [H. -O. Pörtner, D. C. Roberts, V. Masson-Delmotte, P. Zhai, M. Tignor, E. Poloczanska, K. Mintenbeck, A. Alegría, M. Nicolai, A. Okem, J. Petzold, B. Rama, and N. M. Weyer (eds.)], in press.
Inuit Circumpolar Council-Canada (ICC), 2008: The Sea Ice is Our Highway: An Inuit Perspective on Transportation in the Arctic. https://www.inuitcircumpolar.com/project/the-sea-ice-is-our-highway-an-inuit-perspective-on-transportation-in-the-arctic/.
Inuit Circumpolar Council (ICC), 2014: The Sea Ice Never Stops: Circumpolar Inuit Reflections on Sea Ice Use and Shipping in Inuit Nunaat. https://www.inuitcircumpolar.com/project/the-sea-ice-never-stops-circumpolar-inuit-reflections-on-sea-ice-use-and-shipping-in-inuit-nunaat/.
Lavergne, T., and Coauthors, 2019: Version 2 of EUMETSAT OSI SAF and ESA CCi sea ice concentration climate data records. Cryosphere, 12, 49-78, https://doi.org/10.5194/tc-13-49-2019.
Lee, C. M., and Coauthors, 2019: A Framework for the development, design and implementation of a sustained Arctic ocean observing system. Front. Mar. Sci., 6, 451, https://doi.org/10.3389/fmars.2019.00451.
Murray, M. S., R. D. Sankar, and G. Ibarguchi, 2018: The Arctic Observing Summit, Background and Synthesis of Outcomes 2013-2016. International Study of Arctic Change (ISAC) Program Office, Arctic Institute of North America, Calgary, Canada.
National Research Council (NRC), 2006: Toward an integrated Arctic Observing Network. The National Academies Press, Washington, DC, https://doi.org/10.17226/11607.
Richter-Menge, J., M. L. Druckenmiller, and M. Jeffries, Eds., 2019: Arctic Report Card 2019, https://www.arctic.noaa.gov/Report-Card.
November 21, 2020