
G. J. Wolken1,2, B. Wouters3,4, M. Sharp5, L. M. Andreassen6, D. Burgess7, J. Kohler8, and B. Luks9
1International Arctic Research Center, University of Alaska Fairbanks, Fairbanks, AK, USA
2Alaska Division of Geological & Geophysical Surveys, Fairbanks, AK, USA
3Institute for Marine and Atmospheric Research, Utrecht University, Utrecht, The Netherlands
4Department of Geoscience & Remote Sensing, Delft University of Technology, Delft, The Netherlands
5Department of Earth and Atmospheric Sciences, University of Alberta, Edmonton, AB, Canada
6Section for Glaciers, Ice and Snow, Norwegian Water Resources and Energy Directorate, Oslo, Norway
7Geological Survey of Canada, Ottawa, ON, Canada
8Norwegian Polar Institute, Tromsø, Norway
9Institute of Geophysics, Polish Academy of Sciences, Warsaw, Poland
Highlights
- Observations of glaciers and ice caps outside Greenland from 2018 and 2019 (the most recent data available) show regional variations in mass change, and a continuing trend of significant ice loss throughout the Arctic.
- Ice loss in 2018 and 2019 was dominated largely by melting in Alaska, Arctic Canada, and Svalbard, in association with anomalously warm air temperatures, with 2019 producing the most negative mass balance year on record for the combined Alaska glaciers.
- The estimated total mass loss for Arctic glaciers and ice caps as a whole during the combined GRACE and GRACE-FO period (2002-19) is -164 ± 23.8 Gt yr-1, which is equal to a global sea level rise contribution of approximately 0.4 mm yr-1.
Introduction
Numerous glaciers and ice caps, in multiple climatic zones, occupy land areas in the Arctic outside Greenland. They exist where the rate of snow accumulation exceeds the rate of melt by atmospheric heat. Although their potential longer-term contribution to sea level rise is small compared to the ice sheets of Antarctica and Greenland, on the short term these smaller land ice masses have contributed disproportionately to recent sea level rise in response to continued atmospheric warming (Gardner et al. 2011, 2013; Jacob et al. 2012; Millan et al. 2017; Wouters et al. 2019). Observations of glaciers and ice caps from 2018 and 2019 (the most recent data available) show regional variations in mass change and a continuing trend of significant ice loss throughout the Arctic and especially in Alaska and Arctic Canada.
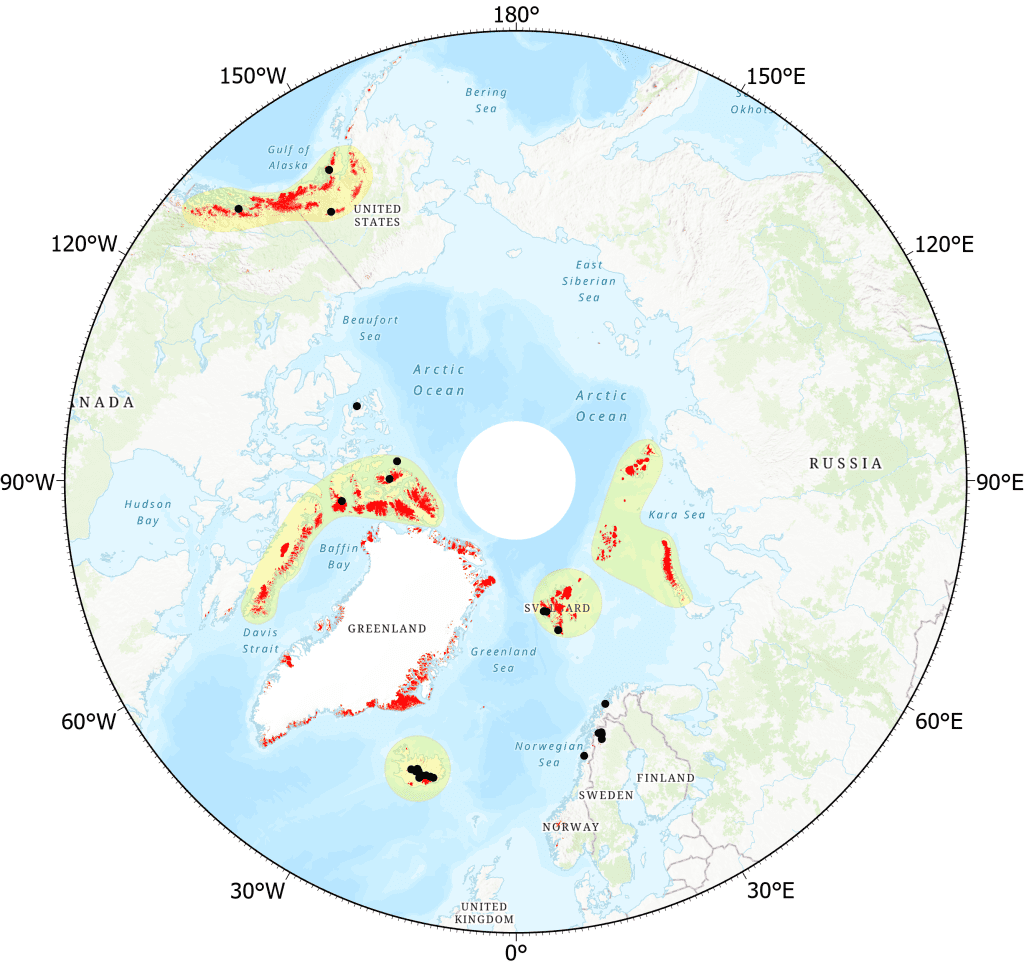
Measurements of glacier mass change allow us to assess the state, or health, of a glacier and how it influences changes in global mean sea level. Glaciers gain mass by snow accumulation and lose mass through surface melt and runoff and, where they terminate in the ocean or a lake, by iceberg calving. The annual mass balance is traditionally measured over a ‘balance year’ that, in the Arctic, is often defined operationally to extend from September to August of the following year. Positive annual mass balance values indicate a gain in mass over the balance year, whereas negative mass balance values indicate a loss in mass. This summary considers the annual mass balance in two ways: the climatic mass balance, which is the difference between the annual mass gain by snow accumulation and the annual mass loss by surface melting and runoff, and the total mass balance is given by the mass gain by snow accumulation minus runoff and iceberg calving. Of the 27 glaciers currently monitored for mass balance across the Arctic (Fig. 1), only three (Kongsvegen (Svalbard), Hansbreen (Svalbard), and Devon Ice Cap (Canada)) are tidewater glaciers, which lose mass by iceberg calving into the ocean.
Climatic mass balance
At the time of reporting, climatic mass balance measurements for mass balance year 2018/19 are available from 10 of the 27 monitored Arctic glaciers (three in Alaska, four in Svalbard, two in Norway, and one in Arctic Canada). This limited data availability is due to latency in seasonal measurements at some glaciers and because some of these data are still provisional. Therefore, to provide a more complete assessment of the state of Arctic glaciers and ice caps, we also report on 25 glaciers for mass balance year 2017/18 (World Glacier Monitoring Service [WGMS] 2017; Kjøllmoen et al. 2019). For the Arctic as a whole, the mean climatic mass balance values for 2017/18 and 2018/19 were negative, indicating overall mass loss.
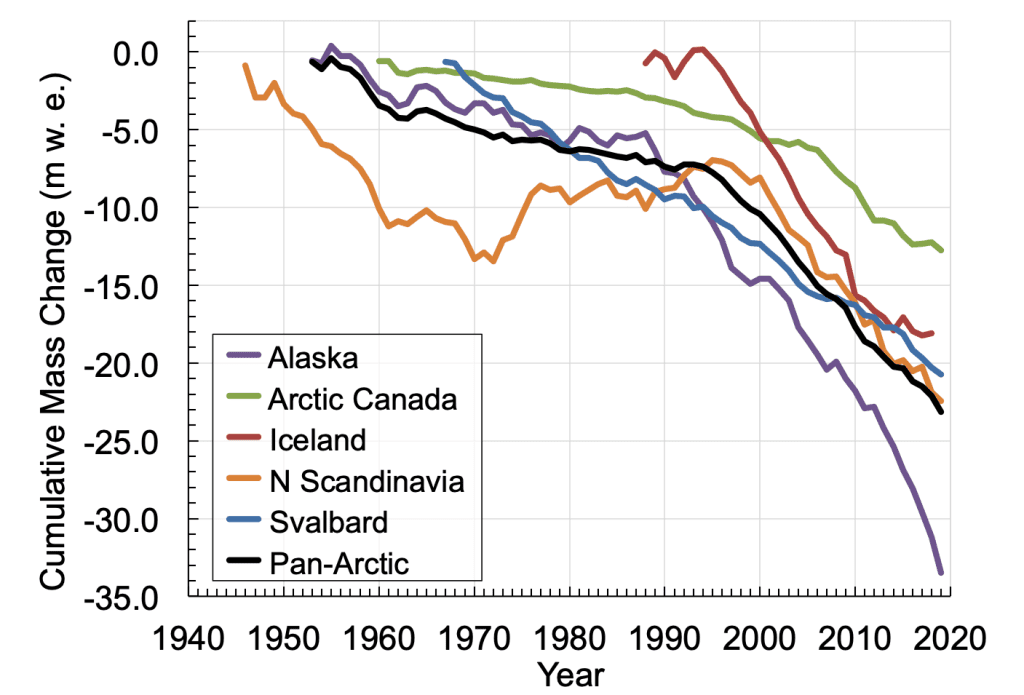
Negative balances were recorded for 16 of the 25 glaciers (64%) in 2017/18 (in Alaska, Svalbard, and northern Scandinavia) and 9 (36%) registered positive balances (in Arctic Canada and Iceland). Relative to the 1985-2015 mean values of climatic mass balance, 12 of the 25 were more negative and 13 were more positive than the mean. The positive anomalies observed for the nine individual glaciers during 2017/18 contrast with the mainly negative annual mass balance anomalies that have driven the current trend of continued mass loss observed throughout the Arctic since the mid-1950s (Fig. 2). With the exception of the Svalbard region (where there has been no obvious recent acceleration of mass loss rates), rapid mass loss across the five regions generally began during the 1990s (van Pelt et al. 2019; Zemp et al. 2019). In 2018/19, climatic mass balance values reported for glaciers in Alaska, Svalbard, Norway, and Arctic Canada were as a whole more negative than the long-term mean. For the combined Alaska glaciers, 2018/19 was the most negative mass balance year on record and marked the seventh consecutive year of strongly negative anomalies in the Alaska region.
Surface melting
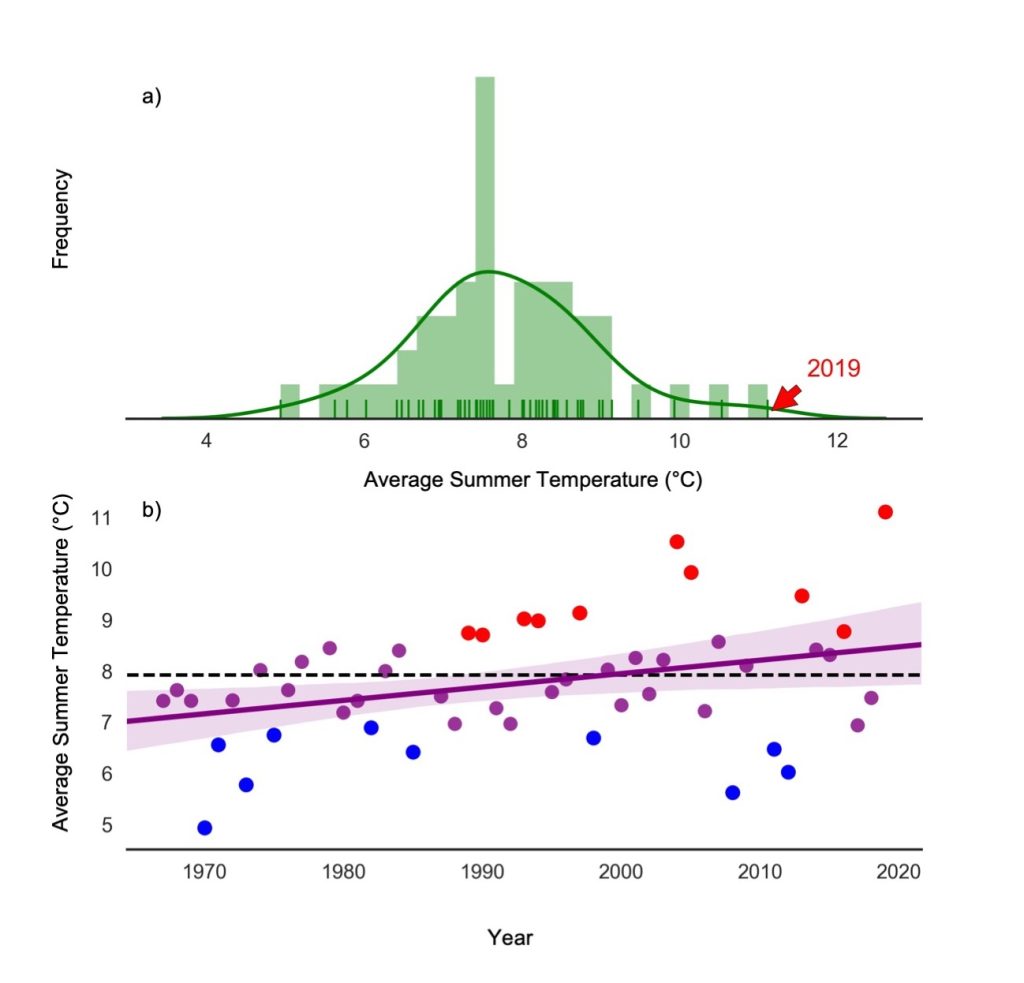
The climatic mass balance of glaciers in the Arctic is strongly controlled by changes in air temperature. Positive balance anomalies in Arctic Canada and Iceland during 2017/18 were likely influenced by frequent low-pressure systems in the central Arctic generating persistent cloud cover that reduced solar heating during summer (Overland et al. 2019). The negative balances of glaciers in Alaska, northern Scandinavia, and Svalbard in 2017/18 were most likely linked to melt increases caused by positive air temperature anomalies during autumn from the surface to 850 hPa, relative to the 1981-2010 climatology (data from NCEP-NCAR Reanalysis; Overland et al. 2019). In 2018/19, negative balance values reported for glaciers in Alaska, Arctic Canada, and Svalbard were also associated with anomalously warm air temperatures at 850 hPa and persistent ridges of high pressure over Arctic Russia, Arctic Canada, and Alaska. Strong positive air temperature anomalies (2.5°-3.5°C at 1000-850 hPa) in 2018/19, associated with southerly winds and warm air (Overland et al. 2020), produced the most negative mass balance year on record for the combined Alaska glaciers. For example, the 2019 average summer air temperature at Wolverine Glacier in south-central Alaska was 11.1°C, marking the hottest summer in the 52-year record and 3.2°C higher than the 1981-2010 climatological mean (Fig. 3). Over the period of record at Wolverine Glacier (1967-2019), mean summer temperatures have increased 1°C, at a rate of 0.02°C yr-1 (p < 0.02; O’Neel et al. 2019).
Total mass balance
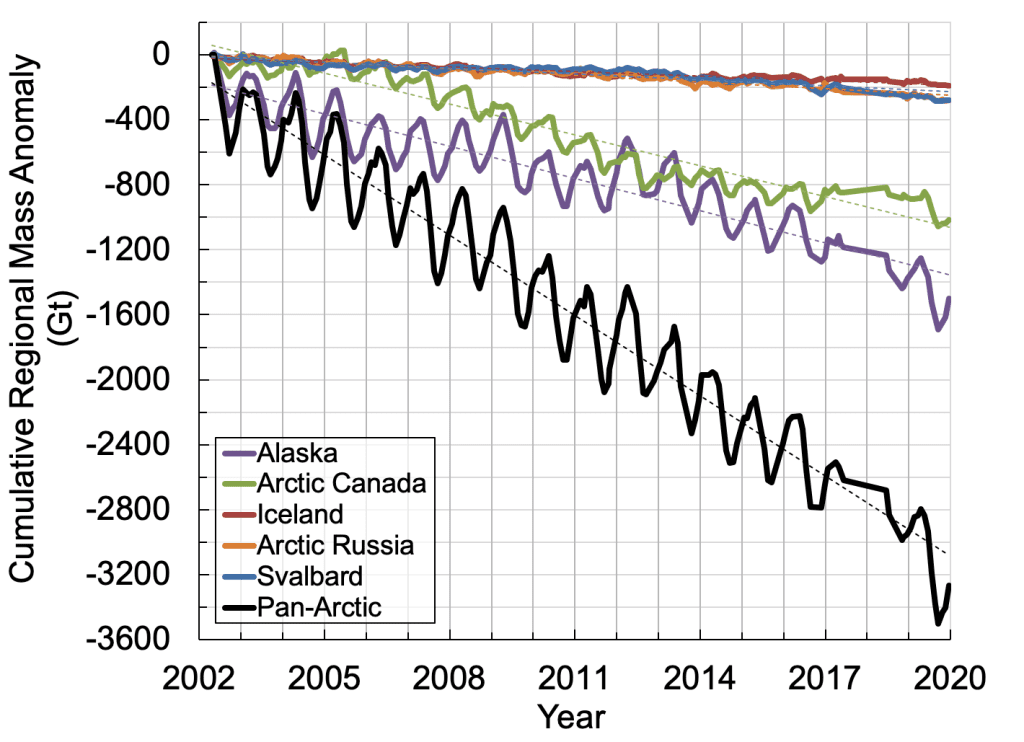
The regional total glacier mass balance in the heavily glacierized regions of the Arctic can be estimated from time series of cumulative regional mass anomalies, here derived using GRACE (2002-17) and GRACE FO (2018-present) satellite gravimetry (Fig. 1; Wouters et al. 2019). For the Arctic glaciers and ice caps as a whole, the overall mass balance was strongly negative during the combined GRACE and GRACE-FO period (2002-19), with the record dominated largely by ice mass loss from Arctic Canada and Alaska (Fig. 4). The estimated mass loss trends during this period for five regions in the Arctic are: -66 ± 10 Gt yr-1 (Alaska); -63 ± 8.2 Gt yr-1 (Arctic Canada); -9 ± 1.8 Gt yr-1 (Iceland); -14 ± 3.2 Gt yr-1 (Arctic Russia); and -12 ± 0.6 Gt yr-1 (Svalbard), with estimated uncertainties (at 2 std. dev.) including corrections for glacial isostatic adjustment and terrestrial hydrology. The Arctic-wide estimate for mass loss from glaciers and ice caps outside of Greenland is equal to a global sea level rise contribution of approximately 0.4 mm yr-1. By comparison, Greenland currently contributes about 0.7 mm yr-1 (see essay Greenland Ice Sheet). When normalized by area, glaciers and ice caps outside Greenland are currently producing more melt per unit area than all land ice on Greenland. For the Arctic as a whole (glaciers and ice caps plus the Greenland Ice Sheet) the current rate of contribution to global sea level rise is 1.1 mm yr-1.
Acknowledgments
The authors would like to thank E. H. Baker and S. O’Neel, U.S. Geological Survey, Alaska Science Center, Anchorage, Alaska, for data contributions to this report.
References
Bieniek, P. A., and J. E. Walsh, 2017: Atmospheric circulation patterns associated with monthly and daily temperature and precipitation extremes in Alaska. Int. J. Climatol., 37, 208-217, https://doi.org/10.1002/joc.4994.
Gardner, A. S., and Coauthors, 2011: Sharply increased mass loss from glaciers and ice caps in the Canadian Arctic Archipelago. Nature, 473, 357-360, https://doi.org/10.1038/nature10089.
Gardner, A. S., and Coauthors, 2013: A reconciled estimate of glacier contributions to sea level rise: 2003-2009. Science, 340, 852-857, https://doi.org/10.1126/science.1234532.
Jacob, T., J. Wahr, W. T. Pfeffer, and S. Swenson, 2012: Recent contributions of glaciers and ice caps to sea level rise. Nature, 482, 514-518, https://doi.org/10.1038/nature10847.
Kjøllmoen, B., L. M. Andreassen, H. Elvehøy, and M. Jackson, 2019: Glaciological investigations in Norway 2018, NVE Rapport 46-2019, 84 pp +app.
Millan, R., J. Mouginot, and E. Rignot, 2017: Mass budget of the glaciers and ice caps of the Queen Elizabeth Islands, Canada from 1991-2015. Environ. Res. Lett., 12, 024016, https://doi.org/10.1088/1748-9326/aa5b04.
O’Neel, S., and Coauthors, 2019: Reanalysis of the US Geological Survey Benchmark Glaciers: long-term insight into climate forcing of glacier mass balance. J. Glaciol., 65(253), 850-866, https://doi.org/10.1017/jog.2019.66.
Overland, J. E., E. Hanna, I. Hanssen-Bauer, S. -J. Kim, J. E. Walsh, M. Wang, and U. S. Bhatt, 2019: Surface air temperature [in “State of the Climate in 2018”]. Bull. Amer. Meteor. Soc., 100(9), S142-S143, https://doi.org/10.1175/2019BAMSStateoftheClimate.1.
Overland, J. E., T. J. Ballinger, E. Hanna, I. Hanssen-Bauer, S. -J. Kim, J. E. Walsh, M. Wang, U. S. Bhatt, and R. L. Thoman, 2020: Surface air temperature [in “State of the Climate in 2018”]. Bull. Amer. Meteor. Soc., 101(7), S8-S10, https://doi.org/10.1175/2020BAMSStateoftheClimate.1.
Pfeffer, W. T., and Coauthors, 2014: The Randolph Glacier Inventory: a globally complete inventory of glaciers. J. Glaciol., 60(221), 537-552, https://doi.org/10.3189/2014JoG13J176.
van Pelt, W., and Coauthors, 2019: A long-term dataset of climatic mass balance, snow conditions, and runoff in Svalbard (1957-2018). Cryosphere, 13, 2259-2280, https://doi.org/10.5194/tc-13-2259-2019.
WGMS, 2017: Global Glacier Change Bulletin No. 2 (2014-2015). M. Zemp, S. U. Nussbaumer, I. Gärtner-Roer, J. Huber, H. Machguth, F. Paul, and M. Hoelzle (Eds.), ICSU(WDS)/IUGG(IACS)/UNEP/UNESCO/WMO, World Glacier Monitoring Service, Zurich, Switzerland, 244 pp. Based on database version: https://doi.org/10.5904/wgms-fog-2017-10.
Wouters, B., A. S. Gardner, and G. Moholdt, 2019: Global glacier mass loss during the GRACE satellite mission (2002-2016). Front. Earth Sci., 7, 96, https://doi.org/10.3389/feart.2019.00096.
Zemp, M., and Coauthors, 2019: Global glacier mass changes and their contributions to sea-level rise from 1961 to 2016. Nature, 568, 382-386, https://doi.org/10.1038/s41586-019-1071-0.
November 14, 2020