

C. Duguay1, L. Brown2
1Department of Geography and Environmental Management, University of Waterloo, Canada
2Department of Geography, University of Toronto, Mississauga, Canada
Highlights
- Freeze-up during the 2017/18 ice season occurred within ±1-2 weeks of the 2004-17 mean for most regions of the Arctic. In striking contrast, Lakes Ladoga and Onega (Russia) and lakes within the southernmost part of Finland experienced later freeze-up, on the order of 4-5 weeks.
- With a few exceptions, break-up dates were within ±1 week from the 2004-17 mean across the Arctic.
- Ice cover duration anomalies largely mirrored those of freeze-up dates for much of the Arctic.
Lake ice is an important component of the cryosphere for several weeks to several months of the year in high-latitude regions. The presence (or absence) of ice cover on lakes during the winter months affects both regional weather and climate (e.g., thermal moderation and lake-induced snowfall) (Brown and Duguay, 2010; Baijnath-Rodino et al., 2018). Hence, monitoring of lake ice is critical to our skill at regional forecasting (Kheyrollah Pour et al., 2012; Eerola et al., 2014). Lake ice phenology, which encompasses freeze-up (ice-on) and break-up (ice-off) dates, and ice cover duration, is predominantly influenced by air temperature changes and, therefore, is a robust indicator of regional climate trends and variability. Lake ice cover has been identified as an Essential Climate Variable (ECVs) by the Global Climate Observing System (GCOS) (GCOS, 2016).
Analyses of records from ground-based observational networks have provided much of the evidence of long-term trends, variability and regime shifts in lake ice phenology. Satellite remote sensing has assumed a greater role in lake ice observing in recent years due to: 1) a dramatic reduction in ground-based observational recordings globally since the 1980s (IGOS, 2007; Jeffries et al., 2012; Duguay et al., 2015a) and 2) the availability of increasingly longer satellite datasets, particularly from 2000 onward (Duguay et al., 2015b). Recent analyses from satellite records (Šmejkalová et al., 2016; Surdu et al., 2016; Du et al., 2017) reveal that break-up continues to occur earlier in the 21st century for many lakes of the Arctic; a trend that continues to follow that documented from ground-based observations for the second half of the 20th century (Duguay et al., 2006).
For this report, lake ice phenology dates (freeze-up/ice-on and break-up/ice-off dates) and ice cover duration are derived from the NOAA Interactive Multisensor Snow and Ice Mapping System (IMS) 4-km resolution grid daily product for the 2017-18 ice season over the Arctic. These dates are compared to mean conditions for the length of the available satellite records, which begin in 2004. The IMS (Helfrich et al., 2007) incorporates a wide variety of satellite imagery (AVHRR, GOES, SSMI, etc.) as well as derived mapped products (USAF Snow/Ice Analysis, AMSU, etc.) and surface observations. Approximately 15,000 4-km pixels are identified as water in the region north of 58° N.
Freeze-up Period
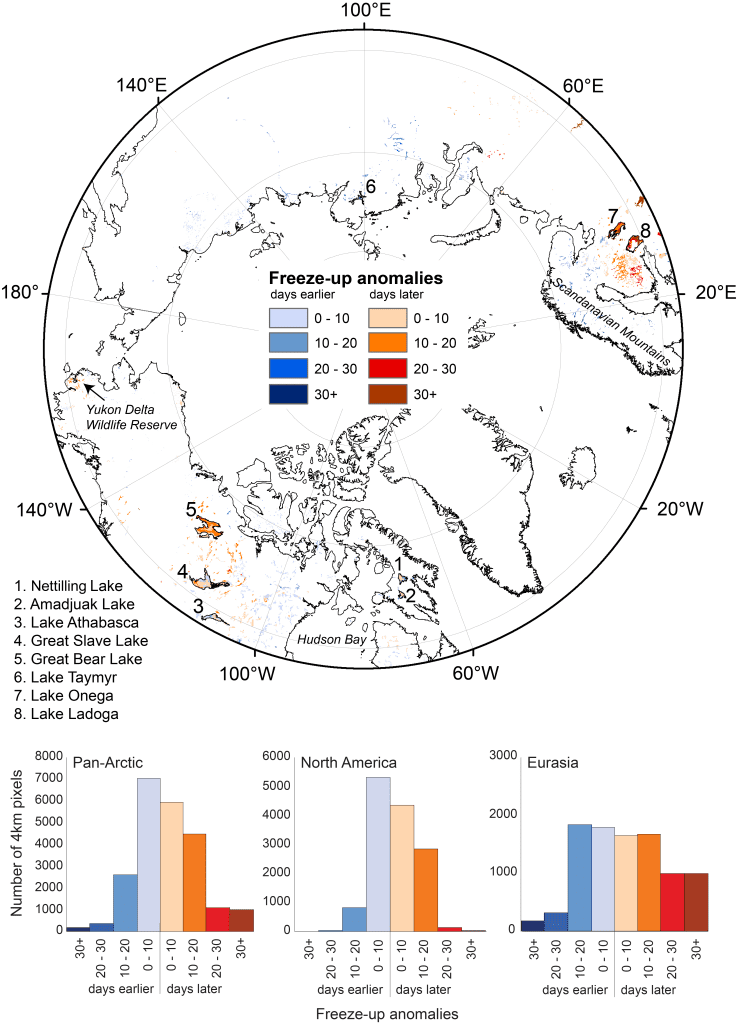
Freeze-up (FU) in 2017/18 occurred earlier than the 2004-17 mean by ~1-3 weeks for most of Siberia, Norway, Sweden, and northern Finland. Ice in some valley lakes in the Scandinavian Mountains range began to form as early as mid-November, which is ~1 month earlier than the mean (Fig. 1). Lakes located in northeastern Canada and immediately to the west of Hudson Bay experienced FU close to the 2004-17 mean (±1 week earlier or later). West of the latter region, and in the Mackenzie Basin (e.g., Great Bear Lake) and the western coast of Alaska, FU occurred later than mean conditions by ~2 weeks, with some small sections of Great Bear Lake exceeding 3 weeks later. Despite the later FU on Great Bear Lake, when ice did begin to form, the lake froze over faster than the mean time needed to freeze, freezing over completely in 25 days (vs. 30 days mean). Located in the same region, Great Slave Lake froze over completely in 16 days (vs. 36 days mean). The most striking FU anomalies are noticeable in southern Finland and western Russia, where lake ice formed ~2-5 weeks later in 2017/18 compared to the mean period. Lakes Ladoga and Onega (western Russia) and lakes of smaller size in the southernmost part of Finland froze over in a period spanning mid-January to late February, later than any other region of the Arctic. FU anomalies of this magnitude were also observed for these lake regions during the 2013/14 ice season (Duguay et al., 2015a). When Lakes Ladoga and Onega did freeze over, a complete ice cover formed ~2 weeks faster than the mean freeze time for each lake. The mean freeze time is 54 days for Lake Ladoga and 40 days for Lake Oneida, for the 2004-07 period. Freeze time for 2017/18 was 36 and 24 days, respectively.
Break-up Period
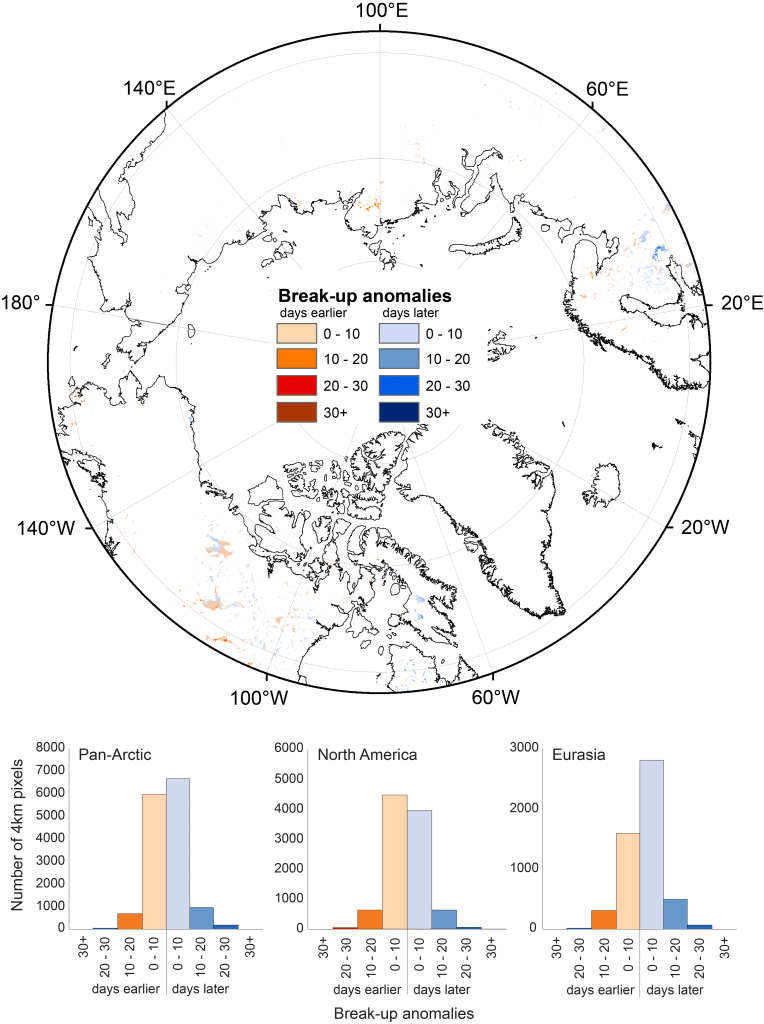
Break-up (BU) anomalies were relatively small for the 2017/18 ice season. BU dates occurred within ±1 week of the 2004-17 mean for most of the Arctic (Fig. 2). Some notable exceptions with earlier BU of ~2-3 weeks include Lake Taymyr (Siberia), and the lakes of southwestern Alaska (Yukon Delta Wildlife Refuge) and northern Scandinavia. At Lake Taymyr, the BU on most of the lake ranged from 10 to 16 days earlier, but with sections reaching as much as 1 month earlier and 1 week later. A few lakes with later BU anomalies of the same order of magnitude can be found in northeastern Canada (northern Quebec and Baffin Island, where ice persisted on Amadjuak Lake until 19 August) and Lake Ladoga (Russia), where ice cover persisted until late April (up to 23 days later than usual) and it took 28 days longer than normal for the lake to become ice free.
Ice Cover Duration
Since BU anomalies were relatively small, the spatial pattern of ice cover duration (ICD) anomalies followed closely that of FU anomalies. However, this is not always the case. For example, in the 2012/13 season, ICD followed the BU anomalies closely (Duguay et al., 2013) (Fig. 3). ICD for 2017/18 was shorter by up to ~1-4 weeks for Lakes Ladoga and Onega (western Russia) and 2-3 weeks shorter for lakes located in the southernmost part of Finland (ICDs as short as 98 days), northwestern Canada (Great Bear Lake and most of Great Slave and Athabasca lakes) and coastal southwestern Alaska. ICD was longer by ~1-2 weeks for most other regions of the Arctic. Exceptions are some lakes in the Scandinavian Mountains, where ICD was nearly 2 months longer, and Amadjuak and Nettilling lakes (the two largest lakes of Baffin Island). ICD was ~2-8 weeks longer in 2017/18 compared to 2004-17 mean for these lakes, with ice cover remaining on Amadjuak Lake for 311 days on the eastern side of the lake.
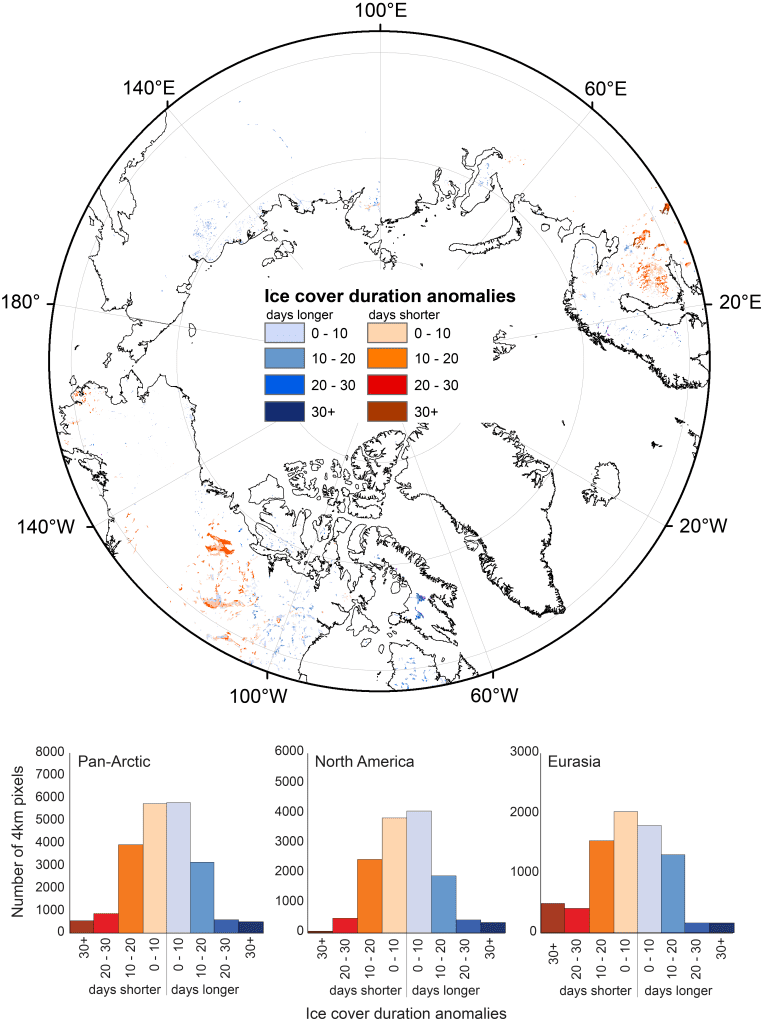
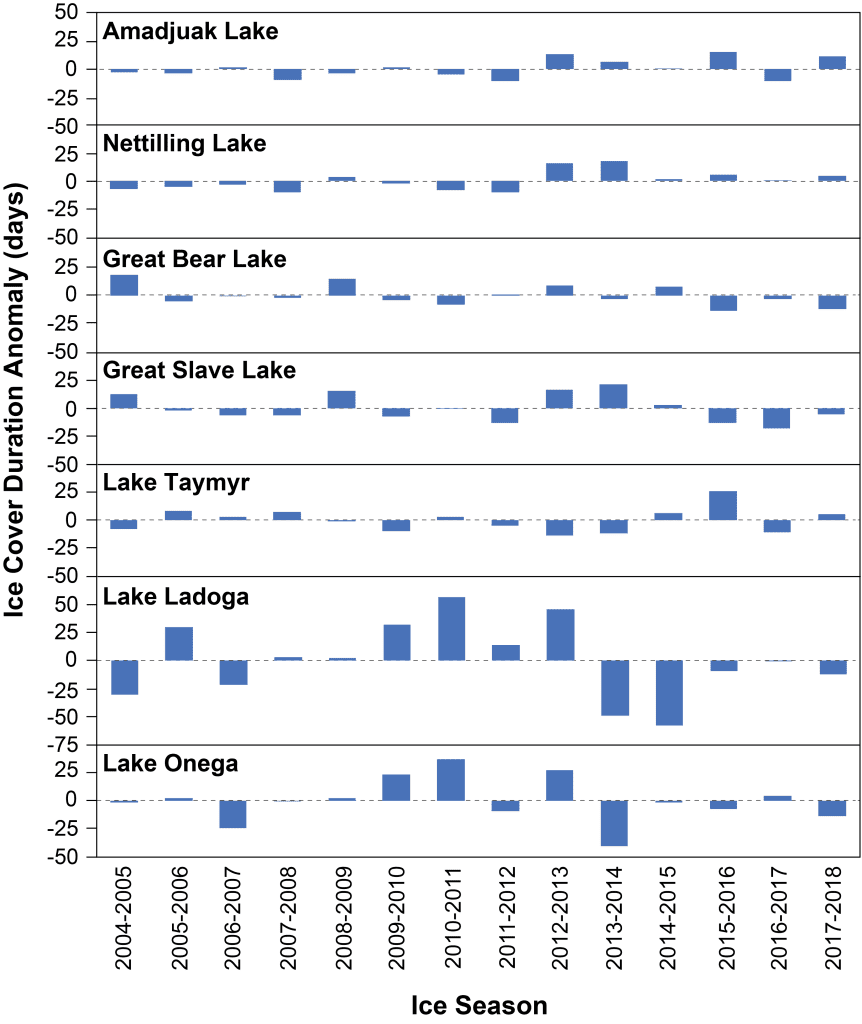
Figure 4 provides lake-wide ice duration anomalies for selected large lakes in Canada and Russia for the 2004-18 period. Both Amadjuak and Nettilling lakes show a range of ICD from 11 days shorter to 15 and 18 days longer, respectively. These lakes have shown positive ICD anomalies for 7 of the last 14 ice seasons, with most of the longer ICD anomalies in the past six seasons. ICD on other large lakes, Great Bear and Great Slave lakes, and Lake Taymyr, show variations around the mean with ICD anomalies ranging from -18 to +26 days of ice compared to the mean of all seasons examined, with Great Slave and Great Bear lakes showing negative (shorter ICD) anomalies in 9 of past 14 seasons. Lakes Ladoga and Onega show the greatest variation in ICD anomalies over the full length of the IMS 4-km record (2004-18) with 59 days shorter to 57 days longer, respectively.
References
Baijnath-Rodino, J. A., C. R. Duguay, and E. F. LeDrew, 2018: Climatological trends of snowfall over the Laurentian Great Lakes Basin. Int. J. Climatol., 38, 3942-3962.
Brown, L. C., and C. R. Duguay, 2010: The response and role of ice cover in lake-climate interactions. Prog. Phys. Geogr., 34, 671-704.
Du, J., J. S. Kimball, C. R. Duguay, Y. Kim, and J. Watts, 2017: Satellite microwave assessment of Northern Hemisphere lake ice phenology from 2002 to 2015. Cryosphere, 11, 47-63.
Duguay, C., L. Brown, K. -K. Kang, and H. Kheyrollah Pour, 2015a: [The Arctic] Lake ice [in “State of the Climate in 2014”]. Bull. Am. Meteorol. Soc., 96, S144-S145.
Duguay C. R., L. C. Brown, K. K. Kang, H. Kheyrollah Pour, 2013: Lake ice [in Arctic Report Card 2013], https://www.arctic.noaa.gov/Report-Card.
Duguay, C. R., M. Bernier, Y. Gauthier, and A. Kouraev, 2015b: Lake and river ice, in Remote Sensing of the Cryosphere. M. Tedesco, Ed., Wiley-Blackwell (Oxford, UK), pp. 273-306.
Duguay, C. R., T. D. Prowse, B. R. Bonsal, R. D. Brown, M. P. Lacroix, and P. Ménard, 2006: Recent trends in Canadian lake ice cover. Hydrol. Process., 20, 781-801.
Eerola, K., L. Rontu, E. Kourzeneva, H. Kheyrollah Pour, and C. R. Duguay, 2014: Impact of partly ice-free Lake Ladoga on temperature and cloudiness in an anticyclonic winter situation—a case study using HIRLAM model. Tellus A, 66, 23929.
GCOS, 2016: The Global Observing System for climate: Implementation needs, GCOS-200. GCOS 2016 Implementation Plan. World Meteorological Organization, 315 pp.
Helfrich, S. R., D. McNamara, B. H. Ramsay, T. Baldwin, and T. Kasheta, 2007: Enhancements to, and forthcoming developments in the Interactive Multisensor Snow and Ice Mapping System (IMS). Hydrol. Process., 21, 1576-1586.
IGOS, 2007: Integrated Global Observing Strategy Cryosphere Theme Report—For the Monitoring of our Environment from Space and from Earth. World Meteorological Organization, WMO/TD-No. 1405, 100 pp.
Jeffries, M. O., K. Morris, and C. R. Duguay, 2012: Floating ice: lake ice and river ice, In Satellite Image Atlas of Glaciers of the World—State of the Earth’s Cryosphere at the Beginning of the 21st Century: Glaciers, Global Snow Cover, Floating Ice, and Permafrost and Periglacial Environments, R. S. Williams, Jr., and J. G. Ferrigno, Eds., U.S. Geological Survey Professional Paper 1386-A, A381-A424.
Kheyrollah Pour, H., C. R. Duguay, A. Martynov, and L. C. Brown, 2012: Simulation of surface temperature and ice cover of large northern lakes with 1-D models: A comparison with MODIS satellite data and in situ measurements. Tellus A, 64, 17614, doi: 10.3402/tellusa.v64i0.17614.
Šmejkalová, T., M. E. Edwards, and J. Dash, 2016: Arctic lakes show strong decadal trend in earlier spring ice-out. Sci. Rep., 6, 38449.
Surdu, C. M., C. R. Duguay, and D. Fernández Prieto, 2016: Evidence of recent changes in the ice regime of high arctic lakes from spaceborne satellite observations. Cryosphere, 10, 941-960.
November 19, 2018