

M. -L. Timmermans1, C. Ladd2, K. Wood2
1Yale University, New Haven, CT, USA
2Pacific Marine Environmental Laboratory, NOAA, Seattle, WA, USA
Highlights
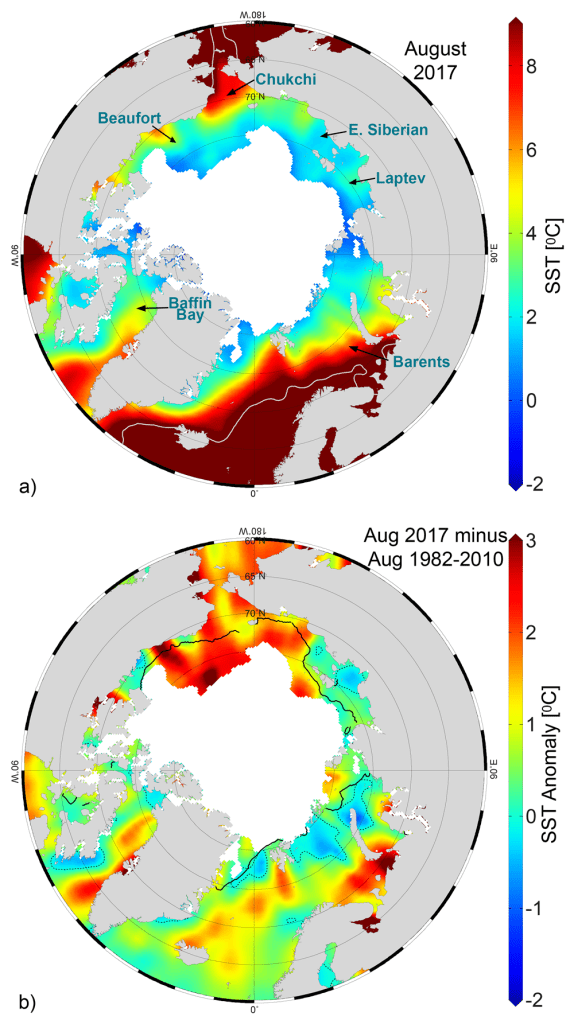
- Sea surface temperatures (SSTs) in August 2017 were up to +4° C warmer than the 1982-2010 August mean in regions of the Barents and Chukchi seas.
- In the Arctic Basin, spatial patterns of August 2017 SST anomalies relative to the 1982-2010 August mean are linked to regional variability in sea-ice retreat, regional air temperature, and advection of waters from the Pacific and Atlantic oceans.
- The Chukchi Sea shows an ocean surface warming trend over 1982-2017 of ~0.7° C/decade.
Summer sea surface temperatures (SST) in the Arctic Ocean are set mainly by absorption of solar radiation into the surface layer. In the Barents and Chukchi seas, there is an additional contribution from advection of warm water from the North Atlantic and Pacific oceans, respectively. Solar warming of the ocean surface layer is influenced by the distribution of sea ice (with more solar warming in ice-free regions), cloud cover, water color, and upper-ocean stratification. River influxes influence the latter two, as well as provide an additional source of warm water. SSTs are an essential indicator of the role of the ice-albedo feedback mechanism in any given melt season: as the area of ice cover decreases, more incoming solar radiation is absorbed by the ocean and the warmer ocean in turn melts more sea ice. SST data presented here are from the NOAA Optimum Interpolation (OI) SST Version 2 product (OISSTv2), which is a blend of in situ and satellite measurements (Reynolds et al., 2002, 2007). Compared to in situ temperature measurements, the OISSTv2 product showed average correlations of about 80%, with an overall cold SST bias of -0.02° C (Stroh et al., 2015).
August SSTs provide the most appropriate representation of Arctic Ocean summer SSTs because they are not affected by the cooling and subsequent sea-ice growth that typically takes place in the latter half of September. Mean SSTs in August 2017 in ice-free regions ranged from ~0° C in some regions to as high as +11° C in the Chukchi and Barents seas (Fig. 1a). Compared to the 1982-2010 August mean (note the monthly SST record begins in December 1981), most boundary regions and marginal seas had anomalously warm SSTs in August 2017 (Fig. 1b). Particularly warm anomalies (around 3-4° C warmer than the 1982-2010 average) were observed in the Beaufort, Chukchi and southern Barents seas. SSTs in the boundary regions and marginal seas, which are mostly ice free in August, are linked to the timing of local sea ice retreat, which facilitates the direct solar heating of the exposed surface waters.
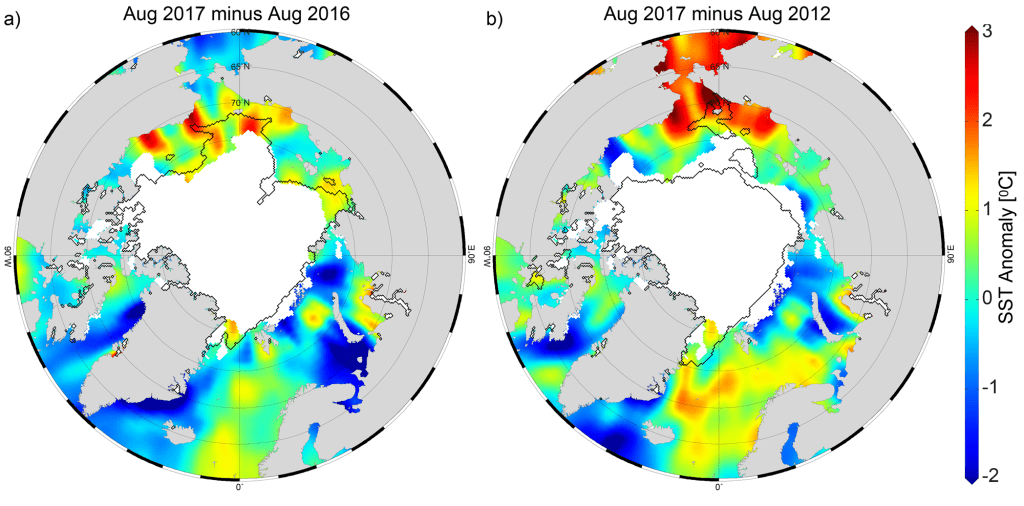
In August 2017, regions off the west and east coasts of Greenland and in the southern Barents Sea were markedly cooler (by up to 3° C) than in August 2016 (Fig. 2a). It is notable also that compared to August 2012 (the summer of lowest minimum sea-ice extent in the satellite record, 1979-present) August SSTs in the Chukchi Sea region were up to 3° C warmer in 2017 (Fig. 2b). This illustrates the significant interannual and spatial variability in summer SSTs. Colder conditions in August 2012 (compared to August 2017) in the Chukchi Sea were related to the persistence of sea ice in that particular region (even while the main ice pack retreated) and a strong cyclonic storm in the region that occurred late in the summer season, during the first week of August (see Timmermans et al., 2013).
Mean August SSTs from 1982-2017 show statistically significant linear warming trends over much of the Arctic Ocean (Fig. 3a); the cooling trends in the Laptev and northern Barents seas are notable exceptions. Mean August SSTs for the entire Chukchi Sea region exhibit a statistically significant warming trend over the duration of the record; August SSTs in this region are warming at a rate of about +0.7° C decade-1, based on a linear fit (Fig. 3b). Warming trends coincide with declining trends in summer sea-ice extent (including late-season freeze-up and early melt, e.g., Parkinson, 2014), increased solar absorption (e.g., Pinker et al., 2014), release of stored ocean heat (e.g., Timmermans et al., 2015), and milder air temperatures (see essay on Surface Air Temperature).

References
Parkinson, C. L., 2014: Spatially mapped reductions in the length of the Arctic sea ice season. Geophys. Res. Lett., 41, 4316-4322, doi: 10.1002/2014GL060434.
Pinker, R. T., X. Niu, and Y. Ma, 2014: Solar heating of the Arctic Ocean in the context of ice-albedo feedback. J. Geophys. Res. Oceans, 119, 8395-8409, doi: 10.1002/2014JC010232.
Reynolds, R. W., N. A. Rayner, T. M. Smith, D. C. Stokes, and W. Wang, 2002: An improved in situ and satellite SST analysis for climate. J. Climate, 15, 1609-1625.
Reynolds, R. W., T. M. Smith, C. Liu, D. B. Chelton, K. S. Casey, and M. G. Schlax, 2007: Daily high-resolution-blended analyses for sea surface temperature. J. Climate, 20, 5473-5496, and see http://www.esrl.noaa.gov/psd/data/gridded/data.noaa.oisst.v2.html.
Stroh, J. N., G. Panteleev, S. Kirillov, M. Makhotin, and N. Shakhova, 2015: Sea-surface temperature and salinity product comparison against external in situ data in the Arctic Ocean. J. Geophys. Res. Oceans, 120, 7223-7236, doi: 10.1002/2015JC011005.
Timmermans, M. -L., I. Ashik, Y. Cao, I. Frolov, R. Ingvaldsen, T. Kikuchi, R. Krishfield, H. Loeng, S. Nishino, R. Pickart, B. Rabe, I. Semiletov, U. Schauer, P. Schlosser, N. Shakhova, W. M. Smethie, V. Sokolov, M. Steele, J. Su, J. Toole, W. Williams, R. Woodgate, J. Zhao, W. Zhong, and S. Zimmermann, 2013: [The Arctic] Ocean Temperature and Salinity [in “State of the Climate in 2012”]. Bull. Amer. Meteor. Soc., 94(8), S128-S130.
Timmermans, M. -L., 2015: The impact of stored solar heat on Arctic sea-ice growth. Geophys. Res. Lett., 42, doi: 10.1002/2015GL064541.
Timmermans, M. -L., 2017: [The Arctic] Sea Surface Temperature [in “State of the Climate in 2016”]. Bull. Amer. Meteor. Soc., 98 (8), S135-S136.
November 20, 2017