
V. E. Romanovsky1, S. L. Smith2, K. Isaksen3, N. I. Shiklomanov4, D. A. Streletskiy4, A. L. Kholodov1, H. H. Christiansen5, D. S. Drozdov6,7, G. V. Malkova6, S. S. Marchenko1
1Geophysical Institute, University of Alaska Fairbanks, Fairbanks, AK, USA
2Geological Survey of Canada, Natural Resources Canada, Ottawa, ON, Canada
3Norwegian Meteorological Institute, Oslo, Norway
4Department of Geography, George Washington University, Washington, DC, USA
5Geology Department, University Centre in Svalbard, UNIS, Norway
6Earth Cryosphere Institute, Tyumen Science Center, Tyumen, Russia
7Tyumen State University, Tyumen, Russia
Highlights
- In 2016, permafrost temperatures were the highest on record at the majority of Arctic observation sites.
- Increases in permafrost temperature since 2000 have been greatest in cold permafrost of the Alaskan Arctic, Canadian high Arctic, and Svalbard.
- The rates of increase in ground temperatures at colder permafrost sites coincide with the rate of increase in the Arctic surface air temperatures.
Permafrost is an important component of the Arctic landscape, influencing hydrological systems and ecosystems and also presenting challenges to infrastructure development. Permafrost temperature and active layer thickness are key indicators of changes in permafrost conditions. Permafrost is defined as earth materials that exist at or below 0° C continuously for at least two consecutive years. The active layer is the seasonally thawed layer above the permafrost. Permafrost temperatures, at a depth where seasonal temperature variations are negligible, can provide a good indication of long-term change. On the other hand, the active layer responds to shorter term fluctuations in climate and is especially sensitive to changes in summer air temperature and precipitation. Warming (increasing permafrost temperatures) and thawing (melting of the ice in frozen ground) of permafrost in the Arctic are reported in this essay.
Changes up to 2016 (most recent data available) in mean annual permafrost temperatures and ALT (active layer thickness) are summarized for a number of sites throughout the Arctic (Fig. 1) (http://gtnpdatabase.org/, http://permafrost.gi.alaska.edu/sites_map, https://www2.gwu.edu/~calm/data/data-links.html). Recent long-term changes in permafrost temperature are driven mostly by the surface air temperature trends (Romanovsky et al., 2015). Other important factors for permafrost temperature, such as snow cover, vegetation and soil moisture, do not yet show pronounced regional long-term trends. In general, the increase in permafrost temperatures observed since the 1980s is more substantial in the higher latitudes where the largest increase in surface air temperature is also observed.

Permafrost Temperatures
In 2016, record high temperatures at 20-m depth occurred at all permafrost observatories on the North Slope of Alaska except Deadhorse (Fig 2a) (Romanovsky et al., 2017). Since 2000, temperature at 20-m depth in this region has increased between 0.21° C and 0.66° C per decade (Fig. 2a; Table 1). Following the slight cooling of 2007-2013, permafrost temperatures increased in Interior Alaska at all sites, with especially strong increase at Birch Lake, associated with a new record high in 2016 for the entire 32 years of measurements (Fig. 2b; Table 1).
In northwestern Canada, the temperature of permafrost in the central Mackenzie Valley has generally increased since the mid-1980s, with less warming observed since 2000 (Norman Wells and Wrigley in Fig. 2b; Table 1), corresponding to a period of steady air temperatures (Smith et al., 2016). In contrast, greater recent warming has been observed in the colder permafrost of the northern Mackenzie (Norris Ck, KC-07 in Fig. 2a; Table 1), reflecting relatively higher increase in air temperatures over the last decade in this region (Fig. 1) (Smith et al., 2016).
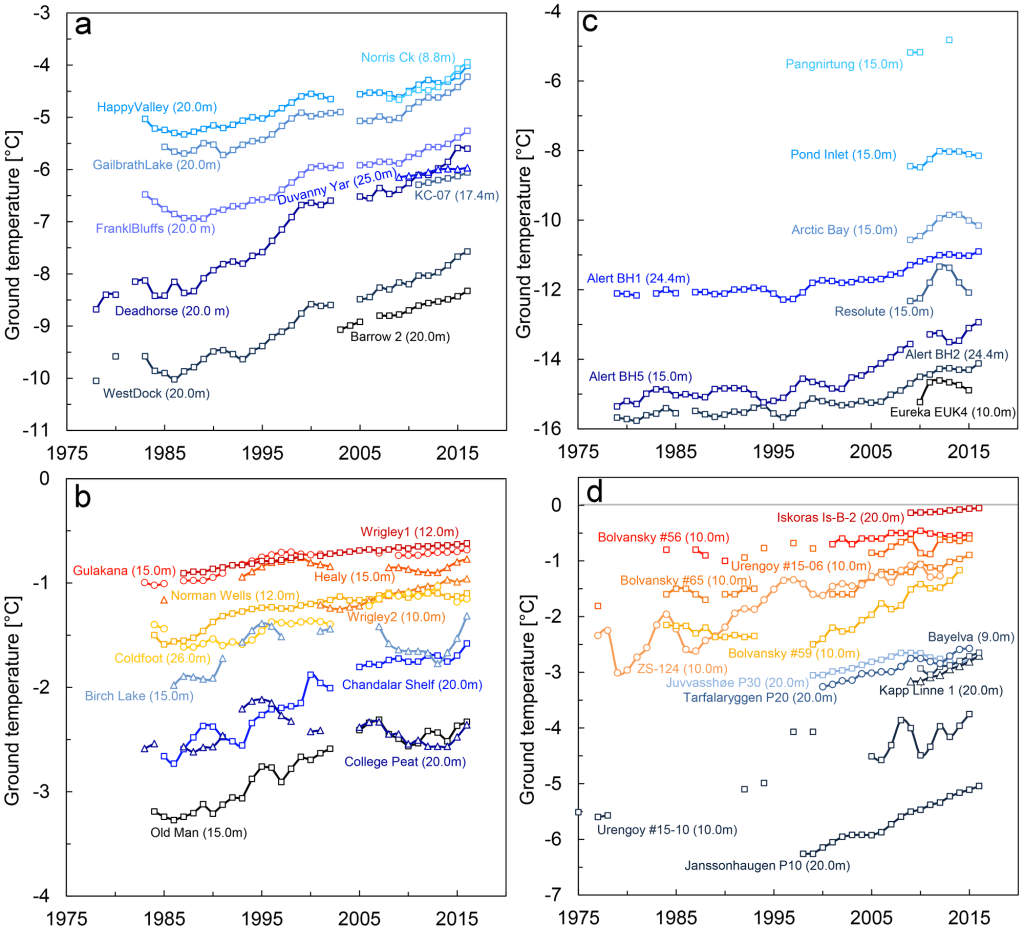
In northeastern Canada, the most recent mean permafrost temperatures in the upper 25 m of the ground at Alert, northernmost Ellesmere Island in the high Arctic, were among the highest recorded since 1978 (Fig. 2c). Although permafrost at Alert has generally warmed since 1978, the highest rate of permafrost temperature increase occurred between 2000-2010 (Table 1) (Smith et al., 2015), consistent with air temperature trends (Fig. 1). There has been little change since 2010 (Fig. 2c), which coincides with a period of lower surface air temperatures. Short records, from other sites to the south in the Queen Elizabeth Islands (Resolute and Eureka) and on Baffin Island (Pond Inlet, Arctic Bay) show a general warming of permafrost at 10-15 m depth since 2008 (Fig. 2c, Table 1) with some cooling since 2012. The difference between the regional tendencies in permafrost temperature is likely related to regional variation is surface air temperatures. Since 2012, there was a greater decrease in air temperature at Eureka and other sites farther south compared to Alert. Also, at the relatively shallow measurement depths, there remains some influence from seasonal variation in the ground temperatures. Therefore, ground temperature at the shallower sites are more responsive to shorter term fluctuations in air temperature.
Increases in permafrost temperature over the last 30-35 years in northern Russia have been similar to those in northern Alaska and the Canadian high Arctic. In the Russian European North and western Siberian Arctic, temperatures at 10-m depth have increased by ~0.4° C to 0.6° C decade-1 since the late 1980s at colder permafrost sites (Fig. 2d, Bolvansky #59, Urengoy #15-6 and #15-10) with less warming in warmer permafrost (Table 1, Fig. 2d, sites Bolvansky #56 and Urengoy #15-6; Drozdov et al., 2015). In these regions the differences in permafrost temperature (cold vs. warm) exist because of differences in surface conditions related to different types of landscape, while climatic conditions are largely consistent.
In Nordic regions, warming and thawing of permafrost have been observed recently (Christiansen et al., 2010; Isaksen et al., 2011; Farbrot et al., 2013). Since 2000, temperature at 20-m depth has increased between 0.1° C and 0.7° C per decade (Fig. 2d, Table 1). Lower rates of increase occur where permafrost temperatures are close to 0° C and latent heat effects related to melting ground ice in fine-grained material are important. Greater warming occurred in colder permafrost on Svalbard and in northern Scandinavia (Table 1). In the discontinuous permafrost zone of southern Norway, permafrost warmed in 2015 and 2016, following a period of cooling between 2011 and 2014 (Fig. 2d).
Active Layer Thickness
The average active-layer thickness (ALT; determined by mechanical probing and typically accurate to 0.5 cm) in 2016 for 20 North Slope sites was 0.52 m, which is 4 cm greater than the 1996-2016 average (Fig. 3). This value represents the 21-year maximum, which was previously achieved in 1998 and 2013 (Fig. 3). In the interior of Alaska ALT has on average increased by 0.14 m in 2016 compared to 2015 values. Three out of four Alaska Interior sites with 20 years of continuous observations reported absolute maximum ALT values in 2016. The previous maxima at these sites was achieved in 2015.
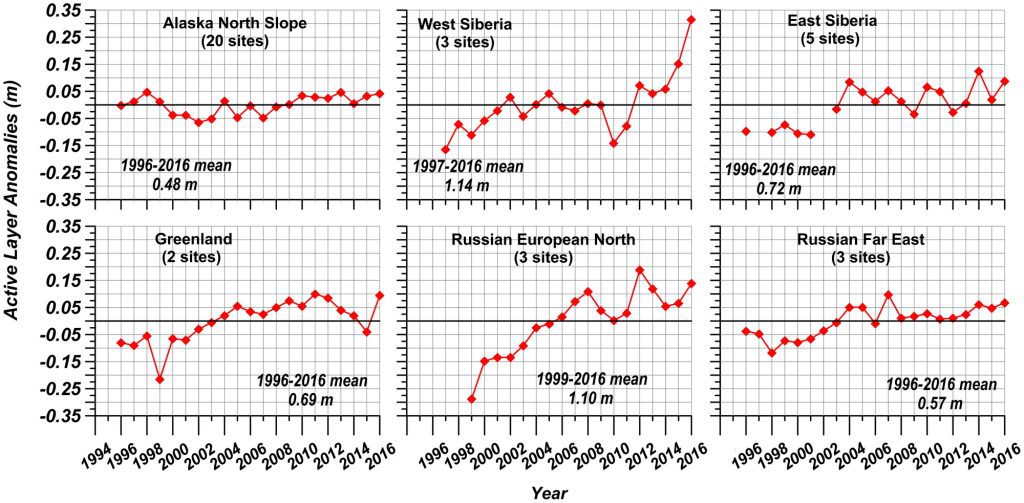
Records from 25 sites with thaw tubes in the Mackenzie Valley, northwestern Canada, indicate that overall there has been a general increase in ALT in this region since 2008 with a peak value occurring in 2012, about 10% greater than the 2003-2012 mean (Duchesne et al., 2015; Smith et al., 2016). Although ALTs were lower after 2012, they are on average greater than the 2003-2012 mean.
In West Siberia, the active-layer thickness increased by an average of 0.16 m in 2016, reaching 1.45 m, the highest recorded thickness in 20 years of observations. The previous maximum was 1.29 m in 2015. Similarly, the ALT in 2016 has substantially increased in Russian European North. Slight ALT increase in 2016 was observed in East Siberia and Chukotka (Russian Far East) (Fig. 3). In central Siberia ALT remained unchanged in 2016.
Significant (0.15 m) ALT increase in 2016 was reported for Greenland sites. Such increase has reversed a monotonic ALT decline observed since 2010. Similarly, the increase in ALT was observed on Svalbard where 2016 active-layer thickness reached its maximum and increased by 15% compared to the 2000-2015 mean.
In the Nordic countries, active layer records (1999-2016) indicate a general increase of 0.10 to 0.30 m in ALT since 1999. The summer of 2014 was particularly warm in the Nordic countries and contributed to the thickest active layer measured so far at some places.
| Region | Sites | Entire Record (see Fig. 2) |
Since 2000 |
|---|---|---|---|
| Alaskan Arctic plain | West Dock (WD), Deadhorse (De), Franklin Bluffs (FB), Barrow (Ba) | +0.36 to +0.8 | +0.44 to +0.65 |
| Northern foothills of the Brooks Range, Alaska | Happy Valley (HV), Galbraith Lake (GL) | +0.3 to +0.42 | +0.34 to +0.47 |
| Southern foothills of the Brooks Range, Alaska | Coldfoot (Co), Chandalar Shelf (CS), Old Man (OM) | +0.08 to +0.35 | +0.14 to +0.25 |
| Interior Alaska | College Peat (CP), Birch Lake (BL), Gulkana (Gu), Healy (He) | +0.07 to +0.22 | +0.03 to +0.1 |
| Central Mackenzie Valley | Norman Wells (NW), Wrigley (Wr) | Up to +0.1 | <+0.1 to +0.2 |
| Northern Mackenzie Valley | Norris Ck (No), KC-07 (KC) | NA | +0.4 to +0.8 |
| Baffin Island | Pond Inlet (PI), Arctic Bay | NA | +0.5 to +0.7 |
| High Canadian Arctic | Resolute (Re), Eureka (Eu) | NA | +0.4 to +0.7 |
| High Canadian Arctic | Alert (Al) @ 15 m 24 m |
+0.5 +0.3 to +0.4 |
+1.2 +0.7 to +1 |
| North of East Siberia | Duvany Yar (DY) | +0.3 | |
| North of West Siberia | Urengoy 15-06 and 15-10 (Ur) | +0.31 to +0.47 | +0.1 to +0.19 |
| Russian European North | Bolvansky 56, 59, and 65 (Bo), Polar Ural (ZS-124) | +0.18 to +0.46 | +0.1 to +0.83 |
| Svalbard | Janssonhaugen (Ja), Bayelva (Ba), Kapp Linne 1 (KL) | +0.7 | +0.6 to +0.7 |
| Northern Scandinavia | Tarfalarggen (Ta), Iskoras Is-B-2 (Is) | NA | +0.1 to +0.4 |
| Southern Norway | Juvvasshøe (Ju) | +0.2 | +0.2 |
References
Boike, J., I. Juszak, S. Lange, S. Chadburn, E. Burke, P. P. Overduin, K. Roth, O. Ippisch, N. Bornemann, L. Stern, I. Gouttevin, E. Hauber, and S. Westermann, 2017: A 20-year record (1998-2017) of permafrost, active layer, and meteorological conditions at a High Arctic permafrost research site (Bayelva, Spitsbergen): an opportunity to validate remote sensing data and land surface, snow, and permafrost models, Earth System Science Data Discussions, 1-86, doi: 10.5194/essd-2017-100.
Christiansen, H. H., B. Etzelmüller, K. Isaksen, H. Juliussen, H. Farbrot, O. Humlum, M. Johansson, T. Ingeman-Nielsen, L. Kristensen, J. Hjort, P. Holmlund, A. B. K. Sannel, C. Sigsgaard, H. J. Åkerman, N. Foged, L. H. Blikra, M. A. Pernosky, and R. Ødegård, 2010: The thermal state of permafrost in the Nordic area during the International Polar Year, Permafrost and Periglacial Processes, 21, 156-181, doi: 10.1002/ppp.687.
Drozdov, D., Y. Rumyantseva, G. Malkova, V. Romanovsky, A. Abramov, P. Konstantinov, D. Sergeev, N. Shiklomanov, A. Kholodov, O. Ponomareva, and D. Streletskiy, 2015: Monitoring of permafrost in Russia and the international GTN-P project. 68th Canadian Geotechnical Conference – GEOQuébec 2015, Québec, Canada, September 20-23, 2015.
Duchesne, C., S. L. Smith, M. Ednie, and P. P. Bonnaventure, 2015: Active layer variability and change in the Mackenzie Valley, Northwest Territories. Paper 117. In GEOQuébec 2015 (68th Canadian Geotechnical Conference and 7th Canadian Conference on Permafrost). Québec. GEOQuébec 2015 Organizing Committee.
Ednie, M., and S. L. Smith, 2015: Permafrost temperature data 2008-2014 from community based monitoring sites in Nunavut, Geological Survey of Canada Open File, 7784.
Farbrot, H., K. Isaksen, B. Etzelmüller, and K. Gisnås, 2013: Ground thermal regime and permafrost distribution under a changing climate in northern Norway. Permafrost and Periglacial Processes, 24, 20-38. doi: 10.1002/ppp.1763.
Isaksen, K., R. S. Ødegård, B. Etzelmüller, C. Hilbich, C. Hauck, H. Farbrot, T. Eiken, H. O. Hygen, and T. F. Hipp, 2011: Degrading mountain permafrost in southern Norway: spatial and temporal variability of mean ground temperatures, 1999-2009, Permafrost and Periglacial Processes, 22, 361-377, doi: 10.1002/ppp.728.
Kalnay, E., M. Kanamitsu, R. Kistler, W. Collins, D. Deaven, L. Gandin, M. Iredell, S. Saha, G. White, J. Woollen, Y. Zhu, A. Leetmaa, R. Reynolds, M. Chelliah, W. Ebisuzaki, W. Higgins, J. Janowiak, K. C. Mo, C. Ropelewski, J. Wang, R. Jenne, and D. Joseph, 1996: The NCEP/NCAR 40-Year Reanalysis Project. Bulletin of American Meteorological Society, 77, 437-471, doi: 10.1175/1520-0477(1996)077<0437: TNYRP>2.0.CO;2.
Romanovsky, V. E, W. L. Cable, and A. L. Kholodov, 2015: Changes in Permafrost and Active-layer Temperatures along an Alaskan Permafrost-Ecological Transect. Paper 479. In GEOQuébec 2015 (Proceedings 68th Canadian Geotechnical Conference and 7th Canadian Conference on Permafrost). Québec. GEOQuébec 2015 Organizing Committee.
Romanovsky, V. E., S. L. Smith, N. I. Shiklomanov, D. A. Streletskiy, K. Isaksen, A. L. Kholodov, H. H. Christiansen, D. S. Drozdov, G. V. Malkova, and S. S. Marchenko, 2017: [Arctic] Terrestrial Permafrost [in “State of the Climate in 2016”]. Bulletin of the American Meteorological Society (supplement), 98(8): S147-S151.
Smith, S. L., A. G. Lewkowicz, C. Duchesne, and M. Ednie, 2015: Variability and change in permafrost thermal state in northern Canada. Paper 237. In GEOQuébec 2015 (Proceedings 68th Canadian Geotechnical Conference and 7th Canadian Conference on Permafrost). Québec. GEOQuébec 2015 Organizing Committee.
Smith, S. L., J. Chartrand, C. Duchesne, and M. Ednie, 2016: Report on 2015 field activities and collection of ground thermal and active layer data in the Mackenzie Corridor, Northwest Territories, Geological Survey of Canada Open File 8125.
November 28, 2017