C. Derksen1, R. Brown1, L. Mudryk1, K. Luojus2
1Climate Research Division, Environment Canada, Toronto, Canada
2Arctic Research Centre, Finnish Meteorological Institute, Helsinki, Finland
Highlights
- Spring (April, May, June) snow cover extent (SCE) over Arctic land areas has undergone significant reductions over the period of satellite observations (which start in 1967), particularly since 2005. In 2016, new record low April and May SCE was reached for the North American Arctic, with May SCE falling below 4 million km2 for the first time in the satellite era; the 3rd lowest June SCE occurred over both the North American and Eurasian sectors of the Arctic.
- Total Arctic SCE in June fell below 3 million km2 for the sixth time in the past seven years due to earlier than normal snow melt across Alaska, the western Canadian Arctic, and Scandinavia.
- Warming Arctic surface temperatures have a clear influence on the timing of snow melt, although there is also evidence of decreasing pre-melt snow mass (reflective of shallower snow) which may pre-condition the snowpack for earlier and more rapid melt.
Snow cover is a defining characteristic of the Arctic land surface for up to 9 months each year, evolving from complete snow cover in the winter to a near total loss of snow cover by the summer. Highly reflective snow cover acts to cool the climate system, effectively insulates the underlying soil, and stores and redistributes water in solid form through the accumulation season before spring melt. Snow on land in spring has undergone significant reductions in areal extent during the satellite era, which impacts the surface energy budget, ground thermal regime (with associated effects on geochemical cycles), and hydrological processes. The loss of spring snow cover is a clear indicator of change in the terrestrial cryosphere, much in the same way summer sea ice loss is indicative of changes in the marine cryosphere.
Snow cover extent (SCE) anomalies for the Arctic (land areas north of 60N) spring (April, May, June) 2016 were computed separately for the North American and Eurasian sectors of the Arctic (Fig. 2.1a-c). The anomalies are assessed relative to the 1981-2010 reference period, from the NOAA snow chart climate data record, which extends from 1967 to present (maintained at Rutgers University; Estilow et al., 2015; http://climate.rutgers.edu/snowcover/). SCE anomalies over the North American sector of the Arctic were strongly negative in all three months: new record low anomalies were set for April and May, with the third lowest values in the NOAA dataset observed in June. Eurasian SCE anomalies were also negative in all three spring months, reaching the third lowest in the NOAA time series in June.

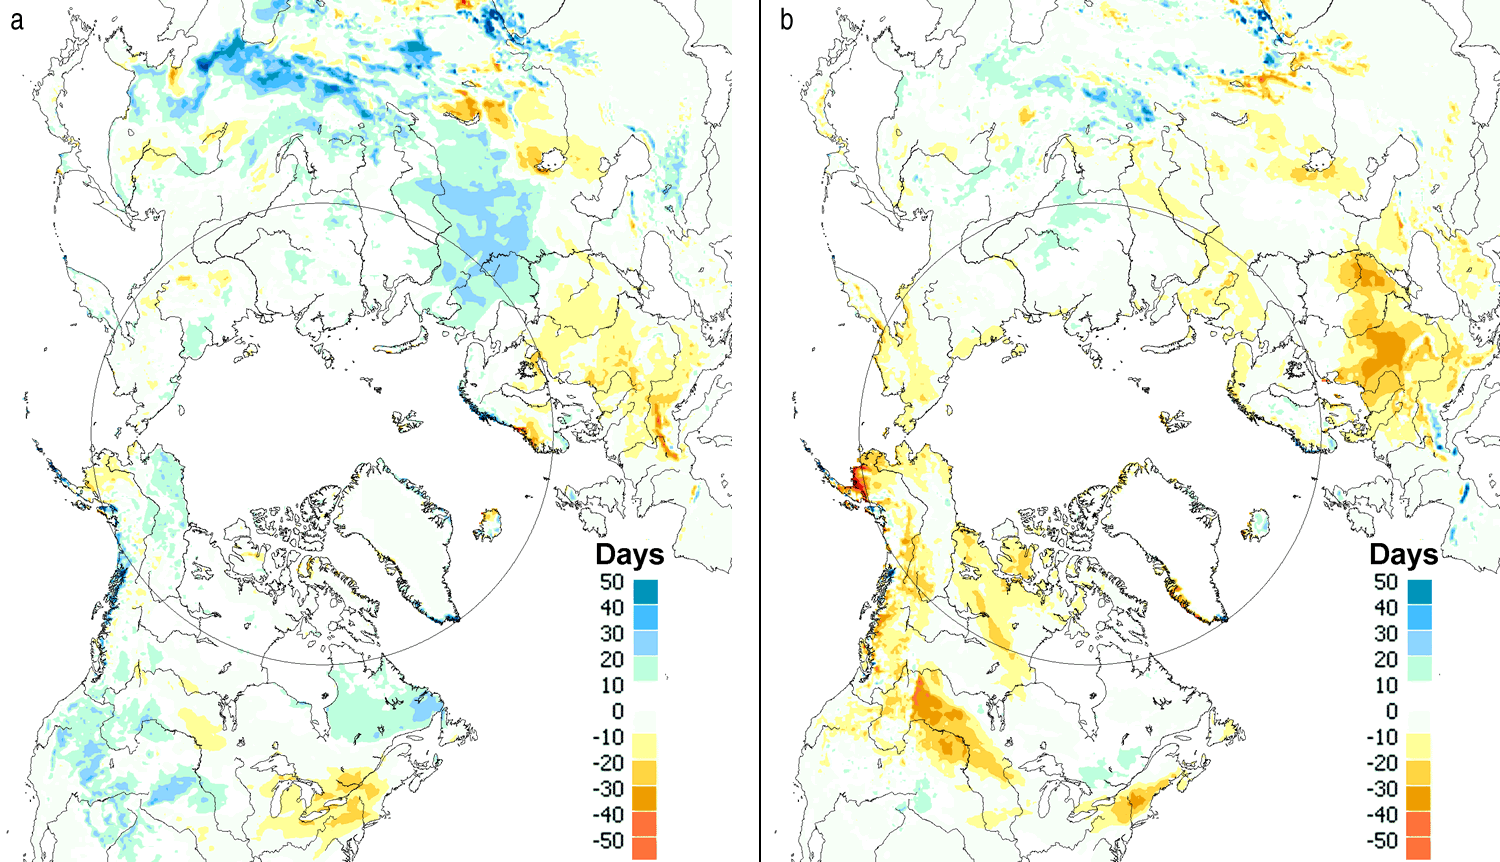
Snow cover duration (SCD) departures (Fig. 2.2) derived from the NOAA daily Interactive Multisensor Snow and Ice Mapping System (IMS) snow cover product (Helfrich et al., 2007) show earlier snow cover onset in the fall over much of the Arctic (defined as land areas north of 60° N), except Scandinavia. Spring snow cover duration departures were primarily negative (earlier snow melt), with the strongest departures over Alaska, the western Canadian Arctic, and Scandinavia/western Russia. This is consistent with the pattern of positive surface temperature anomalies in spring, which were positive over all Arctic land areas with the exception of eastern North America (see essay on Surface Air Temperature).


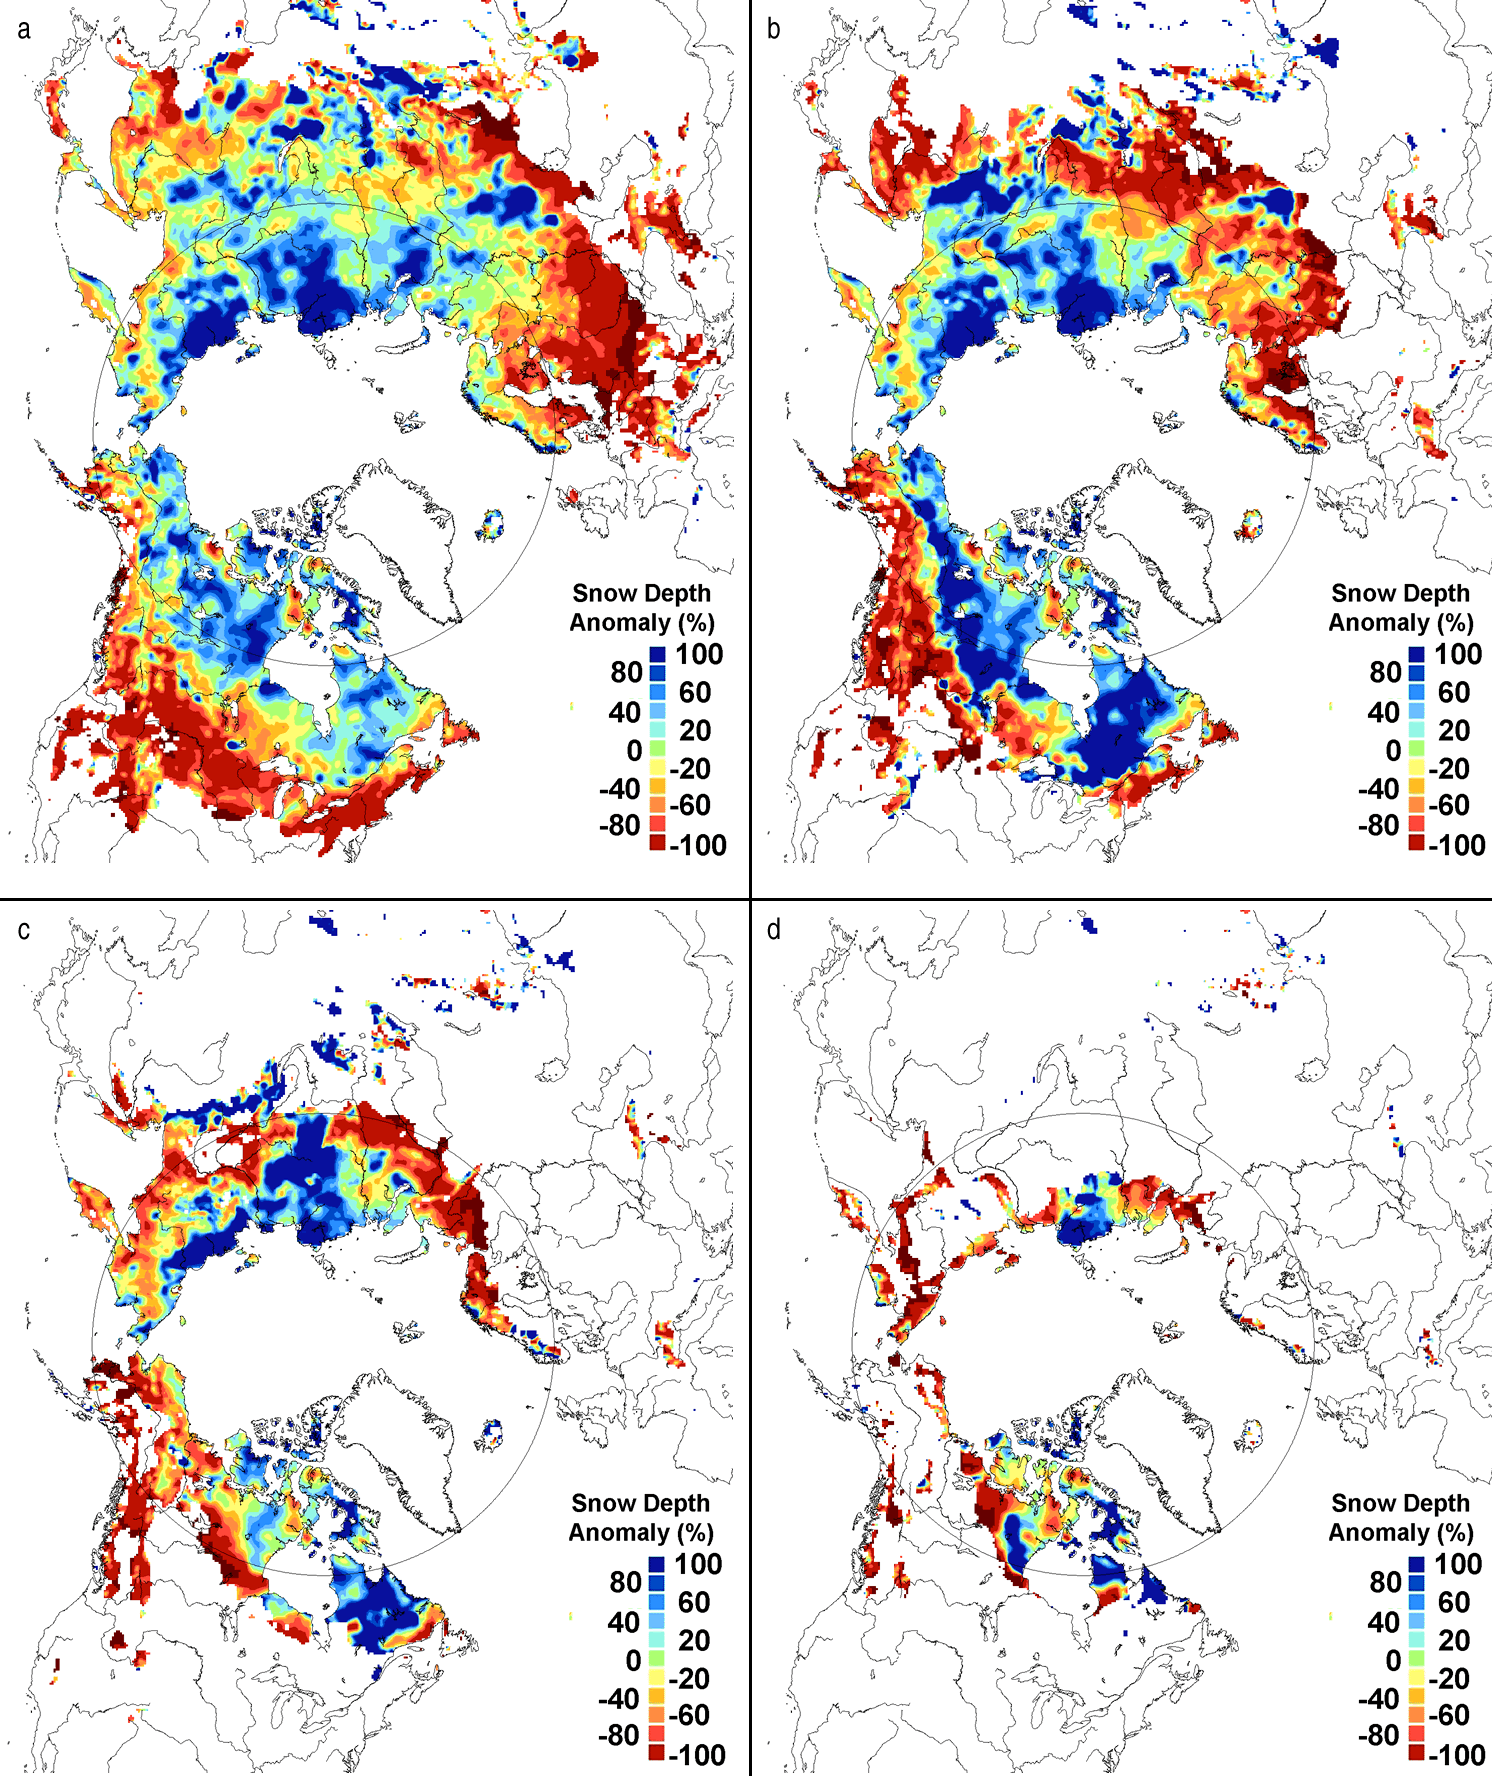
Snow depth anomalies (Fig. 2.3; derived from the Canadian Meteorological Centre daily gridded global snow depth analysis; Brasnett, 1999) show a pattern similar to that observed in 2015 (Derksen et al., 2016): negative anomalies (i.e. relatively low snow depth) across the sub-Arctic surrounded mainly positive anomalies over the high latitude regions of Siberia and North America in March and April. By May, the North America snow depth anomalies changed to strongly negative (mean anomaly of -10.7%) consistent with the record low SCE values reported above. May snow depth anomalies over Eurasia were near normal (-0.6%) but plummeted to -29.2% in June.


Time series of pan-Arctic snow extent from the NOAA dataset for May and June are shown in Fig. 2.4a over the 1979-2016 time period, which corresponds to the satellite passive microwave data record used to monitor sea ice variability and change. Although falling below 11 million km2 only three times between 1979 and 2009, May SCE has been below this level every year since 2009. Until 2008, June snow cover was below 4 million km2 only once (1990), yet it has been below this value every year since. The rate of change in May SCE in the NOAA snow chart data record is now -5.0% per decade, which is significant (95%) but dwarfed by the rate of -17.8% per decade in June, which exceeds the pace of summer sea ice reductions in September (-13.3% per decade) (see essay on Sea Ice). There is currently no evidence of any physical links between changes in snow and sea ice extent but it is instructive to compare the rates of observed change over the terrestrial (snow) and marine (sea ice) components of the cryosphere.


The link between temperature and snow cover extent in spring is very logical and straightforward: there is a strong association between the magnitude of spring warming and snow cover extent loss in both observational datasets and climate model simulations (Thackeray et al., in press). There is also evidence of decreasing pre-melt snow mass (less water stored in solid form by snow) in the GlobSnow data record (Takala et al., 2011) which combines surface snow depth observations from weather stations with satellite passive microwave measurements. The trend in April snow mass (the month of peak pre-melt Arctic snow mass) is -4.3% per decade, with April 2016 having the lowest value in the record (Fig. 2.4b). While early snow melt in previous years occurred despite above average snow mass (for example, 2011 and 2012) a shallower snowpack combined with above average temperatures does create ideal conditions for early and rapid snow melt, reflected in the new record low SCE values observed in 2016.
Seasonal snow cover in the Arctic is in a period of rapid change. We rely heavily on satellite observations and models to monitor and understand snow processes, variability, and trends across Arctic land areas because of the very sparse network of surface observations. It remains a challenge, particularly in an era of decreasing conventional observations of Arctic snow, to disentangle the complex interplay between snow extent, snow mass, surface temperature, and snowfall anomalies which have such an important impact on Arctic land surface processes.
References
Brasnett, B., 1999: A global analysis of snow depth for numerical weather prediction. J. Appl. Meteorol., 38, 726-740.
Cavalieri, D. J., C. L. Parkinson, P. Gloersen, and H. J. Zwally, 1996, updated yearly: Sea Ice Concentrations from Nimbus-7 SMMR and DMSP SSM/I-SSMIS Passive Microwave Data, Version 1 [1979-2014]. Boulder, Colorado USA. NASA National Snow and Ice Data Center Distributed Active Archive Center. http://dx.doi.org/10.5067/8GQ8LZQVL0VL.
Derksen, C., R. Brown, L. Mudryk, and K. Luojus, 2016: Terrestrial Snow (Arctic). In State of the Climate in 2015. Bull. Am. Met. Soc., 97, S145-S147.
Estilow, T. W., A. H. Young, and D. A. Robinson, 2015: A long-term Northern Hemisphere snow cover extent data record for climate studies and monitoring. Earth Sys. Sci. Data, 7.1: 137-142.
Helfrich, S., D. McNamara, B. Ramsay, T. Baldwin, and T. Kasheta, 2007: Enhancements to, and forthcoming developments in the Interactive Multisensor Snow and Ice Mapping System (IMS). Hydrol. Process., 21, 1576-1586.
Maslanik, J. and J. Stroeve, 1999, updated daily: Near-Real-Time DMSP SSMIS Daily Polar Gridded Sea Ice Concentrations, Version 1. [September 2015]. Boulder, Colorado USA. NASA National Snow and Ice Data Center Distributed Active Archive Center. http://dx.doi.org/10.5067/U8C09DWVX9LM.
Takala, M., K. Luojus, J. Pulliainen, C. Derksen, J. Lemmetyinen, J. -P. Kärnä, and J. Koskinen, 2011: Estimating northern hemisphere snow water equivalent for climate research through assimilation of space-borne radiometer data and ground-based measurements. Remote Sens. Environ., 115, 3517-3529.
Thackeray, C., C. Fletcher, L. Mudryk, and C. Derksen, In press: Quantifying the uncertainty in historical and future simulations of Northern Hemisphere spring snow cover. J. Clim. doi: http://dx.doi.org/10.1175/JCLI-D-16-0341.1.
November 15, 2016