
J. Overland1, E. Hanna2, I. Hanssen-Bauer3, S. -J. Kim4, J. E. Walsh5, M. Wang6, U. S. Bhatt7, R. L. Thoman8
1NOAA/PMEL, Seattle, WA, USA
2Department of Geography, University of Sheffield, Sheffield, UK
3Norwegian Meteorological Institute, Blindern, 0313 Oslo, Norway
4Korea Polar Research Institute, Incheon, Republic of Korea
5International Arctic Research Center, University of Alaska Fairbanks, Fairbanks, AK, USA
6Joint Institute for the Study of the Atmosphere and Ocean, University of Washington, Seattle, WA, USA
7Geophysical Institute, University of Alaska Fairbanks, Fairbanks, AK, USA
8NOAA, National Weather Service, Alaska Region, USA
Highlights
- The average annual surface air temperature anomaly over land north of 60° N for October 2015-September 2016 (+2.0° C, relative to a 1981-2010 baseline) was by far highest in the observational record beginning in 1900; this represents a 3.5° C increase since the beginning of the 20th Century.
- Arctic temperatures continue to increase at double the rate of the global temperature increase.
- Extreme Arctic-wide air warm temperatures in winter 2016 (Jan-Mar) greatly exceeding the previous record; several locations showed January anomalies exceeding +8° C. These conditions were primarily due to southerly winds moving warm air into the Arctic from mid-latitudes and the presences of sea ice free areas to the northeast of Novaya Zemlya.
- Neutral to cold temperature anomalies occurred across the central Arctic Ocean in summer 2016; a condition which did not support rapid summer sea ice loss.
Arctic air temperature is an indicator of regional and global climate change. Although there are year-to-year and regional differences in air temperatures due to natural variability, the magnitude and Arctic-wide character of the long-term temperature increase is a major indicator of global warming and the influence of increases in Greenhouse gases (Overland, 2009; Notz and Stroeve, 2016). Here we report on the spatial and temporal variability of Arctic air temperatures during the period October 2015 through September 2016, the 12-month period since the end of the previous Arctic Report Card reporting period.
Mean Annual Land Surface Temperature
The mean annual surface air temperature anomaly (+2.0° C relative to the 1981-2010 mean value) for October 2015-September 2016 for land stations north of 60° N is the highest value in the record starting in 1900 (Fig. 1.1). This is an increase of 3.5° C since the beginning of the 20th Century, and the largest annual increase since 1995. Currently, the Arctic is warming at more than twice the rate of lower latitudes (Fig. 1.1).
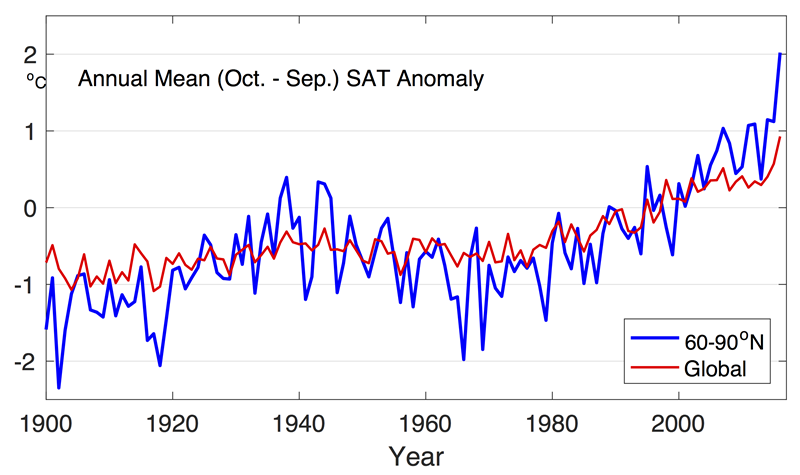
The greater rate of Arctic temperature increase than the global increase is referred to as Arctic Amplification. Mechanisms for Arctic Amplification include: reduced summer albedo due to sea ice and snow cover loss, the increase of total water vapor content in the Arctic atmosphere, a decrease of total cloudiness in summer and increase in winter (Makshtas et al. 2011), the additional heat generated by newly sea-ice free ocean areas that are maintained later into the autumn (Serreze and Barry 2011), and the lower rate of heat loss to space in the Arctic relative to the sub-tropics due to lower mean temperatures (Pithan and Mauritsen 2014). More research is needed to quantify such contributions. Further, Arctic warming has been influenced by past air pollution reductions in Europe (Acosta Navarro et al. 2016). However, increases in 2016 Arctic temperatures has a strong natural variability component from the supply of warm air originating in mid-latitudes, as described in the next two sections.
Seasonal Surface Air Temperature Variation
Seasonal air temperature variations are divided into autumn 2015 (October, November, December [OND]), and winter (January, February, March [JFM]), spring (April, May, June [AMJ]) and summer (July, August, September [JAS]) of 2016. These seasonal divisions are chosen for SAT to coincide with some key Arctic climate (December is still cooling down) and sea ice divisions (September is summer sea ice minimum month). Autumn, Spring and especially Winter show extensive positive temperature anomalies across the central Arctic (Fig. 1.2).
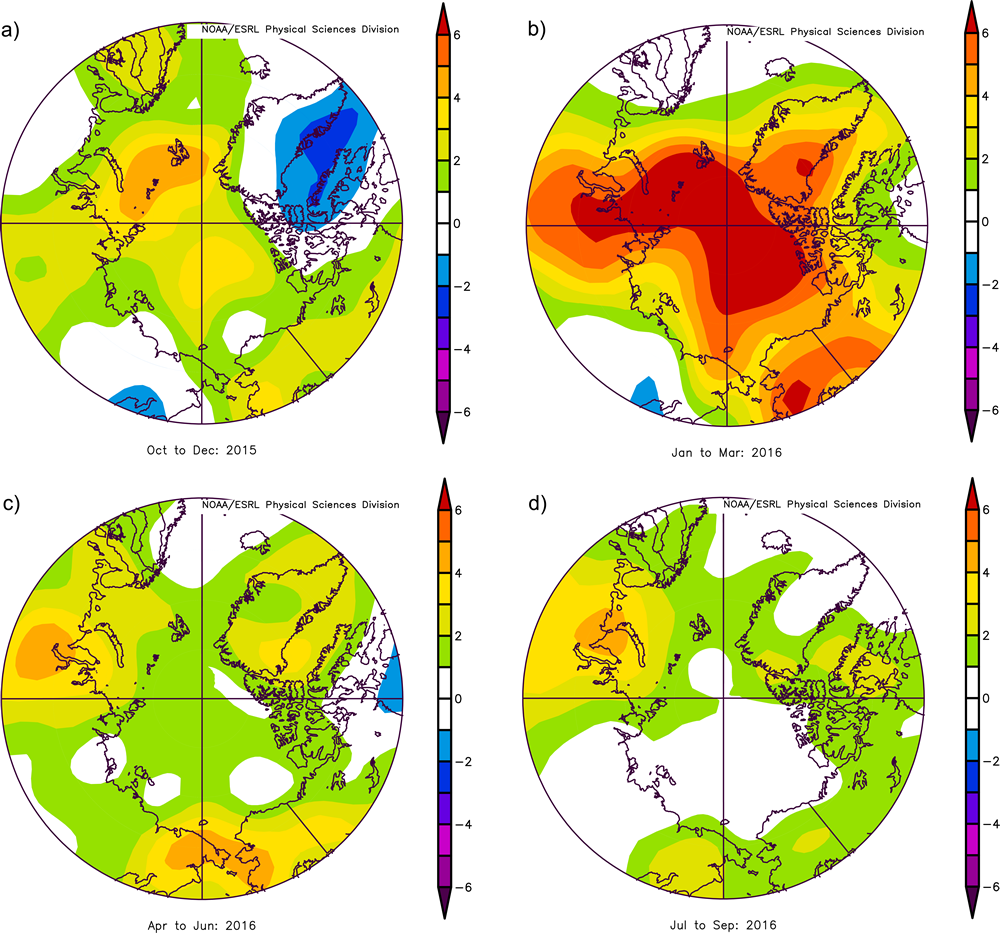
Autumn 2015 (OND). A broad swath of warm temperature anomalies stretched across the Arctic, extending from the Pacific to the Atlantic sectors (Fig. 1.2a). The warmest temperature anomalies, centered on western Alaska and the Atlantic sector in northern Barents Sea, were due to advection of warm air from the south. In the Spitsbergen area the 3-month mean temperatures are 4 to 6° C above 1961-90 average.
Winter 2016 (JFM). Extreme record warm temperature anomalies extend across the Arctic, from the Pacific to the Atlantic sector (Fig. 1.2b). For January, the Arctic-wide averaged temperature anomaly was 2.0° C above the previous record of 3.0° C, and local extremes exceeded 8° C (Overland and Wang 2016). The warmest temperature anomalies were centered on Alaska, Svalbard in the Atlantic sector, and the central Arctic. In the Spitsbergen area the 3-month winter mean temperatures were 8 to 11° C above 1961-90 average. Temperature anomalies for coastal Greenland locations were warmer in the north (see essay on Greenland Ice Sheet). In contrast, there was a severe cold temperature surge into China from the north (Fig. 1.2b). The only region that did not experience warm winter temperature extremes was Scandinavia, where temperatures were near the mean. The cause of these extreme temperature are described further in the section below on Arctic and Mid-latitudes Connections.
Spring 2016 (AMJ). A broad swath of warm, but smaller magnitude, temperature anomalies continued to stretch across the central Arctic. Extremes continued in the periphery near Bering Strait, northern Greenland and eastern Russia (Fig. 1c).
Summer 2016 (JAS). The warm winter/spring conditions of 2016 did not continue through the summer months. Summer 2016 also contrasts to warm conditions in much of the previous decade (Fig. 1.2d). Neutral to cold anomalies occurred across the central Arctic in summer 2016, which did not support rapid summer sea ice loss (see essay on Sea Ice). Subarctic regions had warm anomalies in central Alaska, east Siberia, northern Baffin Bay and the southern Kara Sea. Alaska had the second warmest summer on record with more convective type clouds than normal. Alaska daily temperature anomalies (25-station average) were above normal during January-September 2016. August 2016 was the 69th successive month with temperature above the 1961-1990 climatology at Svalbard Airport.
Arctic and Mid-latitudes Connections
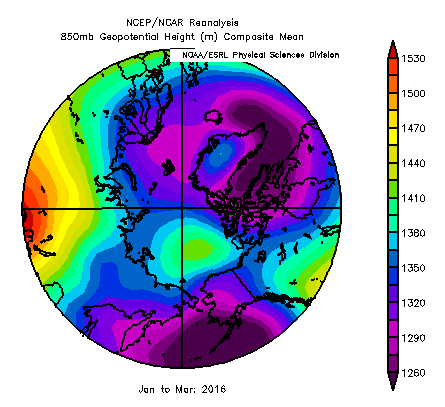
Record winter temperature conditions in the Arctic were primarily a response to southerly winds advecting warm air into the Arctic from mid-latitudes. This pattern began in the autumn 2015 with the development of strong low pressure in the North Atlantic and the Bering Sea that directed air trajectories toward the Arctic. Alaska and the Atlantic Arctic were anomalously warm in fall 2015, and continued to be so into winter and spring 2016 (Figs. 1.2a, 1.2b and 1.2c). The positive near-surface air temperature anomalies were associated with a persistent pattern of geopotential height field characterized by low values in the Barents Sea and Aleutian Islands and higher values in the central Arctic (Fig. 1.3). Winds tend to follow the contours of geopotential heights counter-clockwise around low values. Consequently, warm air over the northeast Pacific Ocean was advected into and across Alaska; north of the Kara Sea warm southerly winds extended across the central Arctic past the North Pole (i.e. follow purple contours in Fig. 1.3). Normally there is a single large Arctic region of low geopotential heights which establishes a tropospheric polar vortex (see for example Overland et al. 2015). In winter 2016 higher geopotential heights in the central Arctic split the polar vortex into two pieces. The persistence of warm Arctic temperatures was in part caused by a positive feedback, where advection of warm air temperatures contributes to increasing the geopotential heights over the central Arctic, which in turn helped to maintain the unusual 2016 wind pattern. Higher geopotential heights in the sub-Arctic over land along 90 E brought relatively colder air to western China.
Weather Connections to Sea Ice and Greenland
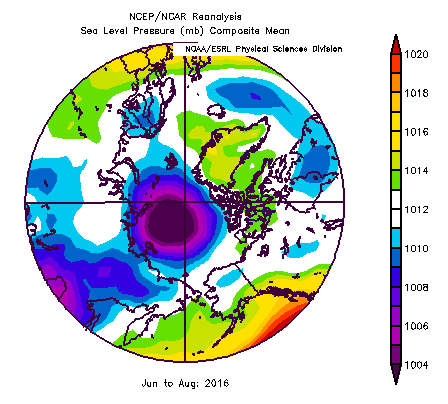
Extreme warm winter and spring air temperatures in 2016 contributed to record low sea ice extents at the beginning of the summer melt season (see essay on Sea Ice). But continued record sea ice loss over the summer was not to be. Neutral to cold temperature anomalies (Fig. 1.2d) contrasted to warmer conditions in previous major sea ice loss years (2007, 2012) (Overland et al 2015). The past decade often showed higher sea level pressures (SLP) and warm summer conditions. Summer Arctic 2016 was dominated by low SLP (Fig. 1.4), responsible for two major storms during August. While 2016 is the second lowest summer sea ice extent, the cause contrasted with previous major minimum years; 2016 conditions depended on low initial spring sea ice, rather than supportive summer weather with high SLP, as in recent years.
Summer 2016 saw an increased advection of relatively warm air into west Greenland (Fig 1.2d), consistent with having the second-highest Greenland Blocking Index (GBI) on record (beginning in 1851), after only 2012 (i. e. Hanna et al. 2016). The GBI reflects the distribution of high geopotential heights, responsible for diverting the jet stream location. As a result, melting occurred more frequently than average (relative to Julys spanning 1981 to 2010) along the northern half of the ice sheet (see essay on Greenland Ice Sheet).
References
Acosta Navarro, J. C. et al. (2016), Amplification of Arctic warming by past air pollution reductions in Europe. Nature Geosci. 9, 277-281.
Hanna, E., Cropper, T. E., Hall, R. J. and Cappelen, J. (2016), Greenland Blocking Index 1851-2015: a regional climate change signal. Int. J. Climatol., doi: 10.1002/joc.4673.
Makshtas A. P., I. I. Bolshakova, R. M. Gun, O. L. Jukova, N. E. Ivanov, and S. V. Shutilin, 2011: Climate of the Hydrometeorological Observatory Tiksi region. In Meteorological and Geophysical Investigations. Paulsen, 2011, 49-74.
Nordli, Ö, R. Przybylak, A. E. J. Ogilvie, and K. Isaksen (2014) Long-term temperature trends and variability on Spitsbergen: the extended Svalbard Airport temperature series, 1898-2012. Polar Res., 33, 21349.
Notz, D., and J. Stroeve, (2016), Observed Arctic sea-ice loss directly follows anthropogenic CO2 emission. Science, 10.1126/DOI: 10.1126/science.aag2345.
Overland, J. E., 2009: The case for global warming in the Arctic. In Influence of Climate Change on the Changing Arctic and Sub-Arctic Conditions, J. C. J. Nihoul and A. G. Kostianoy (eds.), Springer, 13-23.
Overland, J. E., E. Hanna, I. Hanssen-Bauer, B. -M. Kim, S. -J. Kim, J. Walsh, M. Wang, and U. Bhatt, 2015: Air Temperature. In Arctic Report Card: Update for 2015, ftp://ftp.oar.noaa.gov/arctic/documents/ArcticReportCard_full_report2014.pdf.
Overland, J. E., and M. Wang (2016): Recent extreme Arctic temperatures are due to a split polar vortex. J. Climate, 29(15), 5609-5616, doi: 10.1175/JCLI-D-16-0320.1.
Pithan, F. and T. Mauritsen, 2014: Arctic amplification dominated by temperature feedbacks in contemporary climate models. Nature Geoscience, doi: 10.1038/ngeo2071.
Serreze, M., and R. Barry, 2011: Processes and impacts of Arctic amplification: A research synthesis. Global and Planetary Change, 77, 85-96.
December 12, 2016