
D. Perovich1,2, W. Meier3, M. Tschudi4, S. Farrell5,
S. Gerland6, S. Hendricks7, T. Krumpen7, C. Haas7,8
1ERDC – CRREL, 72 Lyme Road, Hanover USA
2Thayer School of Engineering, Dartmouth College, Hanover, NH, USA
3NASA Goddard Space Flight Center, Greenbelt, MD, USA
4Aerospace Engineering Sciences, University of Colorado, Boulder, CO, USA
5NOAA Earth System Science Interdisciplinary Center, University of Maryland, College Park, MD, USA
6Norwegian Polar Institute, Fram Centre, Tromsø, Norway
7Alfred Wegener Institute, Helmholtz Centre for Polar and Marine Research, Bremerhaven, Germany
8Earth & Space Science & Engineering, York University, Toronto, Canada
Highlights
- The September 2016 Arctic sea ice minimum extent was 4.14 million km2, 33% lower than the 1981-2010 average minimum ice extent and tied with 2007 for the second lowest value in the satellite record (1979-2016).
- The lowest winter maximum ice extent in the satellite record (1979-2016) occurred on 24 March 2016, at 14.52 million km2, 7% below the 1981-2010 average.
- In March 2016, multiyear ice (more than 1 year old) and first-year ice were 22% and 78% of the ice cover, respectively, compared to 45% and 55% in 1985.
Sea Ice Extent
The Arctic sea ice cover is vast in areal extent covering millions of square kilometers, but is only a thin veneer a few meters thick. This ice cover plays many roles. It is a barrier limiting the exchange of heat, moisture, and momentum between the atmosphere and ocean; a home to a rich marine ecosystem, including human communities; and an indicator of climate change. Sea ice extent has been monitored using passive microwave instruments on satellite platforms since 1979. The months of September and March are of particular interest because they are the months when the Arctic sea ice typically reaches its maximum and minimum extent respectively. Maps of monthly average ice extents in March 2016 and September 2016 are shown in Fig. 4.1. The major difference in March 2016 compared to the 1981-2010 average was a large ice-free area north of Svalbard and Novaya Zemlya.
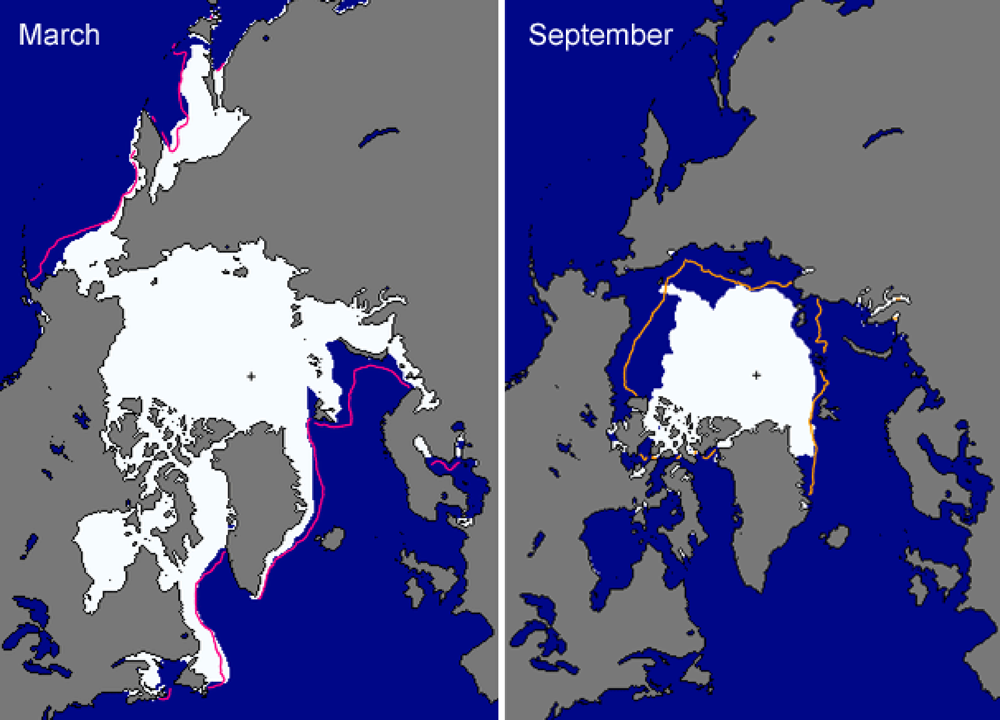
Based on estimates produced by the National Snow and Ice Data Center (NSIDC) Sea Ice Index (Fetterer et al., 2002), the sea ice cover reached a minimum annual extent of 4.14 million km2 on September 10, 2016. This matched 2007 as the second lowest minimum extent in the satellite record. The 2016 summer minimum extent is larger by 0.75 million km2 (22%) than the record minimum of 3.39 million km2 set in 2012. It was, however, 1.81 million km2 (29%) less than the 1981-2010 average minimum ice extent and 0.29 million km2 (6.5%) less than the 2015 minimum.
On March 24, 2016 ice extent reached a winter maximum value of 14.52 million km2, 7% below the 1981-2010 average. This matched 2015 as the lowest maximum value in the satellite record. Also notable, the maximum extent occurred 12 days later than the 1981-2010 average (12 March) and was the fourth latest of the satellite record. The date of the maximum has been trending slightly later (1.7 days per decade) over the satellite record, albeit with considerable year-to-year variability.
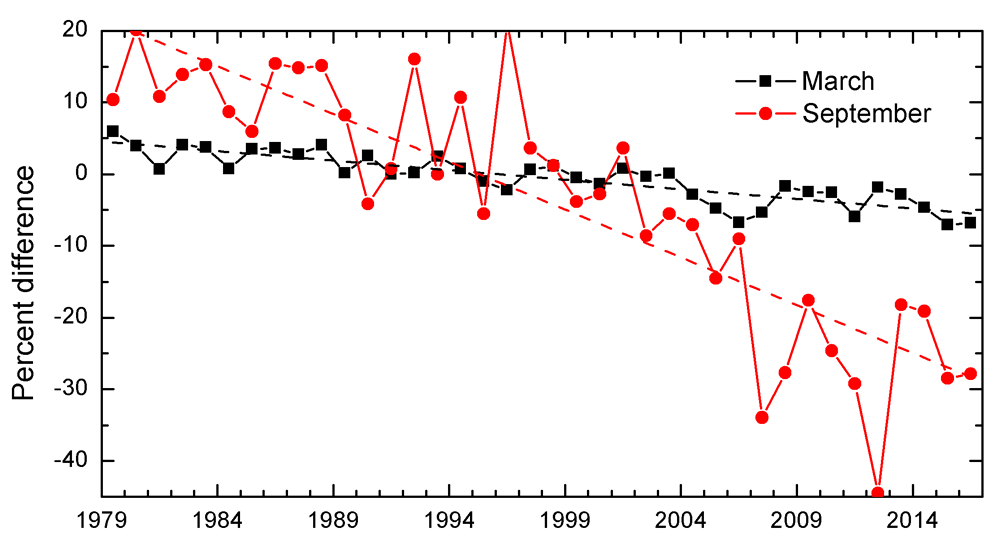
Sea ice extent has decreasing trends in all months and virtually all regions, the exception being the Bering Sea during winter (Meier et al., 2014). The September monthly average trend for the entire Arctic Ocean is now -13.3% per decade relative to the 1981-2010 average (Fig. 4.2). While the 2016 daily minimum ice extent was the second lowest on record, the monthly value (shown in Figure 4.2) was only the fifth lowest due to rapid ice formation in late September. Trends are smaller during March (-2.7% per decade), but are still decreasing at a statistically significant rate.
In 2016 year, 10.38 million km2 of ice was lost between the March maximum and September minimum extent. Before 2007, a March to September loss of more than 10 million km2 of ice occurred only once (1991), but since 2007 such large losses have occurred 7 out of 10 years.
Age of the Ice
The age of sea ice is another key descriptor of the state of the sea ice cover. It is an indicator for ice physical properties, including surface roughness, melt pond coverage and thickness. Older ice tends to be thicker and thus more resilient to changes in atmospheric and oceanic forcing than younger ice. The age of the ice is determined using satellite observations and drifting buoy records to track ice parcels over several years (Tschudi et al. 2010; Maslanik et al. 2011). This method has been used to provide a record of the age of the ice since the early 1980s (Tschudi et al. 2015).
The oldest ice (>4 years old) continues to make up a small fraction of the Arctic ice pack in March, when sea ice is at its maximum annual extent (Fig. 4.3). In 1985, 16% of the ice pack (relative to the total sea ice areal coverage) was four years old and older, but by March 2016 old ice only constituted 1.2% of the ice pack. First-year ice now dominates the ice cover, comprising about 78% of the March 2016 ice pack, compared to about 55% in the 1980s. The distribution of ice age in March 2016 was similar to that in March 2015. Given that older ice tends to be thicker, the sea ice cover has transformed from a strong, thick pack in the 1980s to a more fragile, younger, and thinner pack in recent years. The thinner, younger ice is more vulnerable to melting out in the summer, contributing to lower minimum ice extents.

Sea Ice Thickness
Observations of sea ice thickness and volume from multiple sources have revealed the continued decline of the Arctic sea ice pack over the last decade (Kwok and Rothrock 2009; Laxon et al. 2013; Kwok and Cunningham 2015; Lindsay and Schweiger, 2015). These changes have impacts on the regional Arctic and sub-Arctic climate, environment and ecosystems. To understand these impacts, as the Arctic transitions from a predominantly multi-year ice pack to a seasonal ice cover (Fig. 4.3), continued monitoring of the thickness of the ice pack is required. The European Space Agency CryoSat-2 satellite has been measuring sea ice freeboard (from which sea ice thickness and volume are derived) since 2010 (Tilling et al., 2015). Measurements of sea ice plus snow thickness by airborne electromagnetic induction sounding (AEM) from helicopters and aircrafts by various agencies have been made during late summer since 2001 (Haas et al. 2010).
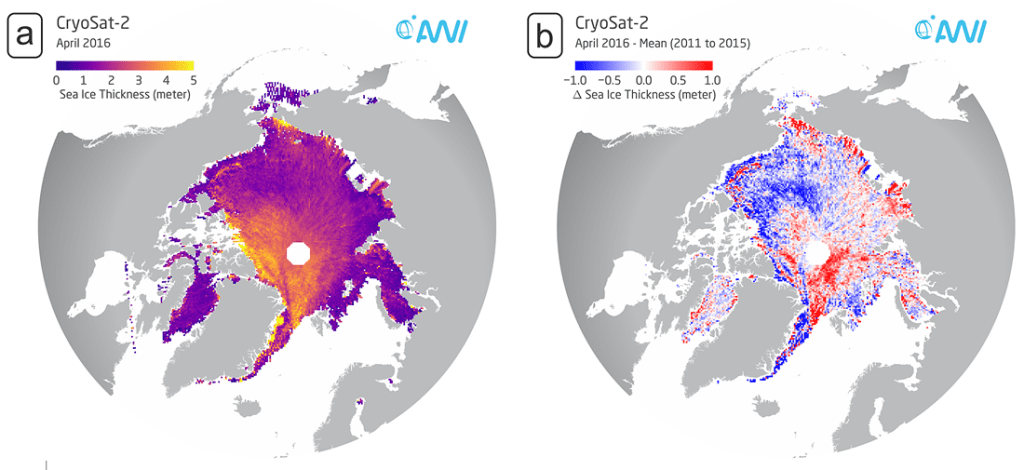
CryoSat-2 derived Arctic sea-ice thickness in April 2016 are presented in Fig. 4.4. The ice is near its maximum annual thickness in April at the end of winter. Also plotted is the 2016 anomaly compared to the average April values from 2011 to 2015. As in previous years, results show a thickness gradient across the central Arctic Ocean between the oldest, thickest ice near Greenland and the Canadian Arctic Archipelago (3-4 m), and younger ice in the Beaufort, East Siberian and Laptev Seas (≤2 m) (Fig. 4.4a). In the context of the average conditions, the April 2016 results (Fig. 4.4b) show two distinct features. The first was a band of thick multi-year ice in the southern and eastern Beaufort Sea that is surrounded by thinner ice (up to 1 m below average) in the western Beaufort Sea and Canada Basin. The second feature was a region with above average thickness north of Fram Strait in the Eurasian Basin. Airborne electromagnetic induction surveys (York University) obtained independent measurements of ice thickness in this region and confirmed the CryoSat-2 results. Such spatial and temporal variability in ice thickness results from variability in the motion of the ice. Areas of ice divergence typically have thinner ice while convergence ice causes ridging and thicker ice.
References
Fetterer, F., K. Knowles, W. Meier, and M. Savoie. 2002, updated daily. Sea Ice Index. Boulder, Colorado USA: National Snow and Ice Data Center. http://dx.doi.org/10.7265/N5QJ7F7W.
Haas, C., Hendricks S., Eicken H., Herber A.: Synoptic airborne thickness surveys reveal state of Arctic sea ice cover. Geophysical Research Letters 05/2010; 37(9). doi:10.1029/2010GL042652.
Kwok, R., and D. A. Rothrock, 2009: Decline in Arctic sea ice thickness from submarine and ICESat records: 1958-2008, Geophys. Res. Lett., 36, doi:10.1029/2009GL039035.
Kwok, R., and G. F. Cunningham, 2015: Variability of Arctic sea ice thickness and volume from CryoSat-2, Phil. Trans. Royal Soc. London A: Math., Phys. Eng. Sci., 373, 2045, doi.org/10.1098/rsta.2014.0157.
Laxon, S. W., K. A. Giles, A. L. Ridout, D. J. Wingham, R. Willatt, R. Cullen, R. Kwok, A. Schweiger, J. Zhang, C. Haas, S. Hendricks, R. Krishfield, N. Kurtz, S. L. Farrell, M. Davidson, 2013: CryoSat estimates of Arctic sea ice Volume, Geophys. Res. Lett., 40, doi:10.1002/grl.50193.
Lindsay, R. and A. Schweiger, 2015. Arctic sea ice thickness loss determined using subsurface, aircraft, and satellite observations. The Cryosphere, 9:269-283.
Maslanik, J., J. Stroeve, C. Fowler, and W. Emery, 2011: Distribution and trends in Arctic sea ice age through spring 2011. Geophys. Res. Lett., 38, doi: 10.1029/2011GL047735.
Meier, W. N., G. Hovelsrud, B. van Oort, J. Key, K. Kovacs, C. Michel, M. Granskog, S. Gerland, D. Perovich, A. P. Makshtas, and J. Reist, 2014. Arctic sea ice in transformation: A review of recent observed changes and impacts on biology and human activity, Rev. Geophys., 41, doi:10.1002/2013RG000431.
NSIDC at nsidc.org/data/seaice_index. Colorado USA. NASA National Snow and Ice Data Center Distributed Active Archive Center, doi.org/10.5067/1UQJWCYPVX61.
Tilling, R. L., A. Ridout, A. Shepherd, and D. J. Wingham, 2015; Increased Arctic sea ice volume after anomalously low melting in 2013. Nat. Geosci., 8, 643-646. doi:10.1038/ngeo2489.
Tschudi, M. A., C. Fowler, J. A. Maslanik, and J. A. Stroeve, 2010: Tracking the movement and changing surface characteristics of Arctic sea ice. IEEE J. Sel. Topics Earth Obs. and Rem. Sens., 3, doi: 10.1109/JSTARS.2010.2048305.
Tschudi, M., C. Fowler, and J. Maslanik, 2015: EASE-Grid Sea Ice Age, Version 2. Boulder, Colorado USA. NASA National Snow and Ice Data Center Distributed Active Archive Center, doi.org/10.5067/1UQJWCYPVX61.
December 22, 2016