
K. E. Frey1, J. C. Comiso2, L. W. Cooper3, R. R. Gradinger4, J. M. Grebmeier3, J. -É. Tremblay5
1Graduate School of Geography, Clark University, Worcester, Massachusetts, USA
2Cryospheric Sciences Laboratory, NASA Goddard Space Flight Center, Greenbelt, MD, USA
3Chesapeake Biological Laboratory, University of Maryland Center for Environmental Science, Solomons, MD, USA
4UiT, The Arctic University of Norway
5Québec-Océan and Takuvik, Biology Department, Université Laval, Québec City, QC, Canada
(See erratum, published in 2021)
Highlights
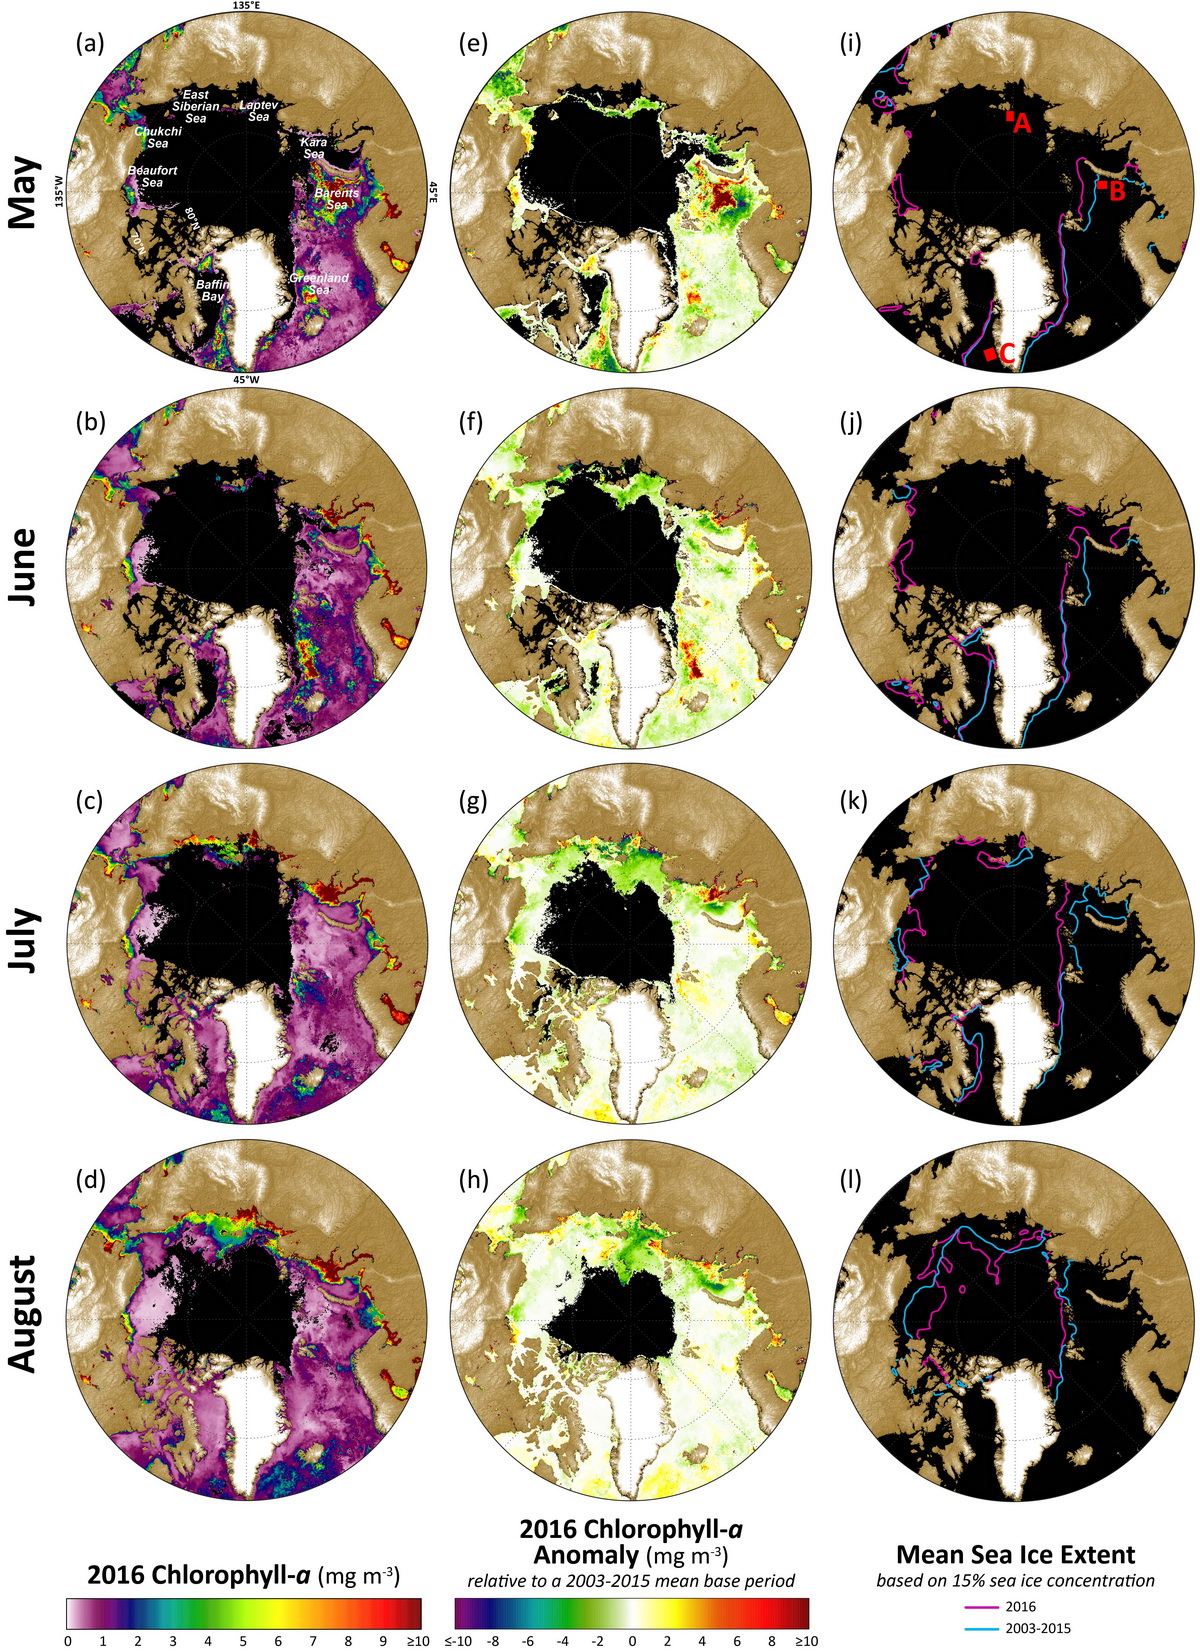
- During May 2016, chlorophyll-a concentrations averaged more than ~14 mg m-3 higher than the 2003-2015 mean across a relatively large (~300 x 300 km) region in the central Barents Sea. During June 2016 a ~150 x 750 km band in the Greenland Sea northeast of Greenland also experienced relatively high chlorophyll-a concentrations near the sea ice edge, where values were ~7 mg m-3 higher than the 2003-2015 mean.
- The steepest trends in chlorophyll-a concentrations over the years 2003-2016 have occurred during May in localized areas of the Barents Sea, with an overall positive trend averaging ~0.79 mg m-3 yr-1.
- Estimates of ocean primary productivity showed widespread positive anomalies for 2016, except for the western (North American) Arctic and the Sea of Okhotsk.
Introduction
Primary productivity is the rate at which atmospheric or aqueous carbon dioxide is converted by autotrophs (primary producers) to organic material. Primary production via photosynthesis is a key process within the ecosystem, as the producers form the base of the entire food web, both on land and in the oceans. The oceans play a significant role in global carbon budgets via photosynthesis. Approximately half of all global net annual photosynthesis occurs in the oceans, with ~10-15% of production occurring on the continental shelves alone (Müller-Karger et al. 2005). Primary productivity is strongly dependent upon light availability and the presence of nutrients, and thus is highly seasonal in the Arctic region. In particular, the melting and retreat of sea ice during spring are strong drivers of primary production in the Arctic Ocean and its adjacent shelf seas due to enhanced light availability (Barber et al. 2015, Leu et al. 2015). Recent declines in Arctic sea ice extent (see the essay on Sea Ice) have contributed substantially to shifts in primary productivity throughout the open waters of the Arctic Ocean. However, it is clear that the response of primary production to sea ice loss has been both seasonally and spatially dependent (e.g., Tremblay et al. 2015). Furthermore, massive under-ice phytoplankton blooms have also recently been observed in Arctic waters (e.g., Arrigo et al. 2012, Arrigo et al. 2014). It is not clear whether these under-ice phytoplankton blooms are new phenomena. However, a shift away from snow-covered multi-year ice (typical of these areas in the 1980s) towards a thinner, more melt-ponded sea ice cover (typical of current conditions) will enhance the light transmittance (Frey et al., 2011) necessary for primary production, given the presence of sufficient nutrients.
In addition to phytoplankton primary production, sea ice algal production is also important to consider in the overall Arctic Ocean system. In the central Arctic Ocean where primary productivity is relatively low, sea ice algae can contribute up to 60% of total primary production (owing primarily to low pelagic primary productivity). Further, sea ice algae have recently been found to be principally limited by nitrate off the slope from the Laptev Sea and silicate at the ice margin near the Atlantic inflow (Fernández-Méndez et al. 2015). Important remaining questions include whether the production of sea ice algae in the central Arctic Ocean has increased over recent years owing to thinning ice and if nutrients are sufficient to sustain an increase in phytoplankton concentration with overall sea ice retreat (e.g., Fernández-Méndez et al. 2015).
Chlorophyll-a
Algae are responsible for nearly all photosynthesis occurring in the oceans. Measurements of the algal pigment chlorophyll (e.g. chlorophyll-a) serve as a proxy for the amount of algal biomass present as well as overall plant health. Here we present the complete, updated MODIS-Aqua satellite chlorophyll-a record for 2003-2016. A base period of 2003-2015 was chosen when calculating the 2016 anomalies to maximize the length of the short satellite-based time series. Since it is not possible to utilize satellite imagery to assess the presence of under-ice phytoplankton or sea ice algae, we focus here on satellite-based observations of chlorophyll-a concentrations and primary productivity in open ocean waters.
The 2016 data show anomalously high chlorophyll-a concentrations in a number of locations across the Arctic Ocean region, where patterns are spatially and temporally heterogeneous (Fig. 6.1). The most notable anomaly in 2016 occurred during May 2016, with high concentrations of chlorophyll-a (averaging over ~14 mg m-3 higher than the 2003-2015 mean) occurring across a relatively large (~300 x 300 km) region in the central Barents Sea, (Figs. 6.1a, ee) and possibly associated with earlier breakup of sea ice in that region (Fig. 6.1i). Weaker negative anomalies of chlorophyll-a (-2 to -5 mg m-3) during May, June, July, and August were found in the Laptev Sea to the north and west of the New Siberian Islands (Figs. 6.1e-h), and may be a response to a slightly different trajectory of sea ice breakup (i.e., sea ice initially opening up to the northeast of the New Siberian Islands, rather than the northwest as has been more common over the previous decade (Fig. 6.1k)). One additional anomaly of note occurred in the Greenland Sea northeast of Greenland during June (Fig. 6.1f) over a ~150 x 750 km band along the sea ice edge in that region (Fig. 6.1j) and averaged ~7 mg m-3 higher than the 2003-2015 mean.
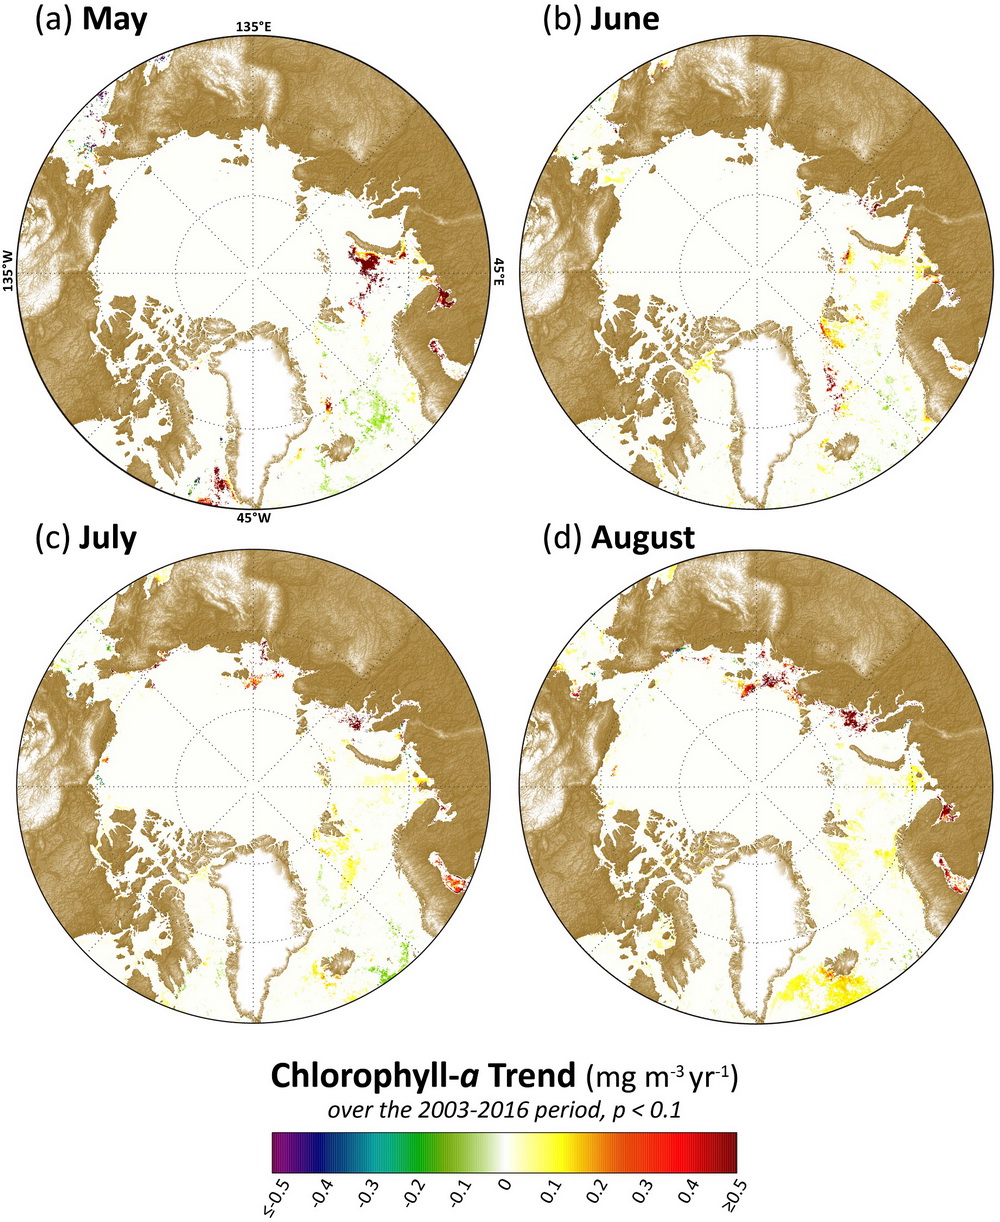
The most significant rates of change in the 2003-2016 satellite record in May have occurred southwest of Greenland in the Labrador Sea and to the west of Novaya Zemlya in the Barents Sea (Fig. 6.2a).The latter has been associated with declines in sea ice (Fig. 6.1i) linked to the Atlantic Water inflow (e.g., Alexeev et al. 2013). Trends have been less steep during June overall (Fig. 6.2b), although some increases were also found in the Barents Sea northwest of Novaya Zemlya and northwest of Svalbard in the Greenland Sea. During July and August, significant increasing trends in chlorophyll-a concentrations have been found primarily in the Laptev Sea to the northwest of the New Siberian Islands (Figs. 6.2c, d). These particular trends are also linked to declining sea ice cover (Figs. 6.1k, l).
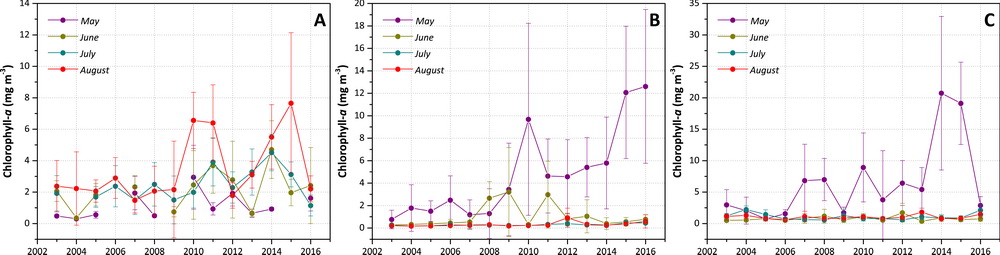
To illustrate the quantitative nature of these trends, three example “hotspot” regions (shown in Fig. 6.1i) with notably steep trends in chlorophyll-a for May, June, July and August 2003-2016 are shown in Fig. 6.3. The region in the Laptev Sea (A), northwest of the New Siberian Islands, shows significant (p < 0.1) trends during July and August, while regions in the Barents Sea (B), west of Novaya Zemlya, and the Labrador Sea (C), southwest of Greenland, show significant (p < 0.1) trends during May. Of these trends, May 2016 made the largest contribution towards continued positive trends in chlorophyll-a at the Barents Sea site (Fig. 6.3b), with an overall positive trend of ~0.79 mg m-3 yr-1. Even though trends during July and August at the Laptev Sea site (Fig. 6.3a) and during May at the Labrador Sea site (Fig. 6.3c) remain positive, concentrations at these two sites decreased considerably in 2016 compared to 2014 and 2015. In particular, the Laptev and Labrador Sea sites show high inter-annual variability in chlorophyll-a concentrations, with a rapid decrease in August and May 2016, respectively. In contrast, the Barents Sea site has exhibited a more gradual, secular trend during May over the 2003-2016 time series.
Primary Production
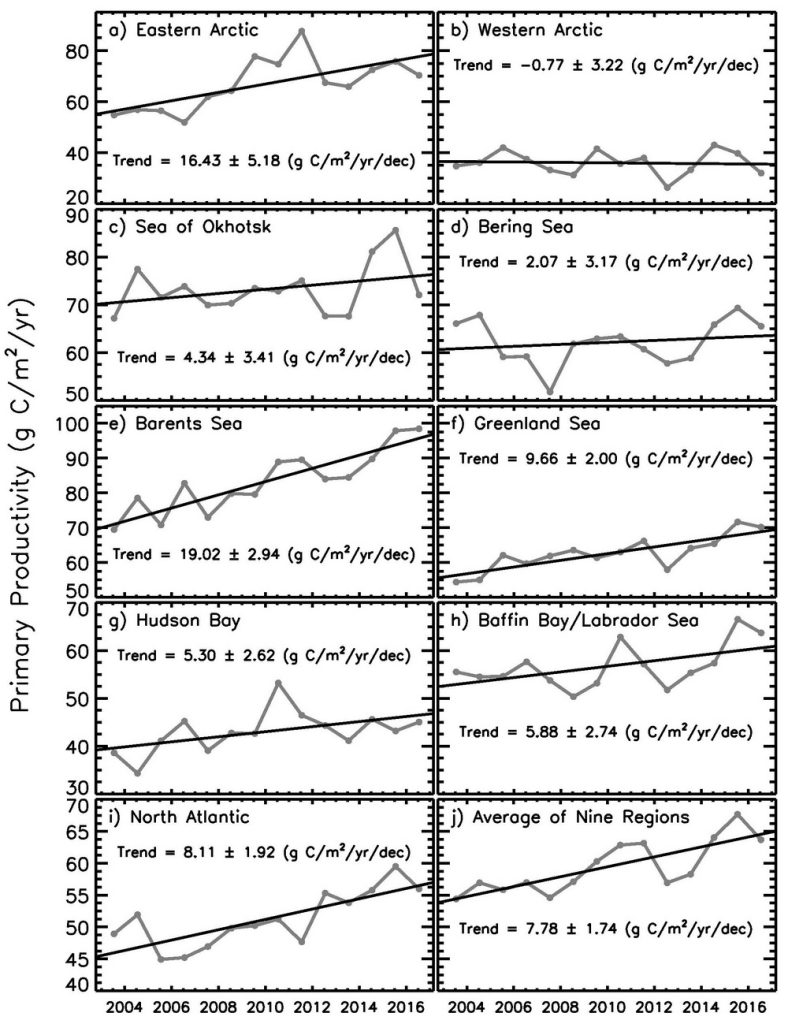
Estimates of ocean primary productivity for nine regions (and the average of these nine regions) across the Arctic show positive trends during the period 2003-2016 in all regions, except for the western (North America) Arctic (Fig. 6.4, Table 6.1). Similarly, anomalies in primary production for 2016 are positive for all regions except for the western Arctic and Sea of Okhotsk (Table 6.1). Regions with the highest anomalies for 2016 include the Barents Sea, the Greenland Sea, and Baffin Bay/Labrador Sea. Statistically significant trends between 2003 and 2016 occurred in the eastern (Eurasian) Arctic, Barents Sea, Greenland Sea, Hudson Bay and North Atlantic, with the steepest trends found for the Barents Sea and the eastern Arctic. There were no statistically significant trends for the western Arctic, Sea of Okhotsk, Bering Sea, or Baffin Bay/Labrador Sea.
| Region | Trend, 2003-2016 (g C/m2/yr/dec) |
Mann- Kendall p-value |
% Change | 2016 Anomaly (g C/m2/yr) from a 2003-2015 base period |
2016 Anomaly (%) from a 2003-2015 base period |
|---|---|---|---|---|---|
| Eastern Arctic | 16.43 | 0.010 | 37.9 | 3.58 | 5.4 |
| Western Arctic | -0.77 | 0.914 | -2.7 | -4.33 | -11.9 |
| Sea of Okhotsk | 4.34 | 0.451 | 8.8 | -1.29 | -1.8 |
| Bering Sea | 2.07 | 0.667 | 4.4 | 3.61 | 5.8 |
| Barents Sea | 19.02 | 0.000 | 34.8 | 16.25 | 19.8 |
| Greenland Sea | 9.66 | 0.001 | 22.3 | 8.15 | 13.1 |
| Hudson Bay | 5.30 | 0.047 | 17.4 | 2.14 | 5.0 |
| Baffin Bay/Labrador Sea | 5.88 | 0.193 | 14.5 | 7.50 | 13.3 |
| North Atlantic | 8.11 | 0.001 | 23.0 | 5.11 | 10.0 |
| Average of Nine Regions | 7.78 | 0.000 | 18.6 | 4.52 | 7.6 |
While similar trends have been reported previously for these regions using both SeaWiFS and MODIS data (Comiso 2015), satellite evidence does suggest that recent increases in cloudiness have dampened the increases in production that would have otherwise occurred as a function of sea ice decline alone (Bélanger et al. 2013). Further challenges remain with linking primary productivity, as well depth-integrated chlorophyll biomass throughout the water column, to satellite-based surface chlorophyll-a values (Tremblay et al. 2015). Satellite-based chlorophyll-a and primary productivity estimates continue to be confounded by issues such as river turbidity in coastal regions (e.g., Demidov et al. 2014, Chaves et al. 2015). Efforts to improve satellite retrieval algorithms based on in situ observations are thus critical to continue in all regions of the Arctic.
References
Alexeev, V. A., V. V. Ivanov, R. Kwok, and L. H. Smedsrud, 2013: North Atlantic warming and declining volume of arctic sea ice. The Cryosphere Discuss., 7, 245-265, doi:10.5194/tcd-7-245-2013.
Arrigo, K. R., D. K. Perovich, R. S. Pickart, Z. W. Brown, G. L. van Dijken, K. E. Lowry, M. M. Mills, M. A. Palmer, W. M. Balch, F. Bahr, N. R. Bates, C. Benitez-Nelson, B. Bowler, E. Brownlee, J. K. Ehn, K. E. Frey, R. Garley, S. R. Laney, L. Lubelczyk, J. Mathis, A. Matsuoka, B. G. Mitchell, G. W. K. Moore, E. Ortega-Retuerta, S. Pal, C. M. Polashenski, R. A. Reynolds, B. Scheiber, H. M. Sosik, M. Stephens & J. H. Swift, 2012: Massive phytoplankton blooms under Arctic sea ice. Science 336, 1408, doi:10.1126/science.1215065.
Arrigo, K. R., D. K. Perovich, R. S. Pickart, Z. W. Brown, G. L. van Dijken, K. E. Lowry, M. M. Mills, M. A. Palmer, W. M. Balch, N. R. Bates, C. R. Benitez-Nelson, E. Brownlee, K. E. Frey, S. R. Laney, J. Mathis, A. Matsuoka, B. G. Mitchell, G. W. K. Moore, R. A. Reynolds, H. M. Sosik & J. H. Swift, 2014: Phytoplankton blooms beneath sea ice in the Chukchi Sea. Deep Sea Research II, http://dx.doi.org/10.1016/j.dsr2.2014.03.018.
Barber, D. G., H. Hop, C. J. Mundy, B. Else, I. A. Dmitrenko, J. -É. Tremblay, J. K. Ehn, P. Assmy, M. Daase, L. M. Candlish, and S. Rysgaard. 2015: Selected physical, biological and biogeochemical implications of a rapidly changing Arctic Marginal Ice Zone. Progress in Oceanography, doi:10.1016/j.pocean.2015.09.003.
Behrenfeld, M. J., and P. G. Falkowski, 1997: Photosynthetic rates derived from satellite-based chlorophyll concentration. Limnology and Oceanography, 42(1), 1-20.
Bélanger, S., M. Babin, and J. É. Tremblay, 2013: Increasing cloudiness in Arctic damps the increase in phytoplankton primary production due to sea ice receding. Biogeosci., 10, 4087-4101, doi:10.5194/bg-10-4087-2013.
Cavalieri, D. J., C. L. Parkinson, P. Gloersen, and H. Zwally, 1996, updated yearly: Sea Ice Concentrations from Nimbus-7 SMMR and DMSP SSM/I-SSMIS Passive Microwave Data. [2003-2014]. Boulder, Colorado USA: NASA DAAC at the National Snow and Ice Data Center.
Chaves, J., P. J. Werdell, C. W. Proctor, A. R. Neeley, S. A. Freeman, C. S. Thomas, and S. B. Hooker, 2015: Assessment of ocean color data records from MODIS-Aqua in the western Arctic Ocean. Deep-Sea Research II, 118, Part A, 32-43, doi:10.1016/j.dsr2.2015.02.011.
Comiso, J. C., 2015: Variability and trends of the Global Sea Ice Covers and Sea Levels: Effects on Physicochemical Parameters. Climate and Fresh Water Toxins, Luis M. Botana, M. Carmen Lauzao and Natalia Vilarino, Eds., De Gruyter, Berlin, Germany.
Demidov, A. B., S. A. Mosharov, and P. N. Makkaveev, 2014: Patterns of the Kara Sea primary production in autumn: Biotic and abiotic forcing of subsurface layer. J. Marine Systems, 132, 130-149, doi:10.1016/j.jmarsys.2014.01.014.
Fernandez-Mendez, M., C. Katlein, B. Rabe, M. Nicolaus, I. Peeken, K. Bakker, H. Flores, and A. Boetius, 2015: Photosynthetic production in the central Arctic Ocean during the record sea-ice minimum in 2012. Biogeosci., 12, 3525-3549.
Frey, K. E., D. K. Perovich, and B. Light, 2011: The spatial distribution of solar radiation under a melting Arctic sea ice cover. Geophysical Research Letters 38, L22501, doi:10.1029/2011GL049421.
Hoaglin, D. C., F. Mosteller, and J. W. Tukey, 2000: Understanding Robust and Exploratory Data Analysis, Wiley Classics Library Edition, (New York: Wiley).
Leu, E., C. J. Mundy, P. Assmy, K. Campbell, T. M. Gabrielsen, M. Gosselin, T. Juul-Pedersen, and R. Gradinger, 2015: Arctic spring awakening – Steering principles behind the phenology of vernal ice algal blooms. Progress in Oceanography, http://dx.doi.org/10.1016/j.pocean.2015.07.012.
Maslanik, J., and J. Stroeve, 1999, updated daily: Near-Real-Time DMSP SSM/I-SSMIS Daily Polar Gridded Sea Ice Concentrations. [2016]. Boulder, Colorado USA: NASA DAAC at the National Snow and Ice Data Center.
Müller-Karger, F. E., R. Varela, R. Thunell, R. Luerssen, C. Hu, and J. J. Walsh, 2005: The importance of continental margins in the global carbon cycle. Geophys. Res. Lett., 32, L01602, doi:10.1029/2004GL021346.
Tremblay J. -É., L. G. Anderson, P. Matrai, S. Bélanger, C. Michel, P. Coupel, and M. Reigstad, 2015: Global and regional drivers of nutrient supply, primary production and CO2 drawdown in the changing Arctic Ocean. Progress in Oceanography, doi:10.1016/j.pocean.2015.08.009.
February 2, 2017