
D. Perovich1, W. Meier2, M. Tschudi3, S. Farrell4, S. Hendricks5, S. Gerland6, C. Haas5, T. Krumpen5, C. Polashenski1,7, R. Ricker5, M. Webster8
1Thayer School of Engineering, Dartmouth College, Hanover, NH, USA
2National Snow and Ice Data Center, Boulder, CO, USA
3Aerospace Engineering Sciences, University of Colorado, Boulder, CO, USA
4NOAA Earth System Science Interdisciplinary Center, University of Maryland, College Park, MD, USA
5Alfred Wegener Institute, Helmholtz Centre for Polar and Marine Research, Bremerhaven, Germany
6Norwegian Polar Institute, Fram Centre, Tromsø, Norway
7ERDC – CRREL, 72 Lyme Road, Hanover, NH, USA
8NASA Goddard Space Flight Center, Greenbelt, MD, USA
Highlights
- The lowest winter maximum ice extent in the satellite record (1979-2017) occurred on 7 March 2017. The extent was 14.42 million km2, 8% below the 1981-2010 average. This was the third straight year of a record low winter maximum.
- The September 2017 Arctic sea ice minimum extent was 4.64 million km2, 25% lower than the 1981-2010 average minimum ice extent and the eighth lowest value in the satellite record (1979-2017). The ten lowest September extents have occurred in the last 11 years.
- In March 2017, multiyear ice (more than 1 year old) and first-year ice were 21% and 79% of the ice cover, respectively, compared to 45% and 55% in 1985 (start of record).
- CryoSat-2 results showed the third lowest central Arctic Ocean sea ice volume in April 2017 of the satellite’s data record (2011-2017), after April 2012 and April 2013.
- There has been an overall decrease in end of winter snow depth on the sea ice cover in the western Arctic in the past decade.
Sea Ice Extent
The Arctic sea ice cover varies substantially over the year, with end-of-winter ice cover generally two to three times as large as at the end of summer. Sea ice is an important element of the climate system: (1) acting as a barrier between the underlying ocean and the atmosphere, (2) limiting the amount of absorbed solar energy due to its high albedo, (3) providing a habitat for biological activity, and (4) limiting human access to the Arctic Ocean. Sea ice extent (designated by a 15% sea ice concentration threshold) has been monitored using passive microwave instruments on satellite platforms since 1979. The months of September and March are of particular interest because they are the months when the Arctic sea ice typically reaches its minimum and maximum extents, respectively. Figure 1 shows maps of monthly average ice extents in March 2017 and September 2017.
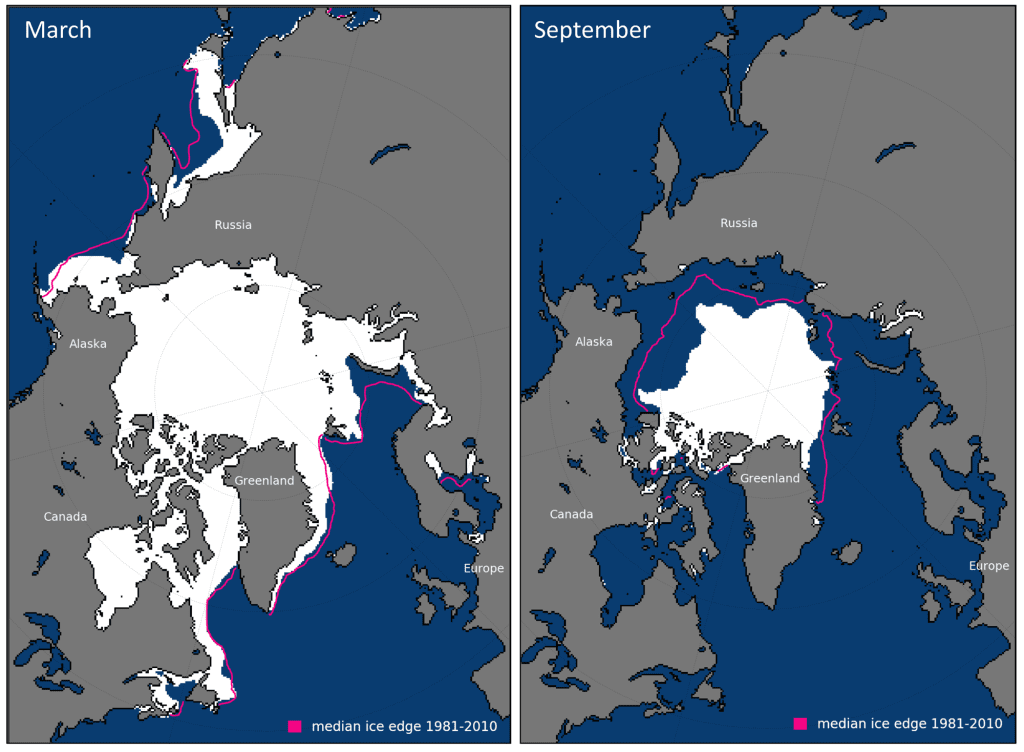
Based on estimates produced by the National Snow and Ice Data Center (NSIDC) Sea Ice Index (Fetterer et al., 2002), the sea ice cover reached a maximum extent of 14.42 million km2 on March 7, 2017. This was 8% below the 1981-2010 average. For the third straight year, the Arctic sea ice has experienced a new record lowest maximum value in the satellite record. The maximum extent occurred 5 days earlier than the 1981-2010 average (12 March).
On September 13, 2017, the sea ice cover reached a summer minimum value of 4.64 million km2. This was the eighth lowest extent of the satellite record. While it represents a modest increase from the 2016 minimum, it was 25% less than the 1981-2010 median minimum ice extent. The ten lowest September extents have occurred in the last 11 years (Parkinson and DiGirolamo, 2016). The September ice extent has not returned to pre-2007 levels.
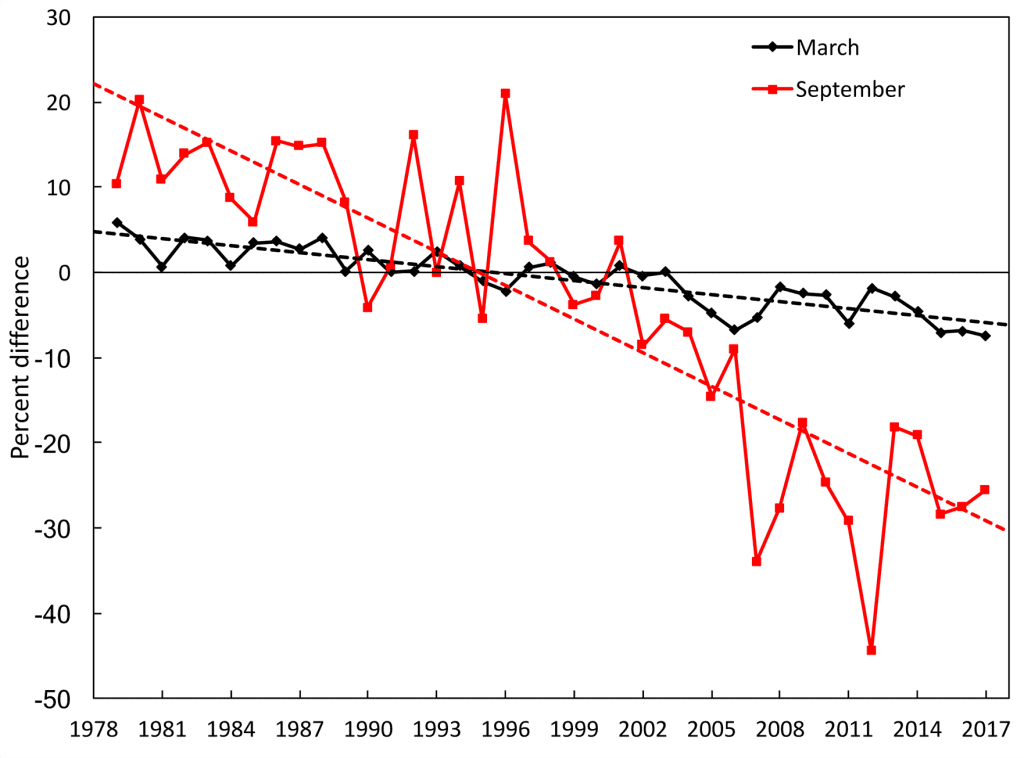
Sea ice extent has decreasing trends in all months and virtually all regions except for the Bering Sea during winter (Meier et al., 2014). The September monthly average trend for the entire Arctic Ocean is now -13.2% per decade relative to the 1981-2010 average (Fig. 2). Trends are smaller during March (-2.7% per decade), but the decrease is statistically significant.
Age of the Ice
The age of sea ice is another key descriptor of the state of the sea ice cover. It serves as an indicator for ice physical properties, including thickness, surface roughness, and melt pond coverage (Tschudi et al., 2016). Compared to younger ice, older ice tends to be thicker, stronger and more resilient to changes in atmospheric and oceanic forcing. The age of the ice is determined using satellite observations and drifting buoy records to track ice parcels over several years (Tschudi et al., 2010; Maslanik et al., 2011). This method has been used to provide a record of the age of the ice from 1985 to the present (Tschudi et al., 2015).
Very old ice (>4 years old) continues to make up a small fraction of the Arctic ice pack in March, when the sea ice extent is at its maximum (Fig. 3). In 1985, 16% of the ice pack was very old ice, but by March 2017, this ice category only constituted 0.9% of the ice pack. The extent of the oldest ice declined from 2.54 million km2 in March 1985 to 0.13 million km2 in March 2017. The distribution of ice age in March 2017 was similar to that in March of the previous year, although there was a decrease in the oldest ice fractional coverage, from 1.2% in March 2016 to 0.9% in March 2017.
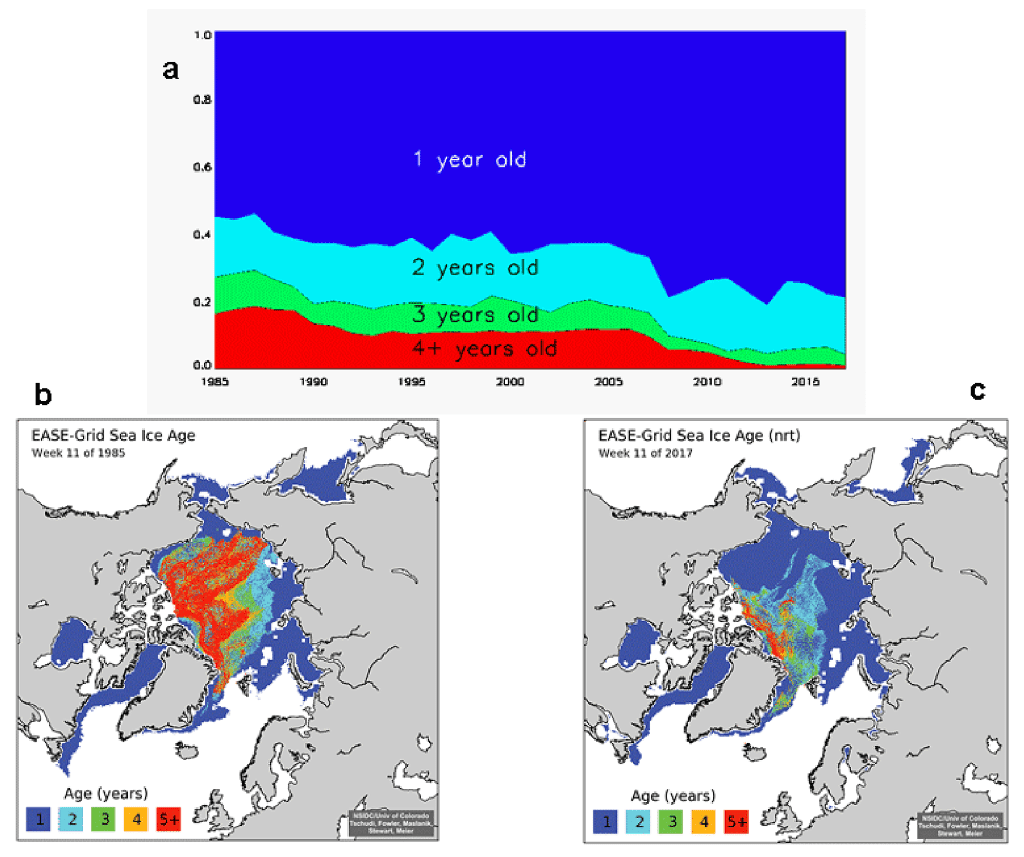
First-year ice now dominates the winter sea ice cover, comprising ~79% of the ice cover in March 2017, compared to about 55% in the 1980s. The thinner, younger ice is more vulnerable to completely melting in the summer, resulting in lower minimum ice extents.
Sea Ice Thickness
Satellite remote sensing and regular airborne survey programs continued to record changes in Arctic sea-ice thickness and volume. In 2017, the ESA CryoSat-2 radar altimeter mission completed its 7th year of operation since its launch in 2010, providing sea-ice thickness between October and April (Laxon et al., 2013) from freeboard observations. The CryoSat-2 freeboard measurements expand the data record of satellite and submarine based observations that document the decline in sea-ice thickness in the last decades (Kwok and Rothrock, 2009; Lindsay and Schweiger, 2015).
In spring 2017, CryoSat-2 products from the Alfred Wegener Institute (AWI) indicated a pattern of ice thickness change that was more variable (Fig. 4a) compared to previous years (2011-2016) in the observational period (Fig. 4b). The April 2017 thickness anomaly (Fig. 4c) shows below average thicknesses in the multiyear ice region north of the Canadian Archipelago, the Chukchi Sea and the shelf regions of the East Siberian Sea. Above-average thicknesses were observed in the Beaufort Sea and the eastern part of the central Arctic Ocean. The magnitude of these anomalies was generally below 1 meter.
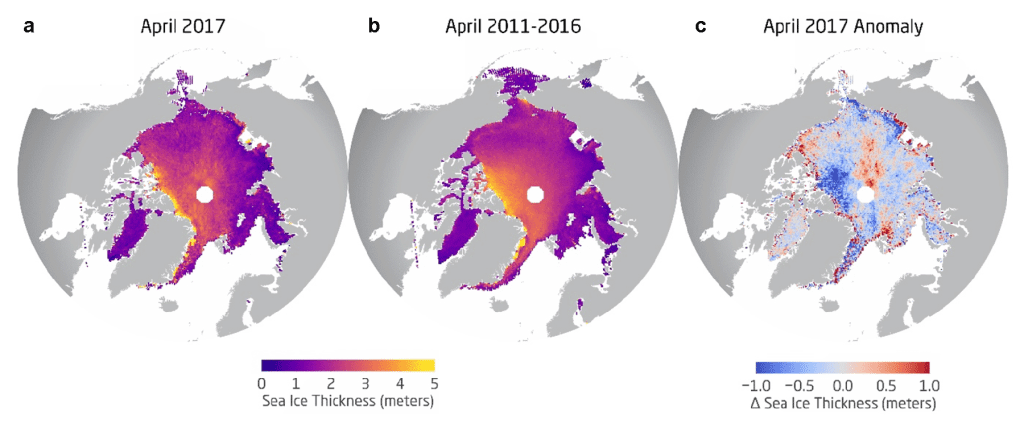
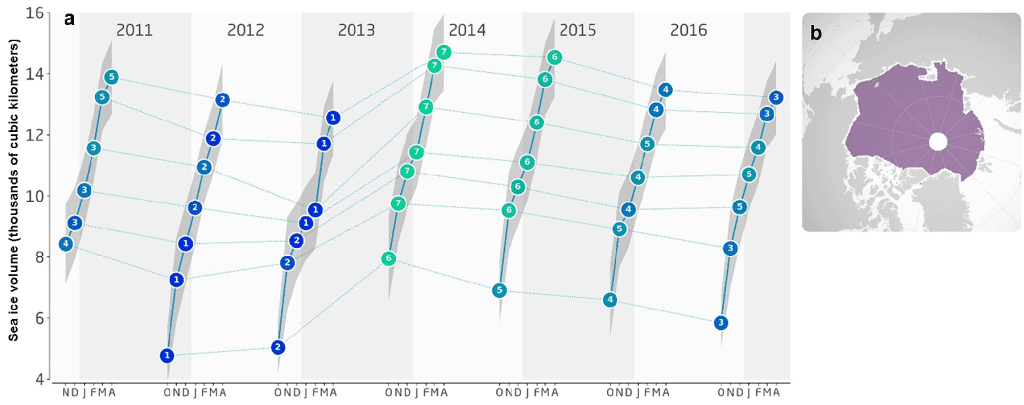
The CryoSat-2 sea-ice volume estimates (Fig. 5) for the central Arctic Ocean showed a continued decline from 2014 through 2017. The April 2017 sea-ice volume of 13.19 ± 1.15 thousand cubic kilometers ranks as the third lowest spring volume after April 2012 (13.14 ±1.27) and 2013 (12.56 ± 1.21) in the AWI CryoSat-2 data record. The difference between the three lowest volume estimates lies within the observational uncertainties.
Snow on Sea Ice
Snow plays several critical roles in the mass balance of Arctic sea ice. During the winter growth season, snow insulates the ocean from the atmosphere, dampening heat fluxes and reducing sea ice growth. In spring, snow reflects more than 80% of the incoming solar radiation, delaying ice melt. Snow can also contribute to ice growth after flooding and refreezing, leading to formation of snow ice (Granskog et al., 2017). As the melt season progresses, freshwater from snowmelt enables the formation of ponds on the sea ice.
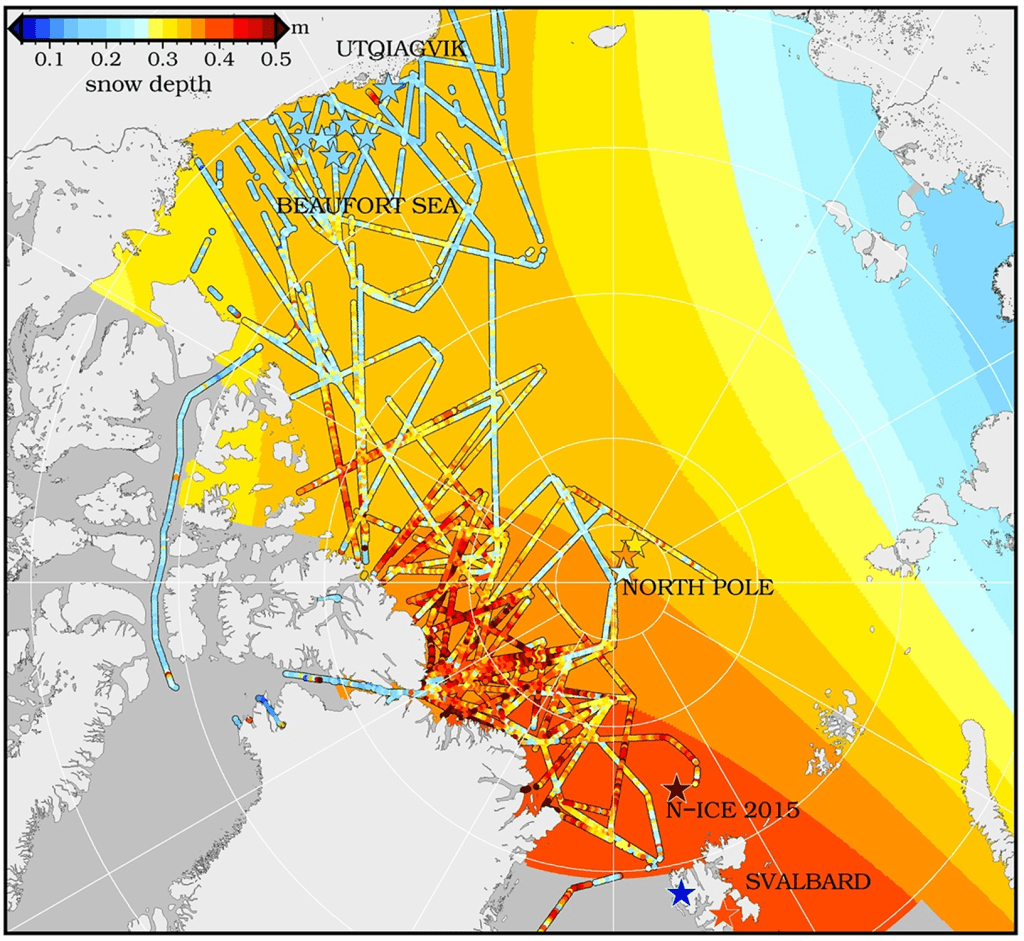
Prior to the 1990s, observations of snow on Arctic sea ice were limited to in situ measurements. Warren et al. (1999) compiled many of these observations into a climatology. Since the 1990s, new approaches to measure snow accumulation have rapidly emerged, including improved instruments for in situ and autonomous observations and remote sensing techniques for retrieving snow depth. Field observations from recent years continue to underscore significant regional and inter-annual variability in Arctic snow on sea ice conditions. Figure 6 shows the historical snow depth climatology (background) plus a compilation of recent airborne snow depth measurements collected between March and May in 2009-2012 and 2014-2015 (lines), and in situ measurements made in 2015 and 2017 (individual points). Mean snow depths range from ~0.05 m to 0.55 m as shown. Compared to the climatology, these data indicate that there has been an overall decrease in snow depths in the western Arctic at the end of winter, potentially associated with later sea ice formation in the autumn and the shift from MY to FY ice. (Webster et al., 2014). Airborne observations confirm that snow on first year ice is thinner than that on multi-year ice (Kurtz and Farrell, 2011; Blanchard-Wrigglesworth et al., 2015).
References
Blanchard-Wrigglesworth, E., S. L. Farrell, T. Newman, and C. M. Bitz, 2015: Snow cover on Arctic sea ice in observations and an Earth System Model. Geophys. Res. Lett., doi: 10.1002/2015GL066049.
Fetterer, F., K. Knowles, W. Meier, and M. Savoie, 2002, updated daily: Sea Ice Index. Boulder, Colorado USA: National Snow and Ice Data Center. http://dx.doi.org/10.7265/N5QJ7F7W.
Granskog, M. A., A. Rösel, P. A. Dodd, D. Divine, S. Gerland, T. Martma, and M. J. Leng, 2017: Snow contribution to first-year and second-year Arctic sea ice mass balance north of Svalbard. J. Geophys. Res.-Oceans, 22, doi: 10.1002/2016JC012398.
Kurtz, N. T., and S. L. Farrell, 2011: Large-scale surveys of snow depth on Arctic sea ice from Operation IceBridge. Geophys. Res. Lett., 38, L20505, doi: 10.1029/2011GL049216.
Kwok, R., and D. A. Rothrock, 2009: Decline in Arctic sea ice thickness from submarine and ICESat records: 1958-2008. Geophys. Res. Lett., 36, doi: 10.1029/2009GL039035.
Laxon, S. W., K. A. Giles, A. L. Ridout, D. J. Wingham, R. Willatt, R. Cullen, R. Kwok, A. Schweiger, J. Zhang, C. Haas, S. Hendricks, R. Krishfield, N. Kurtz, S. Farrell, and M. Davidson, 2013: CryoSat-2 estimates of Arctic sea ice thickness and volume. Geophys. Res. Lett., 40, 732-737, doi: 10.1002/grl.50193.
Lindsay, R., and A. Schweiger, 2015: Arctic sea ice thickness loss determined using subsurface, aircraft, and satellite observations. The Cryosphere, 9, 269-283.
Maslanik, J., J. Stroeve, C. Fowler, and W. Emery, 2011: Distribution and trends in Arctic sea ice age through spring 2011. Geophys. Res. Lett., 38, doi: 10.1029/2011GL047735.
Meier, W. N., G. Hovelsrud, B. van Oort, J. Key, K. Kovacs, C. Michel, M. Granskog, S. Gerland, D. Perovich, A. P. Makshtas, and J. Reist, 2014: Arctic sea ice in transformation: A review of recent observed changes and impacts on biology and human activity. Rev. Geophys., 41, doi: 10.1002/2013RG000431.
Parkinson, C., and N. DiGirolamo, 2016: New visualizations highlight new information on the contrasting Arctic and antarctic sea-ice trends since the late 1970s. Rem. Sens. Envir., 183, 198-204, doi.org/10.1016/j.rse.2016.05.020.
Tschudi, M. A., C. Fowler, J. A. Maslanik, and J. A. Stroeve, 2010: Tracking the movement and changing surface characteristics of Arctic sea ice. IEEE J. Sel. Topics Earth Obs. and Rem. Sens., 3, doi: 10.1109/JSTARS.2010.2048305.
Tschudi, M., C. Fowler, and J. Maslanik, 2015: EASE-Grid Sea Ice Age, Version 2. Boulder, Colorado USA. NASA National Snow and Ice Data Center Distributed Active Archive Center, doi: 10.5067/1UQJWCYPVX61.
Tschudi, M. A., J. C. Stroeve, and J. Scott Stewart (2016), Relating the age of Arctic sea ice to its thickness, as measured during NASA’s ICESat and IceBridge Campaigns. Remote Sens., 8(6), 457; doi: 10.3390/rs8060457.
Warren, S., I. Rigor, N. Untersteiner, V. F. Radionov, N. N. Bryazgin, Y. I. Aleksandrov, and R. Colony, 1999: Snow depth on Arctic sea ice. J. Clim., 12, 1814-1829.
Webster, M. A., I. G. Rigor, S. V. Nghiem, N. T. Kurtz, S. L. Farrell, D. K. Perovich, and M. Sturm, 2014: Interdecadal changes in snow depth on Arctic sea ice. J. Geophys. Res.-Oceans, 119, 5395-5406, doi: 10.1002/2014JC009985.
November 30, 2017