

M. Tedesco1,2, J. E. Box3, J. Cappelen4, R. S. Fausto3, X. Fettweis5, K. Hansen3, T. Mote6, I. Sasgen7, C. J. P. P. Smeets8, D. van As3, R. S. W. van de Wal8, I. Velicogna9
1Lamont Doherty Earth Observatory of Columbia University, Palisades, NY, USA
2NASA Goddard Institute of Space Studies, New York, NY, USA
3Geological Survey of Denmark and Greenland, Copenhagen, Denmark
4Danish Meteorological Institute, Copenhagen, Denmark
5University of Liege, Liege, Belgium
6Department of Geography, University of Georgia, Athens, Georgia, USA
7Climate Sciences Department, Alfred Wegener Institute, Bremerhaven, Germany
8Institute for Marine and Atmospheric Research Utrecht, Utrecht University, Utrecht, The Netherlands
9Department of Earth System Science, University of California, Irvine, California, USA
Highlights
- The 2017 summer season over the Greenland ice sheet was characterized by below-average (1981-2010) melt extent and above-average surface albedo.
- The net 2017 ablation was below the 2008-2017 average at all ~20 PROMICE ablation area sites but still above the average for the 1961-1990 reference period, when the ice sheet was in steady equilibrium.
- The cumulative ice sheet mass balance up until April 2017 (end of GRACE observations) was close to the average of the years 2003-2016.
- Glacier area in 2017 continued a period of relative stability that started in 2012/2013.
Summary
Reflecting surface air temperature patterns over the Greenland ice sheet, the April 2016-April 2017 season was characterized by relatively low summer (June, July, August) melt extent and ablation along the margins of the ice sheet. Correspondingly, the surface albedo, averaged over the entire ice sheet, was relatively high. The net ice mass loss over the year was near average.
Surface Melting
The Greenland ice sheet is a major contributor to global sea level rise and plays a crucial role in the surface energy budget, climate and weather of the Arctic. Estimates of the spatial extent of melt across the Greenland ice sheet (GrIS) are obtained from brightness temperatures measured by the Special Sensor Microwave Imager/Sounder (SSMIS) passive microwave radiometer (e.g., Mote, 2007, Tedesco et al., 2013). These estimates show a rapid start to the 2017 melt season, similar to 2016, with melt extent in early April reaching an area typical of early June (Fig. 1a). From mid-June through mid-July, however, melt extent in 2017 was persistently below the 1981-2010 average, and below 2016 values over the same period. The spatial extent of melt for the period June, July and August (JJA) 2017 was above the average on 16% of summer days and reached its maximum extent of 32.9% of the ice sheet area on 26 July. This was low compared to the average maximum extent of 39.8% for the period 1981-2010, and was the lowest maximum extent since 1996. It is worth noting that on a more local scale, most of the western and northeast margins had more days than average with melt (relative to the 1981-2010 average), while the southeast margin had fewer days than average (Fig. 1b).

The magnitude and evolution of surface melt in 2017 were consistent with the state of the Arctic Oscillation (AO) and North Atlantic Oscillation (NAO), both of which were strongly positive. When the AO or NAO are in a positive state, cyclonic conditions promote reduced incoming solar radiation and increased precipitation through increased cloudiness, for example, hence inhibiting melting and potentially promoting summer snowfall. These conditions are the opposite of those in 2012, when strong and persisting anti-cyclonic conditions promoted enhanced melting (e.g., Nghiem et al., 2012). Additionally, the 500 hPa geopotential heights across Greenland were persistently low across Greenland from June to mid-July 2017, a condition that is also typically associated with reduced melt extent. Late July and early August experienced positive geopotential height anomalies, and a negative NAO that promoted melting conditions across Greenland. As illustrated in Fig. 1a, this was a period of above average melt extent in summer 2017 (also see essay on Surface Air Temperature).
Surface Mass Balance
Consistent with low to moderate surface melting, the April 2016-April 2017 surface mass balance (SMB) year along the K-transect at 67° N in West Greenland (van de Wal et al., 2012) was characterized by moderate ice loss over the ablation region. Figure 2a shows the mass balance elevation profile of 2016-2017 together with the mean SMB elevation profile over the period 1990-2017. At most sites the SMB was approximately 1 standard deviation below average (1990-2017). Over the entire 27-year period there are only 4 years (1992, 1993, 1996, 2015) with less ablation along the transect (Fig. 2b). Overall, the distribution of the yearly-averaged mass balance over the transect is slightly positively skewed, with above average values over most of the later years except for the summers of 2015 and 2017. The equilibrium line altitude in 2017 was around 1490 meters, which is 40 m below the 27-year mean. The mass balance gradient was 3.4 mm w.e./m yr, which is about 6% lower than the average.
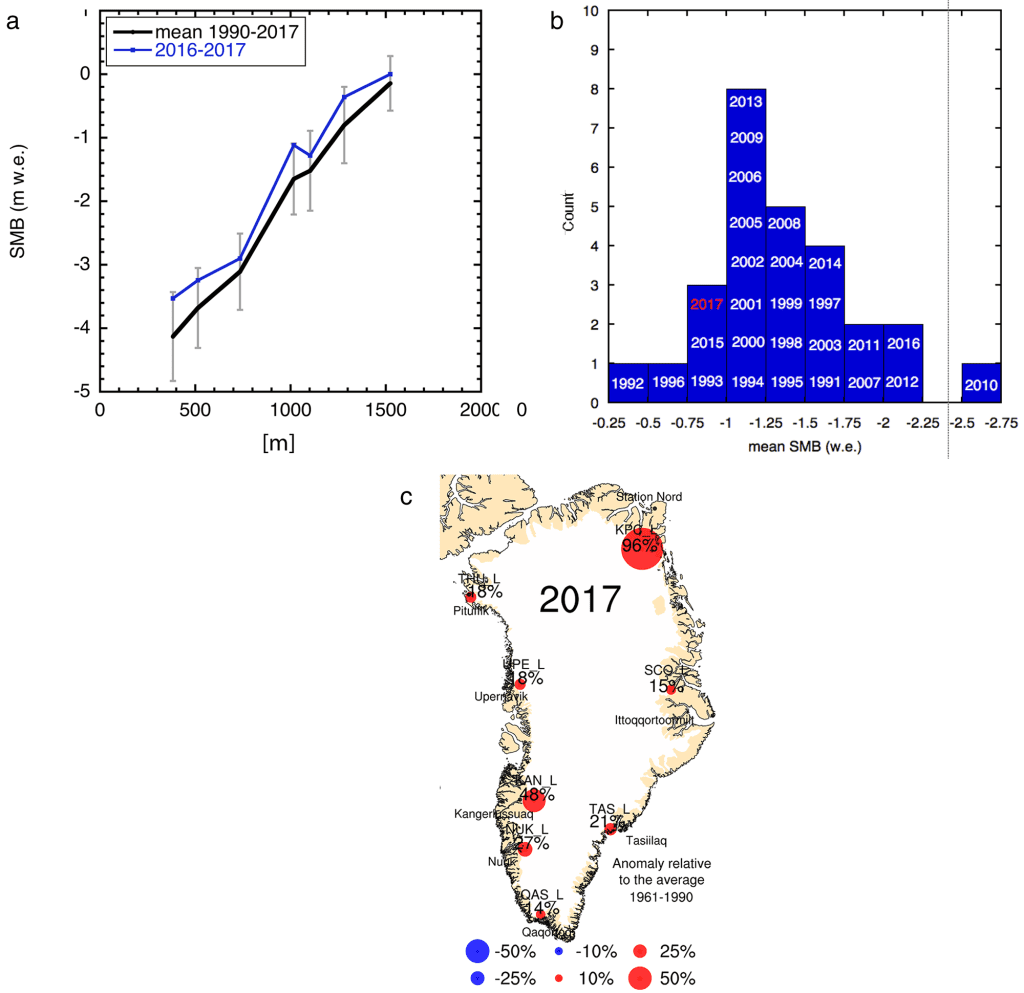
Net ablation in 2017 at 20 PROMICE sites, distributed around Greenland in the ablation zone, was at or below the average for the period of observations (2008-2017) at all locations. The most negative anomalies (< 1 SD below the 2008-2017 average) were found at the ice sheet margin at the TAS, NUK, UPE and THU sites. After referencing the values to the 1961-1990 climate-standard period and applying the Danish Meteorological Institute (DMI) air temperature scaling method of van As et al. (2016), only three of eight station sites at low elevation experienced ablation anomalies that were above average and beyond uncertainty in 2017: KPC_L (+96% ± 49%), SCO_L (+15% ± 14%) and KAN_L (+48% ± 35%) (Fig. 2c).
Total Mass Balance
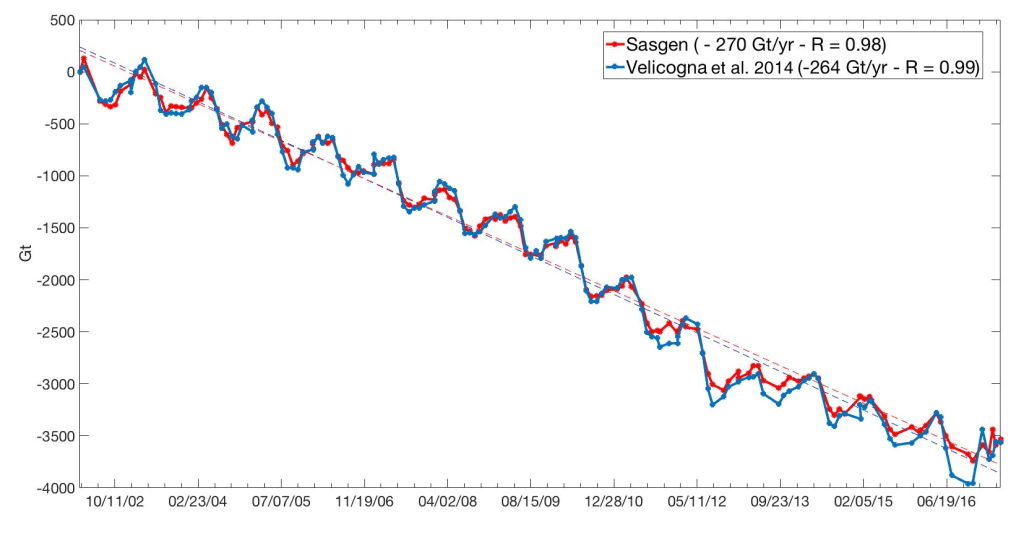
GRACE satellite gravity estimates obtained following Velicogna et al. (2014) and Sasgen et al. (2012), available since 2002, indicate that between April 2016 and April 2017 (the most recent 12-month period of reliable data) there was a net ice mass loss of 276 ± 47 Gt (Fig. 3; 2-sigma uncertainty). The 2016-2017 net loss is greater than the April 2015-April 2016 mass loss (191 ± 28 Gt, see Arctic Report Card 2016) and close to the average April-to-April mass loss (255 ± 7 Gt) for 2003-2017 (Sasgen et al., 2012). The updated trends of total ice mass loss for the 15-year GRACE period are, respectively, 264 Gt/yr (Velicogna et al., 2014), and 270 Gt/yr (Sasgen et al., 2012).
Albedo
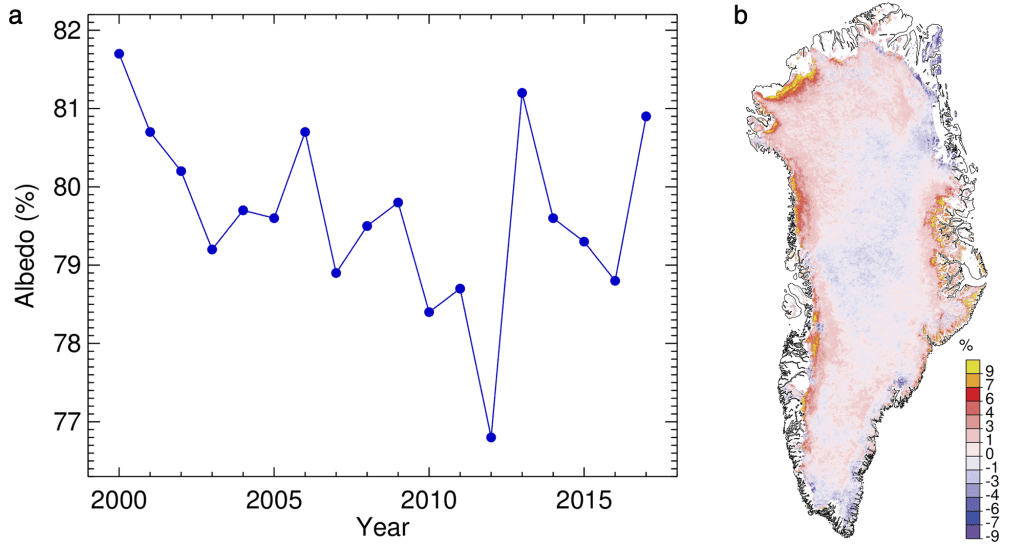
The area-averaged albedo for the entire Greenland ice sheet for summer 2017 (June through August, JJA) was 80.9%, using data from the Moderate-resolution Imaging Spectroradiometer (MODIS, after Box et al., 2017) (Fig. 4a). This is the 3rd highest JJA albedo value during the 2000-2017 MODIS period, after 2000 and 2013. High positive albedo anomalies are consistent with reduced melting in 2017 and snowfall events during the summer. For context, the minimum average summer albedo was recorded in 2012 (76.8%), the year of record maximum melt extent. High 2017 summer albedo anomalies occurred along the western margins of the ice sheet (Fig. 4b), where a strong albedo decrease associated with bare ice exposure and increased melting has been recently observed.
Surface Air Temperatures
Surface air temperatures observed on the ice sheet indicated a different pattern than those observed at coastal station, especially during summer 2017. Measurements at twenty coastal weather stations of the Danish Meteorological Institute (DMI) indicate widespread above- or near-average air temperatures for the seasons of autumn 2016 through summer 2017 (relative to the average for the period 1981-2010), with the exception of spring in northeast Greenland. New record highs were set at a number of sites in autumn 2016, with absolute anomalies above +5° C (see Table 1).
| Station Name, Start Year, Latitude, Longitude |
SON 2016 |
DJF 16/17 |
MAM 2017 |
JJA 2017 |
Station Name, Start Year, Latitude, Longitude |
SON 2016 |
DJF 16/17 |
MAM 2017 |
JJA 2017 |
||
|---|---|---|---|---|---|---|---|---|---|---|---|
| Pituffik/Thule AFB 1948,76.5,68.8 |
Anomaly [°C] |
0.4 | 0.5 | 0.2 | -0.2 | Ivittuut/Narsarsuaq 1873,61.2, 45.4 |
Anomaly [°C] |
-0.1 | 1.4 | 1.3 | 0.2 |
| z-score | 0.4 | 0.1 | -0.1 | -0.1 | z-score | 0.1 | 0.6 | 0.6 | 0.7 | ||
| Max Year | 2010 | 1986 | 1953 | 1957 | Max Year | 2010 | 2010 | 2010 | 2016 | ||
| Min Year | 1964 | 1949 | 1992 | 1996 | Min Year | 1874 | 1984 | 1989 | 1973 | ||
| Station Nord 1961, 81.6, 16.7 |
Anomaly [°C] |
4.4 | 2.7 | -1.8 | 0.4 | Qaqortoq 1807, 60.7,46.1 |
Anomaly [°C] |
0.2 | 1.0 | 0.3 | -0.1 |
| z-score | 2.3 | 1.3 | -0.8 | 0.5 | z-score | 0.6 | 0.6 | 0.0 | 0.1 | ||
| Max Year | 2016 | 2011 | 2006 | 2003 | Max Year | 2010 | 2010 | 1932 | 1929 | ||
| Min Year | 1989 | 1967 | 1961 | 1970 | Min Year | 1874 | 1863 | 1811 | 1811 | ||
| Upernavik 1873, 72.8, 56.1 |
Anomaly [°C] |
0.7 | 0.7 | 1.4 | 0.0 | Danmarkshavn 1949,76.8, 18.7 |
Anomaly [°C] |
5.3 | 0.6 | -2.1 | 1.0 |
| z-score | 0.7 | 0.3 | 0.5 | 0.6 | z-score | 3.3 | 0.4 | -1.4 | 1.3 | ||
| Max Year | 2010 | 1947 | 1932 | 2012 | Max Year | 2016 | 2005 | 1976 | 2016 | ||
| Min Year | 1917 | 1983 | 1896 | 1873 | Min Year | 1971 | 1967 | 1966 | 1955 | ||
| Kangerlussuaq 1949, 67.0, 50.7 |
Anomaly [°C] |
0.2 | -0.7 | -0.4 | 0.3 | Illoqqortoormiut 1949,70.5,22.0 |
Anomaly [°C] |
4.2 | 2.5 | -0.9 | 0.2 |
| z-score | 0.1 | -0.4 | -0.2 | 0.0 | z-score | 2.7 | 1.2 | 0.1 | 0.8 | ||
| Max Year | 2010 | 1986 | 2016 | 1960 | Max Year | 2016 | 2014 | 1996 | 2016 | ||
| Min Year | 1982 | 1983 | 1993 | 1983 | Min Year | 1951 | 1966 | 1956 | 1955 | ||
| Ilulissat 1807, 69.2, 51.1 |
Anomaly [°C] |
-0.2 | 0.1 | 0.1 | -0.5 | Tasiilaq 1895, 65.6, 37.6 |
Anomaly [°C] |
2.3 | 2.3 | 1.3 | 0.2 |
| z-score | 0.3 | 0.3 | 0.1 | 0.3 | z-score | 2.2 | 1.4 | 0.8 | 0.0 | ||
| Max Year | 2010 | 1929 | 1847 | 1960 | Max Year | 1941 | 1929 | 1929 | 2016 | ||
| Min Year | 1837 | 1863 | 1813 | 1863 | Min Year | 1917 | 1918 | 1899 | 1983 | ||
| Aasiaat 1958, 68.7, 52.8 |
Anomaly [°C] |
0.5 | 0.8 | 0.6 | 0.3 | Prins Christian Sund 1958, 60.1,42.2 |
Anomaly [°C] |
1.3 | 0.6 | 0.2 | -0.2 |
| z-score | 0.6 | 0.0 | 0.2 | 0.3 | z-score | 1.5 | 0.4 | 0.3 | -0.2 | ||
| Max Year | 2010 | 2010 | 2016 | 2012 | Max Year | 2010 | 2010 | 2005 | 2010 | ||
| Min Year | 1986 | 1984 | 1993 | 1972 | Min Year | 1982 | 1993 | 1989 | 1970 | ||
| Nuuk 1784, 64.2, 51.7 |
Anomaly [°C] |
-0.2 | 0.6 | 0.1 | 0.2 | Summit 1991, 72.6, 38.5 |
Anomaly [°C] |
2.2 | 1.4 | 0.6 | -0.6 |
| z-score | 0.2 | 0.4 | 0.0 | 0.3 | z-score | 1.1 | 0.7 | 0.3 | -0.6 | ||
| Max Year | 2010 | 2010 | 1932 | 2012 | Max Year | 2002 | 2010 | 2016 | 2012 | ||
| Min Year | 1811 | 1818 | 1802 | 1819 | Min Year | 2009 | 1993 | 1992 | 1992 | ||
| Paamiut 1958,62.0,49.7 |
Anomaly [°C] |
0.4 | 1.3 | -0.2 | 0.0 | ||||||
| z-score | 0.3 | 0.3 | -0.2 | 0.0 | |||||||
| Max Year | 2010 | 2010 | 2005 | 2010 | |||||||
| Min Year | 1982 | 1984 | 1993 | 1969 | |||||||
Consistent with surface mass balance observations, July 2017 was the coldest in the 2008-2017 period along the western ice sheet ablation area at the PROMICE sites. Summer (JJA) temperatures were at or below the 2008-2017 average at all stations, and by more than one standard deviation below the average along the entire western slope, consistent with in average or below average ablation. Out of all January-August 2017 station-months, 21% were colder than one standard deviation below average, and only 2% were over one standard deviation above average temperature. At Greenland’s Summit Station, a record low July temperature of -33.0° C was measured on July 4 (previous record: -30.7° C), and a record high July temperature of +1.9° C was measured on July 28 (previous record: +0.8° C).
Marine-Terminating Glaciers
Marine-terminating glaciers are the outlets via which the Greenland ice sheet discharges ice mass to the ocean. Glacier area measurements from LANDSAT and ASTER imagery available since 1999 (Box and Hansen, 2015) for fifteen of the widest and fastest-flowing marine-terminating glaciers reveal a pattern of continued relative stability that started in 2012/2013. The annual net area change at the end of the melt season in September 2017 was -13.5 km2, which is below the 18-year survey period average of -59.9 km2 per year. Among the fifteen surveyed glaciers, seven retreated, five were stable and three advanced. The largest area losses were in eastern Greenland, with the Helheim and Kangerdlugssauq glaciers losing, respectively, 11.6 km2 and 9.9 km2 in area. The largest advance was observed at Petermann glacier, in the northwest, with a change of +11.5 km2.
Acknowledgments
MT would like to acknowledge the NASA Cryosphere Program (NNX17AH04G, NNX16AH38G), the NASA IDS program (NNX14AD98G) and the Office of Polar Programs at the National Science Foundation (OPP 1643187, PLR-1603331). PROMICE stations are funded by the Danish Energy Agency. KAN stations are funded by SKB. IS acknowledges funding by the Helmholtz Climate Initiative REKLIM (Regional Climate Change), a joint research project of the Helmholtz Association of German Research Centres (HGF) and the German Research Foundation through grant SA 1734/4-1.
References
Box, J. E., and K. Hansen, 2015: Survey of Greenland glacier area changes. PROMICE newsletter 8, December 2015, http://promice.org/Newsletter_08.pdf.
Box, J. E., D. van As, and K. Steffen, 2017: Greenland, Canadian and Icelandic land ice albedo grids (2000-2016). Geological Survey of Denmark and Greenland Bulletin, 38, 53-56.
Khan, S. A., I. Sasgen, M. Bevis, T. van Dam, J. L. Bamber, J. Wahr, M. Willis, K. H. Kjær, B. Wouters, V. Helm, and B. Csatho, 2016: Geodetic measurements reveal similarities between post-Last Glacial Maximum and present-day mass loss from the Greenland ice sheet. Science Advances, 2(9), e1600931.
Mote, T., 2007: Greenland surface melt trends 1973-2007: Evidence of a large increase in 2007. Geophysical Research Letters, 34, L22507.
Nghiem, S. V., D. K. Hall, T. L. Mote, M. Tedesco, M. R. Albert, K. Keegan, C. A. Shuman, N. E. DiGirolamo, and G. Neumann, 2012: The extreme melt across the Greenland ice sheet in 2012. Geophysical Research Letters, 39, L20502, doi: 10.1029/2012GL053611.
Sasgen, I., M. van den Broeke, J. L. Bamber, E. Rignot, L. S. Sørensen, B. Wouters, Z. Martinec, I. Velicogna, I., and S. B. Simonsen, 2012: Timing and origin of recent regional ice-mass loss in Greenland. Earth and Planetary Science Letters, 333, 293-303.
Simpson, M. J. R., G. A. Milne, P. Huybrechts, and A. J. Long, 2009: Calibrating a glaciological model of the Greenland ice sheet from the Last Glacial Maximum to present-day using field observations of relative sea level and ice extent. Quaternary Science Reviews, 28(17-18), 1631–1657.
Tedesco, M., X. Fettweis, T. Mote, J. Wahr, P. Alexander, J. Box, and B. Wouters, 2013: Evidence and analysis of 2012 Greenland records from spaceborne observations, a regional climate model and reanalysis data. The Cryosphere, 7, 615-630.
van As, D., R. S. Fausto, J. Cappelen, R. S. W. van de Wal, R. J. Braithwaite, H. Machguth, and PROMICE project team, 2016: Placing Greenland ice sheet ablation measurements in a multi-decadal context. Geological Survey of Denmark and Greenland Bulletin, 35, 71-74.
van de Wal, R. S. W., W. Boot, C. J. P. P. Smeets, H Snellen, M. R. van den Broeke, and J. Oerlemans, 2012: Twenty-one years of mass balance observations along the K-transect, West-Greenland. Earth System Science Data, 4, 31-35, doi: 10.5194/essd-4-31-2012.
Velicogna, I., T. C. Sutterley, and M. R. van den Broeke, 2014: Regional acceleration in ice mass loss from Greenland and Antarctica using GRACE time-variable gravity data. Geophysical Research Letters, 41, 8130–8137, doi: 10.1002/2014GL061052.
December 6, 2017