
J. E. Overland1, E. Hanna2, I. Hanssen-Bauer3, S. -J. Kim4, J. E. Walsh5, M. Wang1,6, U. S. Bhatt7, R. L. Thoman8, and T. J. Ballinger9
1Pacific Marine Environmental Laboratory, NOAA, Seattle, WA, USA
2School of Geography and Lincoln Centre for Water and Planetary Health, University of Lincoln, Lincoln, UK
3Norwegian Meteorological Institute, Blindern, Oslo, Norway
4Korea Polar Research Institute, Incheon, Republic of Korea
5International Arctic Research Center, University of Alaska Fairbanks, Fairbanks, AK, USA
6Joint Institute for the Study of the Atmosphere and Ocean, University of Washington, Seattle, WA, USA
7Geophysical Institute, University of Alaska Fairbanks, Fairbanks, AK, USA
8International Arctic Research Center, University of Alaska Fairbanks, Fairbanks, AK, USA
9Department of Geography, Texas State University, San Marcos, TX, USA
Highlights
- The average annual surface air temperature over land north of 60° N for October 2018 to September 2019 was the second warmest (after 2015/16) in the observational record beginning in 1900. Arctic temperatures for the past six years (2014-19) have all exceeded previous records.
- Annual Arctic air temperature continues to increase at more than double the magnitude of the global mean air temperature increase.
- Alaska had warmer than normal air temperatures throughout the year, especially in winter, that were associated with unusual southerly winds and a lack of Bering Sea ice, similar to winter 2018.
- Especially warm localized air temperatures during spring and summer over west Greenland supported extensive ice sheet melt events and early regional snow melt.
Introduction
Arctic surface air temperature is an indicator of both regional and global climate change. Although there are year-to-year and regional differences in air temperatures, driven by natural variability, the magnitude, persistence, and Arctic-wide patterns of recent temperature increases are indicators of global climate change from increasing concentrations of atmospheric greenhouse gases (Overland 2009; Notz and Stroeve 2016). Warming atmospheric temperatures also act as a driver of Arctic changes in the ocean and on land. A linear relationship between global temperature change and Arctic sea ice area decline suggests a direct climate forcing (Mahlstein and Knutti 2012). Similarly, tundra greening, especially along coastlines, and glacier mass loss are also the result from air temperature increases. We report on the spatial and temporal variability of Arctic air temperatures during October 2018 through September 2019.
Mean annual land surface air temperature
At +1.9°C, the mean annual surface air temperature (SAT) anomaly for October 2018-September 2019 for land weather stations north of 60° N, relative to the 1981-2010 mean, is the second highest value (after 2015/16) in the observational record starting in 1900 (Fig. 1). Observed annual mean Arctic temperatures over the past six years (2014-19) all exceed previous records. Since the mid-1990s the Arctic has warmed at more than twice the magnitude of global mean temperature increases; a phenomenon known as Arctic amplification (Fig. 1).
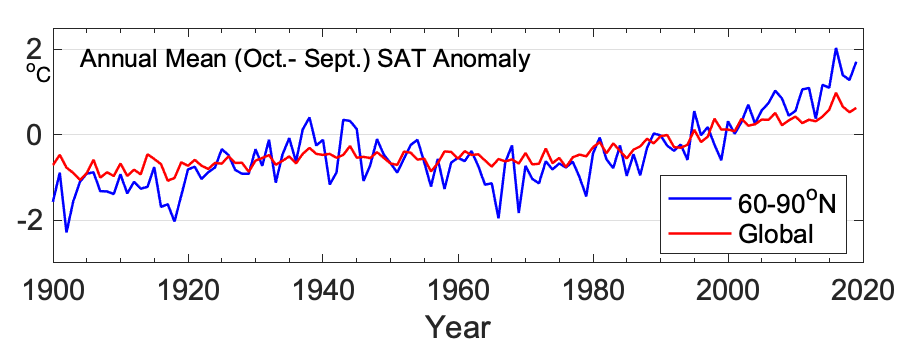
While there is currently no consensus on the reasons for Arctic amplification, proposed mechanisms include: reduced summer albedo due to sea ice and snow cover loss (Pithan and Mauritsen 2014), the increase of water vapor and clouds in the Arctic atmosphere (Dufour et al. 2016; Kim et al. 2017), lapse-rate feedback (decreases in tropospheric temperature with height: Stuecker et al. 2018), and decreased air pollution (Acosta Navarro et al. 2016).
Air temperature variation
Seasonal air temperature variations are divided into autumn 2018 (October, November, December [OND]), and winter (January, February, March [JFM]), spring (April, May, June [AMJ]), and summer (July, August, September [JAS]) of 2019 (Fig. 2). These SAT divisions are chosen to coincide with the seasonal cycles of key Arctic variables. For instance, the summer sea ice minimum occurs in September and autumn cooling continues through December.
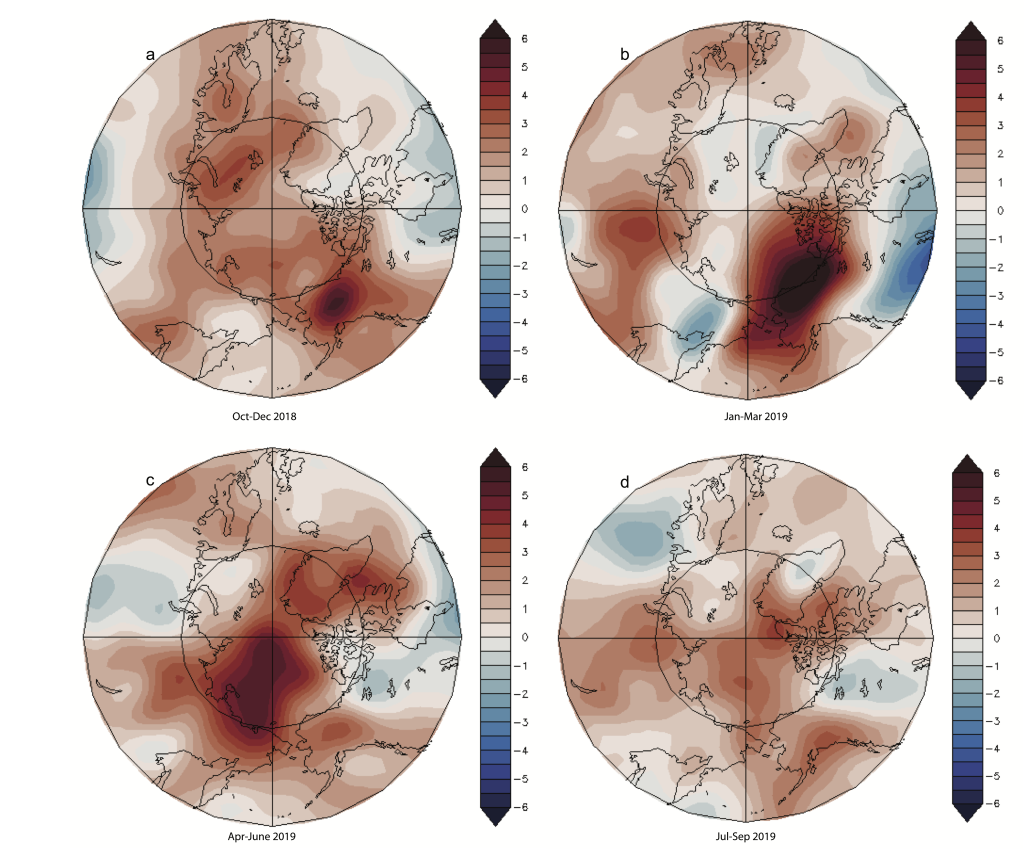
Autumn, spring, and summer seasons showed warm central Arctic temperatures of +2°C above the long-term average (1981-2010). However, 2018/19 regional temperature anomalies were not as extreme as the more than +4°C anomalies of 2017/18 (see Arctic Report Card 2018). Details of the seasonal air temperature variations in 2018/19 are provided below. Atmospheric temperatures and pressures in 2019 did not show major examples of Arctic/mid-latitude weather connections as in 2018.
Autumn 2018 (OND). The largest temperature anomalies (+2°C) stretched across the central Arctic (Fig. 2a). The warmest temperatures were over central Alaska and in the marginal ice zones of the Barents and Chukchi Seas. This sustained warming pattern and associated delayed autumn sea ice freeze-up were associated with winds from the southwest (Fig.3a; see essay Sea Ice). Over land, the Eurasian coast was warmer than normal. Finland observed a new record-high daily October temperature of 20.5°C in Ylivieska (central Finland) on 14 October 2018 (https://www.rcinet.ca/eye-on-the-arctic/2018/10/15/finland-weather-record-heat-october-autumn-ylivieska-global-warming/). Like autumn 2017, Svalbard experienced extreme warmth, where the December average for Svalbard Airport was 5.5°C above the 1981-2010 average. Eastern Asia in autumn 2018 did not experience extensive spells of cold weather as in 2017.
Winter 2019 (JFM). A major Arctic warming event in winter (Fig. 2b) was observed in Alaska and adjacent seas, where monthly temperature anomalies were 4°C above normal. The northern Bering Sea was particularly warm, and contributed to low sea ice extent and ecological impacts to fisheries and marine mammals (see essay Recent Warming in the Bering Sea). This rare event was a repetition of the southerly winds and low sea ice coverage in 2018. March was exceptionally warm over much of Alaska, the Yukon, and western Northwest Territory, where most places set all-time record high monthly means, in some cases 3°C warmer than any previous March.
In February and March 2019 (Fig 3b), strong, warm winds from the south over the Bering Sea greatly retarded sea ice advances (see essay Sea Ice) and moved warm air northward along the international date line into the central Arctic, as in winter 2018. The lower atmospheric wind pattern (Fig. 3b) was connected to patterns higher in the atmosphere (the polar vortex; Fig. 3d) that contributed to the persistence of the wind pattern over Alaska and the remainder of North America.

Spring 2019 (AMJ). Spring (Fig. 2c) showed warm temperature anomalies, especially in the East Siberian Sea related to offshore winds, as also seen during 2017 and 2018. In April, record warm temperatures occurred at several sites in Scandinavia and in many parts of Iceland. Localized extreme temperatures off the west coast of Greenland triggered an extensive spring-summer melt season and early snow melt (see essays Terrestrial Snow Cover and Greenland Ice Sheet). The Greenland coast, especially the west (including northwest) coast, had near-record high temperature maxima of 22-24°C in June-August. The warm temperatures resulted from localized southerly winds (Fig. 3c).
Summer 2019 (JAS). Unlike summers 2016, 2017, and 2018, summer 2019 returned to the warm conditions observed in much of the previous decade (Fig. 2d). Low surface pressures, which often counter extensive summer sea ice melt, actually supported melt in 2019 during the early summer with advection of warm temperatures from the south (see essay Sea Ice). While spring and early summer weather indicated possible record-low sea ice coverage (similar to 2012), late summer weather was historically not unusual and conditions were not supportive of a record sea ice minimum for 2019 (see essay Sea Ice). June and especially July were very warm over much of Alaska and the southern Yukon Territory. At Anchorage, all three months were the warmest on record relative to the last 69 years’ mean. July was the warmest calendar month on record in Reykjavik, Iceland (Trausti Jónsson, Icelandic Met. Office, personal communication).
References
Acosta Navarro, J. C., V. Varma, I. Riipinen, Ø. Seland, A. Kirkevåg, H. Struthers, T. Iversen, H. -C. Hansson, and A. M. L. Ekman, 2016: Amplification of Arctic warming by past air pollution reductions in Europe. Nat. Geosci., 9, 277-281.
Dufour, A., O. Zolina, and S. K. Gulev, 2016: Atmospheric moisture transport to the Arctic. J. Climate, 29, 5061-5081.
Kim, B. -M., J. -Y. Hong, S. -Y. Jun, X. Zhang, H. Kwon, S. -J. Kim, J. -H. Kim, S. -W. Kim, and H. -K. Kim, 2017: Major cause of unprecedented Arctic warming in January 2016: Critical role of Atlantic windstorm. Sci. Rep., 7, 40051, https://doi.org/10.1038/srep40051.
Mahlstein, I., and R. Knutti, 2012: September Arctic sea ice predicted to disappear near 2°C global warming above present. J. Geophys. Res. Atmos., 117, D06104, https://doi.org/10.1029/2011JD016709.
Notz, D., and J. Stroeve, 2016: Observed Arctic sea-ice loss directly follows anthropogenic CO2 emission. Science, 354, 747-750, https://doi.org/10.1126/science.aag2345.
Overland, J. E., 2009: The case for global warming in the Arctic. Influence of Climate Change on the Changing Arctic and Sub-Arctic Conditions, J. C. J. Nihoul and A. G. Kostianoy, Eds., Springer, 13-23.
Pithan, F., and T. Mauritsen, 2014: Arctic amplification dominated by temperature feedbacks in contemporary climate models. Nat. Geosci., 7, 181-184, https://doi.org/10.1038/ngeo2071.
Stuecker, M. F., C. M. Bitz, K. C. Armour, C. Proistosescu, S. M. Kang, S. -P. Xie, D. Kim, S. McGregor, W. Zhang, S. Zhao, W. Cai, Y. Dong, and F. -F. Jin, 2018: Polar amplification dominated by local forcing and feedbacks. Nat. Climate Change, 8, 1076-1081, https://doi.org/10.1038/s41558-018-0339-y.
March 1, 2020