

L. Mudryk1, R. Brown1, C. Derksen1, K. Luojus2, B. Decharme3, and S. Helfrich4
1Climate Research Division, Environment and Climate Change Canada, Ottawa, ON, Canada
2Arctic Research Centre, Finnish Meteorological Institute, Helsinki, Finland
3Centre National de Recherches Météorologiques, Toulouse, France
4Center for Satellite Applications and Research, NESDIS, NOAA, College Park, MD, USA
Highlights
- After two years of above or near-average anomalies, the 2019 spring saw a return to below-average Arctic snow cover extent (SCE) anomalies, which were predominant over the 2005-16 time period. North American Arctic SCE anomalies in May and June were the 5th and 3rd lowest, respectively, in the 53-year record.
- Long-term trends for SCE remain negative across the Arctic: -3.4%/decade and -15.2%/decade for May and June, respectively (1981-2019).
- Exceptionally early snow melt occurred in March over the northwestern Canadian Arctic and Alaska, contributing to below-average April snow water equivalent and snow depth. Earlier than normal snow melt also occurred across the eastern Canadian Arctic driven by warm temperature anomalies.
- Winter season snow accumulation was near normal over Eurasia.
Snow covers the Arctic land surface (land areas north of 60° N) for up to 9 months each year, and influences the surface energy budget, ground thermal regime, and freshwater budget of the Arctic (Brown et al. 2017). Snow also interacts with vegetation, affects biogeochemical activity, and influences migration and access to forage for wildlife, which impacts terrestrial and aquatic ecosystems (Callaghan et al. 2011). The assessment provided here is based on an ensemble of datasets derived from satellite observations and reconstructions of snow cover from snowpack models driven by atmospheric reanalyses. Collectively, this basis provides a consistent picture of Arctic snow cover variability over the last five decades.
Snow across the Arctic land surface can be characterized by three variables: how much area is covered by snow (snow cover extent – SCE), how long snow continuously remains on the land surface (snow cover duration – SCD), and how much water is stored in solid form by the snowpack (a function of the snow depth and density, commonly expressed as snow water equivalent – SWE). We examine each of these variables in turn for the 2018/19 Arctic snow season.
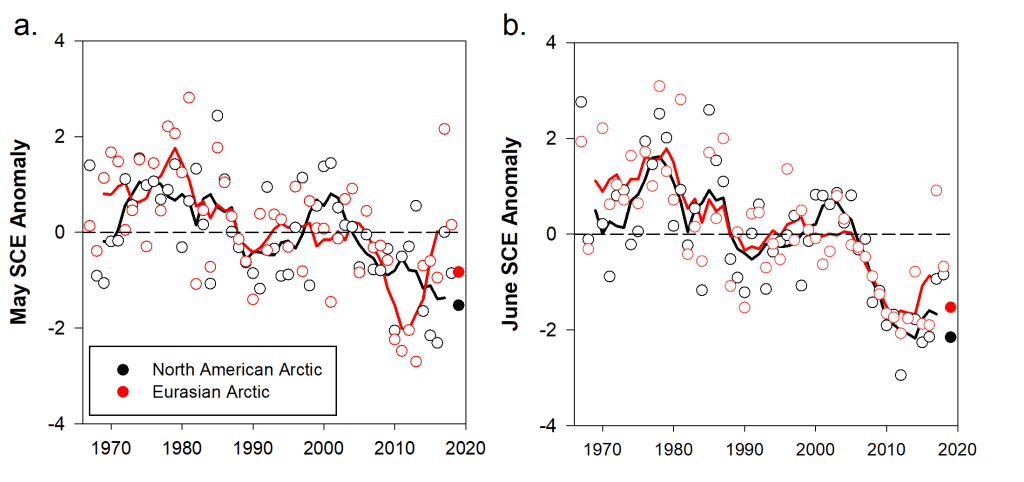
SCE anomalies (relative to the 1981-2010 climatology) for the Arctic in spring 2019 were computed separately for the North American and Eurasian sectors of the Arctic. Anomalies were derived from the NOAA snow chart climate data record, which extends from 1967 to present (maintained at Rutgers University; Estilow et al. 2015; http://climate.rutgers.edu/snowcover/; Fig. 1a,b). Eurasian Arctic spring SCE anomalies in 2019 were below average in both May and June. SCE anomalies over the North American Arctic were strongly negative in May and June, resulting in the 5th lowest and 3rd lowest, respectively, in the entire record.
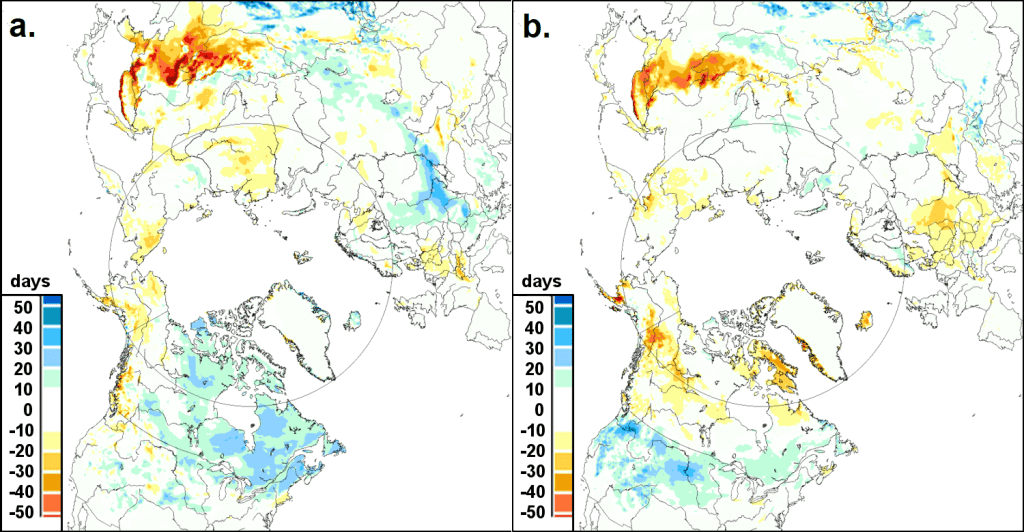
The spatial pattern of SCD anomalies across the Arctic region in the 2018/19 snow season (Fig. 2) was derived from the NOAA daily Interactive Multisensor Snow and Ice Mapping System (IMS) snow cover product (Helfrich et al. 2007), produced at 24-km resolution since 1998. Snow cover onset (Fig. 2a) was earlier than normal over the eastern Canadian Arctic and later than normal over the Eurasian Arctic and Alaska. These differences corresponded to a pattern of warm surface temperature anomalies over Eurasia and cold anomalies over eastern Canada during September and October, associated with observed atmospheric circulation patterns (see essay Surface Air Temperature). Snow-off dates (Fig. 2b) were near normal over most of the Eurasian Arctic. Over North America, earlier than usual melt occurred in March across extensive areas of northwestern Canada and Alaska and also in May over northeastern Canada (Baffin Island and northern Quebec), linked to persistent warm air advection over the Pacific and North Atlantic, respectively. The melt in May over Baffin Island and northern Quebec was also responsible for an early start to the Greenland melt season and contributed to near-record breaking mass loss from the ice sheet and led to substantial sea ice loss in the region as well (see essays Surface Air Temperature, Greenland Ice Sheet, and Sea Ice).
Snow depth anomalies (Fig. 3) were derived from the Canadian Meteorological Centre (CMC) daily gridded global snow depth analysis (Brasnett 1999), which combines air temperature and precipitation analyses with the assimilation of surface snow depth observations. This approach is required to obtain hemispheric estimates of snow depth because in situ observations alone are too spatially sparse to be representative. Snow depth over the 2018/19 season was near normal over Eurasia. Over North America, unusually rapid snowmelt, driven by warm temperatures in March over northwestern Canada and Alaska, resulted in reduced March snow depths over the region. Snow depths were even more below average by April (typically the month of maximum SWE across the Arctic)—a pattern that continued through to June, consistent with the shorter than average snow cover duration observed in the region (Fig. 2). The warm May and June temperature anomalies and early snow melt over Baffin Island and Northern Quebec (Fig. 2) are consistent with the lower than normal snow depths observed in these regions (Fig. 3c,d).

Four products were utilized to generate a multi-dataset SWE anomaly time series (1981-2019) for April (Fig. 4): (1) modern atmospheric reanalysis (The Modern-Era Retrospective Analysis for Research and Applications version 2; MERRA-2; Reichle et al. 2017); (2) reconstructed snow accumulation driven by ERA-interim meteorology with the temperature index model described by Brown et al. (2003); (3) the physical snowpack model Crocus (Brun et al. 2013); and (4) the European Space Agency GlobSnow product derived through a combination of satellite passive microwave data and climate station observations (Takala et al. 2011). The use of multiple SWE products facilitates the determination of inter-product spread through the time series. SWE estimates for 2019 (which don’t include Crocus due to data availability) indicate near-normal snow accumulation over the Eurasian Arctic but lower than normal SWE through April across the North American Arctic (consistent with negative snow depth anomalies in March and April; Fig. 3). Note that snow conditions over the North American Arctic were in contrast to an unusually deep March snowpack with associated longer snow cover duration observed in the midlatitudes (Fig. 3a).

In summary, snow accumulation during the 2018/19 winter was close to normal over the Eurasian Arctic. Over the North American Arctic, earlier than normal snow melt in northwestern Canada and Alaska resulted in below-average April SWE and below-average snow depth from March through June. Earlier than normal snow melt also occurred over Baffin Island during May and June. These anomalies over the western and eastern sectors of the North American Arctic combined to cause the 5th and 3rd lowest SCE in May and June, respectively, since 1967.
Long-term trends for SCE remain negative across the Arctic: 3.4 ± 2.1%/decade and 15.2 ± 6.4%/decade for May and June, respectively (1981-2019). The April trend in Arctic SWE over the 1981-2019 period is -2.7 ± 2.0%/decade yielding a decrease of more than 10% over the entire Arctic since 1981.
References
Brasnett, B., 1999: A global analysis of snow depth for numerical weather prediction. J. Appl. Meteor., 38, 726-740.
Brown, R., B. Brasnett, and D. Robinson, 2003: Gridded North American monthly snow depth and snow water equivalent for GCM evaluation. Atmos.-Ocean., 41, 1-14.
Brown, R., D. Vikhamar Schuler, O. Bulygina, C. Derksen, K. Luojus, L. Mudryk, L. Wang, and D. Yang, 2017: Arctic terrestrial snow cover. Snow, Water, Ice and Permafrost in the Arctic (SWIPA) 2017, Arctic Monitoring and Assessment Programme (AMAP), Oslo, Norway, 25-64.
Brun, E., V. Vionnet, A. Boone, B. Decharme, Y. Peings, R. Valette, F. Karbou, and S. Morin, 2013: Simulation of Northern Eurasian local snow depth, mass, and density using a detailed snowpack model and meteorological reanalyses. J. Hydrometeor., 14, 203-219, https://doi.org/10.1175/JHM-D-12-012.1.
Callaghan, T., M. Johansson, R. Brown, P. Groisman, N. Labba, V. Radionov, R. Barry, O. Bulygina, R. Essery, D Frolov, V. Golubev, T. Grenfell, M. Petrushina, V. Razuvaev, D. Robinson, P. Romanov, D. Shindell, A. Shmakin, S. Sokratov, S. Warren, and D. Yang, 2011: The changing face of Arctic snow cover: A synthesis of observed and projected changes. Ambio, 40, 17-31.
Estilow, T. W., A. H. Young, and D. A. Robinson, 2015: A long-term Northern Hemisphere snow cover extent data record for climate studies and monitoring. Earth Sys. Sci. Data, 7(1), 137-142.
Helfrich, S., D. McNamara, B. Ramsay, T. Baldwin, and T. Kasheta, 2007: Enhancements to, and forthcoming developments in the Interactive Multisensor Snow and Ice Mapping System (IMS). Hydrol. Process., 21, 1576-1586.
Reichle, R., C. Draper, Q. Liu, M. Girotto, S. Mahanama, R. Koster, and G. De Lannoy, 2017: Assessment of MERRA-2 land surface hydrology estimates. J. Climate, 30(8), 2937–2960, https://doi.org/10.1175/JCLI-D-16-0720.1.
Takala, M., K. Luojus, J. Pulliainen, C. Derksen, J. Lemmetyinen, J-P Kärnä, and J. Koskinen, 2011: Estimating Northern Hemisphere snow water equivalent for climate research through assimilation of space-borne radiometer data and ground-based measurements. Remote Sens. Environ., 115, 3517-3529.
November 19, 2019