M. Tedesco1,2, T. Moon3, J. K. Andersen3,4, J. E. Box5, J. Cappelen6, R. S. Fausto5, X. Fettweis7, B. Loomis8, K. D. Mankoff5, T. Mote9, C. J. P. P. Smeets10, D. van As5, and R. S. W. van de Wal4,10
1Lamont Doherty Earth Observatory of Columbia University, Palisades, NY, USA
2Goddard Institute of Space Studies, NASA, New York, NY, USA
3National Snow and Ice Data Center, Boulder, CO, USA
4Institute for Marine and Atmospheric Research Utrecht, Utrecht University, Utrecht, The Netherlands
5Geological Survey of Denmark and Greenland, Copenhagen, Denmark
6Danish Meteorological Institute, Copenhagen, Denmark
7University of Liege, Liege, Belgium
8Goddard Space Flight Center, NASA, Greenbelt, MD, USA
9Department of Geography, University of Georgia, Athens, GA, USA
10Department of Physical Geography, Utrecht University, Utrecht, The Netherlands
Highlights
- Melting in 2019 started early, in April, exceeding the 1981-2010 median during most of June, July, and the first half of August and covering roughly 95% of the ice sheet.
- Surface air temperatures for the 2018/19 winter and the 2019 spring and summer periods were above or near the 1981-2010 average temperatures.
- The updated trend for total mass loss obtained from the GRACE and GRACE-FO satellites estimates for the period May 2002-May 2019 is -267 ± 3 Gt yr-1, which is equal to roughly 0.7 mm yr-1 of global average sea level rise.
- Indicative of extensive melting, the surface albedo in summer 2019 was 77.7%, the second lowest value (after 2012) recorded during the 20-year MODIS period (2000-19).
- Ice discharge from most regions has been approximately steady or declining for the past decade, including 2019.
Introduction
The Greenland ice sheet sits atop the largest island in the world and, as the second largest ice sheet on the Earth, contains the equivalent of roughly 7.4 m of global mean sea level rise (Morlighem et al. 2017). While the ice sheet was likely in balance (i.e., ice mass gain was balancing ice mass loss) during the 1970s, 1980s, and early 1990s (Mouginot et al. 2019), it began to lose mass in earnest beginning in the mid- to late 1990s. Continued observations and measurements of the Greenland ice sheet are critical to understanding whether ice mass loss will continue to accelerate and the full implications of this anticipated change. As Greenland loses ice, the additional cold freshwater to the ocean not only changes sea levels, but also impacts ocean properties and circulation locally and regionally (e.g., Luo et al. 2016), alters nutrient and sediment fluxes (e.g., Overeem et al. 2017; Cape et al. 2019), and changes local ecosystems (e.g., Hopwood et al. 2018). Changes at the ice sheet surface also feedback to influence future melt (e.g., Ryan et al. 2019).
Direct observations of the Greenland ice sheet from fall 2018 through 2019 reveal another year of dramatic ice loss. The extent and magnitude of ice loss rival 2012, the previous record year of ice loss. This rapid, ongoing change across Greenland is evident in observations of surface melt area, total ice loss, surface albedo (similar to reflectivity), and motion and ice loss via marine-terminating glaciers.
Surface melting
Roughly 95% of the Greenland ice sheet surface underwent melting during the 2019 summer. Observations derived from brightness temperatures measured by the Special Sensor Microwave Imager/Sounder (SSMIS) passive microwave radiometer (e.g., Mote 2007; Tedesco et al. 2013) indicate that surface melt started early in 2019, around mid-April, 6 to 8 weeks before the long-term average (1981-2010 baseline, Fig. 1a). Similar conditions occurred in 2012, the record melt year, when melting also started at the beginning of April. Melt extent in 2019 exceeded the 1981-2010 median during most of June, July, and the first half of August (Fig. 1a).
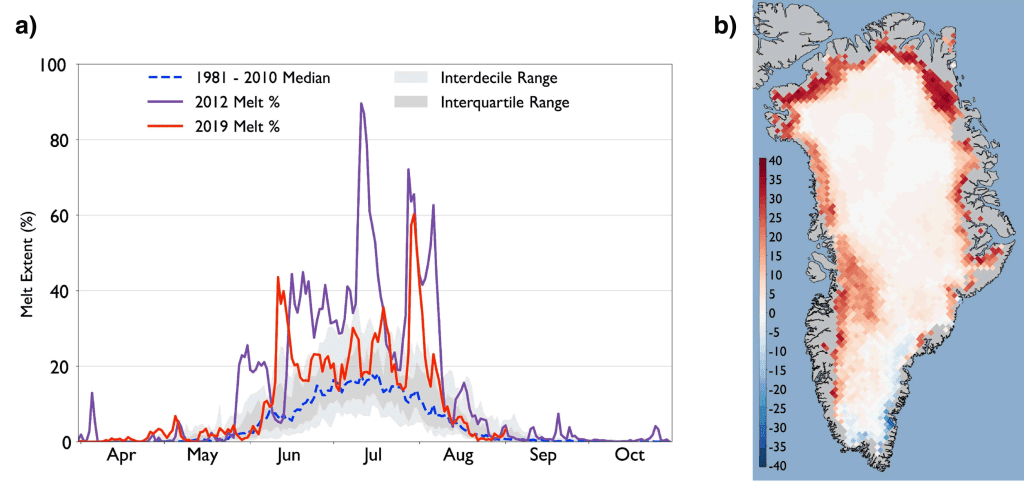
In 2019, the maximum daily extent of ice sheet surface melt was 60.3% (the maximum daily value exceeding 90% in 2012), occurring on 31 July. In comparison, the average maximum daily extent for the same day (i.e., 31 July) during 1981-2010 is 39.8%. When considering the overall melt extent (i.e., areas that underwent melting at any time during summer), 2019 matched the values reached in 2012, with ~95% of the ice sheet surface experiencing melt. To put this in context, the 1981-2010 averaged value for the total area of the Greenland ice sheet undergoing melting (at any time) during summer is ~64%.
Melt duration in 2019 exceeded the 1981-2010 mean for most of the ice sheet ablation zone. The entire northern periphery of the ice sheet had at least 20 more days with melt compared to the mean (Fig. 1b). The exception was a thin strip of the southeast, where melt duration was below the 1981-2010 mean. The magnitude and timing of 2019 surface melt were consistent with persistent, high-pressure conditions occurring over Greenland during summer. These high-pressure conditions reached their peak at the end of July, when the seasonal melt extent maximum was established. The persistence of the high-pressure systems promoted an increase in incoming solar radiation associated with reduced cloud cover and, consequently, below-normal summer snowfall.
Surface mass balance
Net ice ablation in 2019 at all 18 PROMICE weather station sites (https://www.promice.dk/) in the ablation area around the Greenland ice sheet was above the 12-year PROMICE 2008-19 average. At lower elevations along the ice sheet margin net ablation recorded by PROMICE stations exceeded the 2008-19 average by 49% in the southwest (KAN), 44% in the northwest (THU), and 39% in the northeast (KPC). Ablation at the ice sheet margin also exceeded the 1981-2010 average (re-referenced following van As et al. 2016) at all sites, most being well beyond uncertainty and, again, most notably again in the southwest (79 ± 20%), northwest (117 ± 45%), and northeast (70 ± 30%) (Fig. 2a).
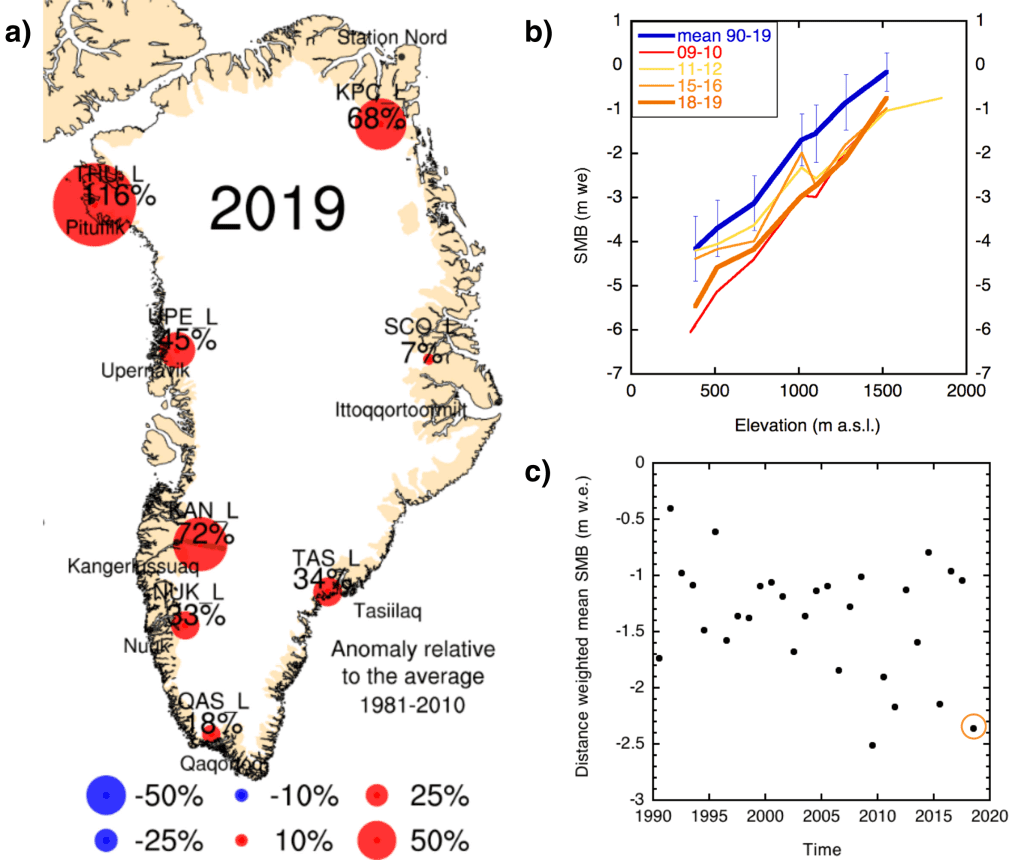
Consistent with PROMICE data, summer 2019 had high ablation rates along the K-transect (67° N, western ablation zone). Figure 2b shows the K-transect 2018/19 mass balance profile with respect to the average over the entire 29-year measurement period. Comparing 2018/19 to previous years, only the 2009/10 mass balance year had slightly more ablation, particularly near the ice sheet margin. Figure 2c shows the distance-weighted (e.g., scaled by the relative position of each station within the K-transect) average surface mass balance as a function of time along the transect, indicating a relatively large interannual variability. The 2018/19 mass balance gradient in the K-transect area was 3.9 mm w.e./m yr (w.e. = water equivalent), one standard deviation above the average over the last 29 years. The equilibrium line altitude (i.e., the elevation where mass loss is balanced by mass gain) has risen at a rate of around 5 meters per year over the last 29 years.
Total mass balance
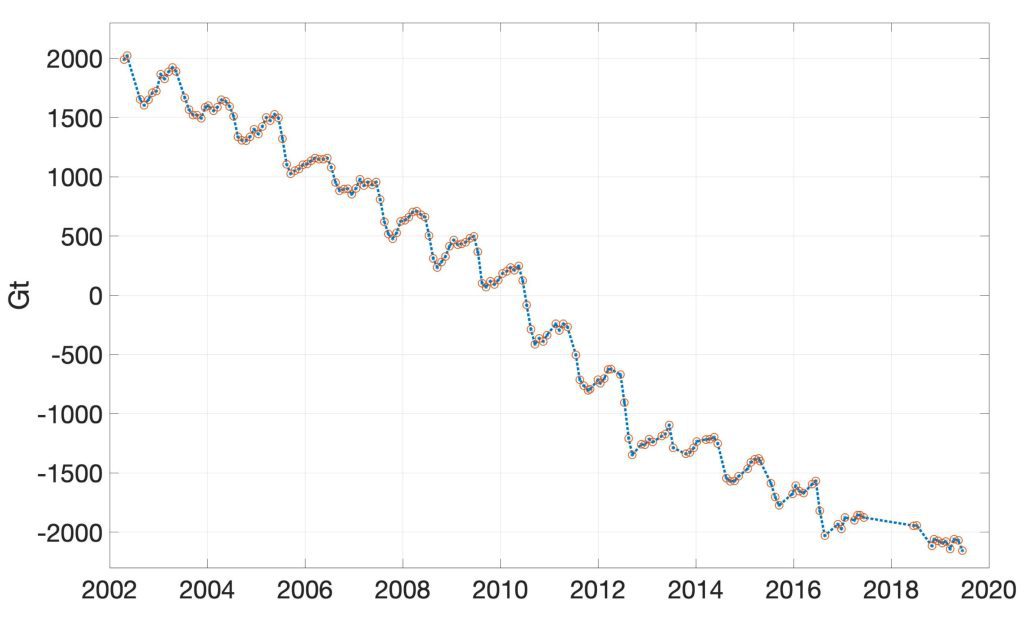
The GRACE (2002-17, https://www.nasa.gov/mission_pages/Grace/index.html) and GRACE Follow-On (GRACE-FO, 2018-present, https://gracefo.jpl.nasa.gov/mission/overview/) satellite missions have revolutionized our ability to monitor ice loss by providing estimates of monthly changes in the total mass of the Greenland ice sheet. The GRACE-FO mission was launched on 22 May 2018, creating a gap from October 2017 through May 2018 between the GRACE and GRACE-FO measurements. The GRACE and GRACE-FO time series (Fig. 3) is determined using techniques described in Wahr et al. (1998), Luthcke et al. (2013), and Loomis et al. (2019a,b). The updated total ice mass loss trend for the GRACE period (May 2002-October 2017) is -282 ± 15 Gt yr-1. The trend for the GRACE-FO period (May 2018-May 2019) is -166 ± 46 Gt yr-1 (note this period does not include summer of 2019, when losses occur). The larger GRACE-FO trend uncertainty is due to the much shorter data record length. Even with this large uncertainty, we do observe a statistically significant reduction in the rate of mass loss during the first 11 GRACE-FO months, as compared to the full GRACE data span. The updated mass loss trend for the combined GRACE and GRACE-FO periods (May 2002-May 2019) is -267 ± 3 Gt yr-1, which is equal to roughly 0.7 mm yr-1 of global average sea level rise. To put this value in context, while GRACE measurements do not exist prior to 2002, the latest study of Greenland mass loss covering 1972-2000 suggests that decadal mass change rates during this time ranged from +47 ± 21 Gt yr-1 gain during 1972-80 to 51 ± 17 Gt yr-1 mass loss during 1980-90 (Mouginot et al. 2019).
Albedo
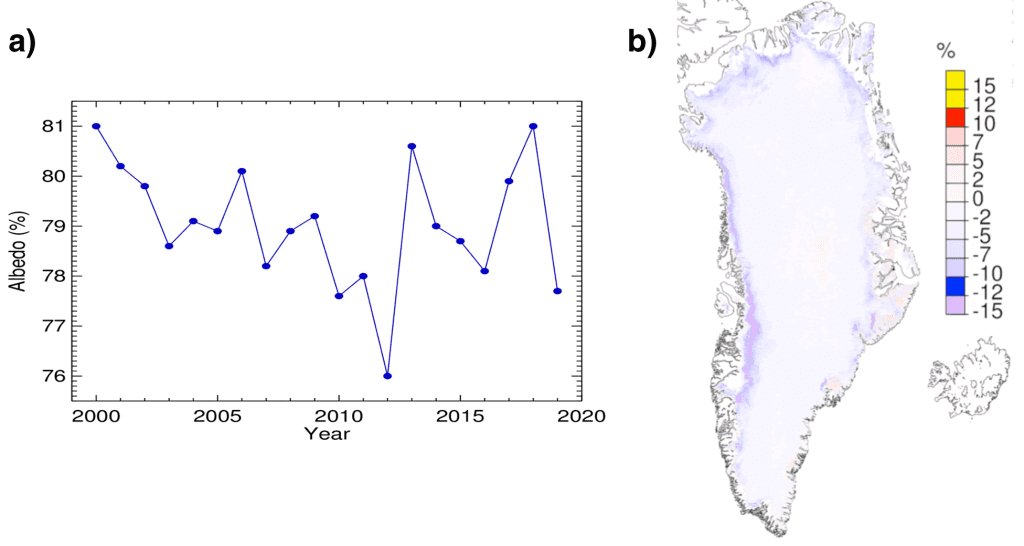
The surface albedo can be interpreted as the fraction of incident sunlight reflected by a surface. Summer 2019 (June through August, JJA) surface broadband albedo, estimated from the Moderate Resolution Imaging Spectroradiometer (MODIS; after Box et al. 2017) and averaged over the Greenland ice sheet was 77.7% (Fig. 4a). This is the second lowest value of the 20-year record (2000-19), with a value similar to 2010. The record low for surface broadband albedo was set in 2012 (76.0%). The spatial distribution of albedo anomalies (Fig. 4b) is consistent with the thin snow cover observed along the western ice sheet and the early onset and strong melting in 2019. The 2000-19 trend for summer broadband albedo from MODIS is -1.0% ± 1.0 per year.
Surface air temperature
Measurements at 20 Danish Meteorological Institute (DMI) weather stations indicate widespread above or near average air temperatures (1981-2010 baseline) for winter 2018/19 (December through February, DJF), spring 2019 (March through May, MAM) and summer 2019 (JJA). The 2018 autumn season (September through November, SON) had colder or near-average surface temperatures in the western and southern parts of Greenland and warmer or near-average values in the northern and eastern portions. At DMI Summit, in the interior of the ice sheet, autumn 2018 and winter 2018/19 were colder than average, but spring and summer were warmer than average. A record low was set for October 2018 at DMI Summit, including a new record-breaking cold temperature of -55.4°C on 26 October (previous record was -55.2°C).
Consistent with net ablation observations, summer temperatures in 2019 were above the 2008-19 average by more than one standard deviation at all PROMICE measurement sites along the northern, northwestern, and northeastern slopes (stations above 65° N). Out of all January-August 2019 DMI station-months (n=180), 24% of monthly temperatures were more than one standard deviation above average, and only 10% were one standard deviation below average.
Ice discharge and glaciers
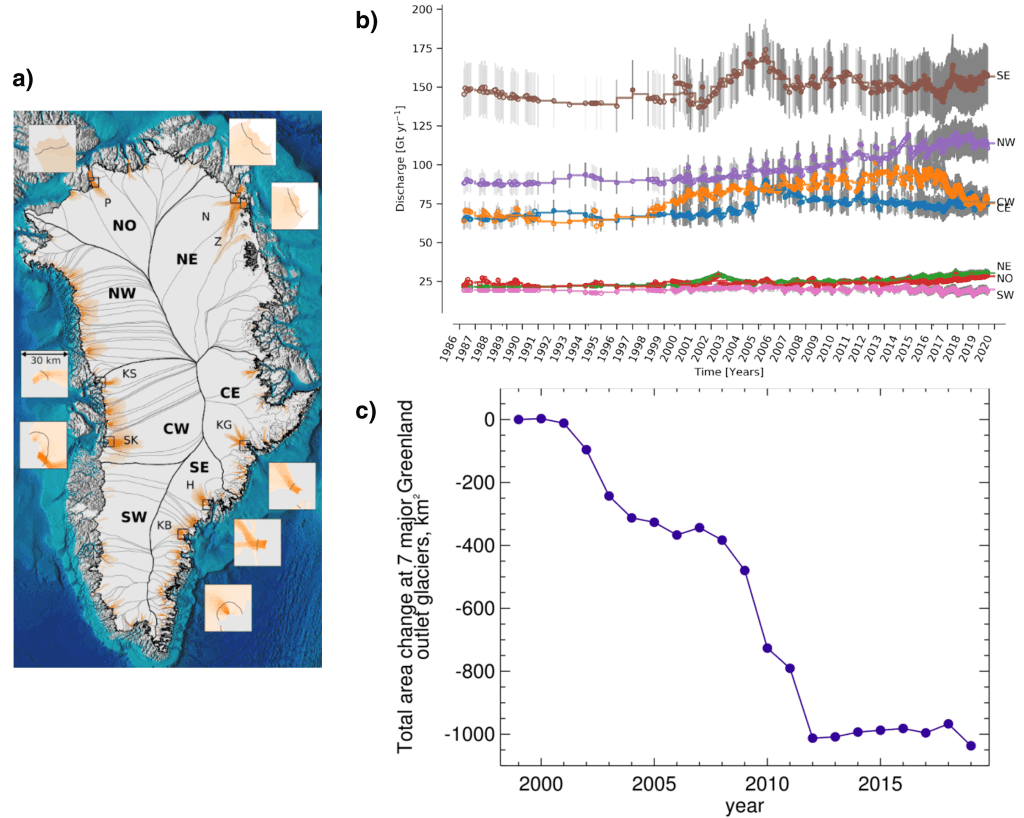
Along with losing mass via surface melt, Greenland also loses mass via the direct loss—or calving—of solid ice (i.e., icebergs) into the ocean. Solid ice discharge occurs where marine-terminating glaciers meet the ocean. PROMICE estimates for the Greenland ice sheet, following Mankoff et al. (2019), indicate that as of August 2019 solid ice discharge has averaged 497 ± 50 Gt yr-1. As a comparison, the discharge for the period 1986-2010 was 462 ± 46 Gt yr-1. Figure 5 (a,b) illustrates that the southeast marine-terminating glaciers are responsible for 30-34% of ice-sheet wide discharge (139-167 Gt yr-1) over the 1986 to 2019 period. By comparison, the glaciers in the north, northeast, and southwest regions, which are predominantly land-terminating, together were responsible for ~31% of ice-sheet wide discharge (131-168 Gt yr-1) during this same period. The discharge from most regions has been approximately steady or declining for the past decade. The northwest is the only region exhibiting a persistent increase in discharge from ~89 to 113 Gt yr-1 (21% increase) over the 1998-2019 period. The largest contributing region is the southeast, discharging a high of 166 ± 19 Gt in 2005 and dropping to 146 ± 18 Gt in 2016. However, discharge in the southeast region has increased its contributions in the last couple of years, reaching 155 ± 16 Gt during the last year. The discharge in the central west, which is dominated by Sermeq Kujalleq (Jakobshavn Isbræ), has seen an almost 20% decrease in discharge over the past two years. Central west area discharge has remained steady during the past year at 77 Gt.
Marine-terminating glacier front annual area change measurements from Sentinel-2, LANDSAT, and ASTER satellite optical imagery since 1999 (Andersen et al. 2019) indicate that the 2019 net area change of seven major glaciers from across the ice sheet relative to the previous year (2018) was -71.2 ± 1.4 km2 (i.e., glacier retreat, Fig. 5c). The 2018/19 annual change stands out as the largest area loss since a 2013-18 period of relative stability. Understanding the reasons behind the observed decline in the rate of ice loss in recent years across the Greenland ice sheet is an area of active research (e.g., Mankoff et al. 2019). The individual discharge rates of the seven glaciers used to document the net area change are among the largest observed via satellite.
Acknowledgments
M. Tedesco would like to acknowledge financial support by the National Science Foundation (PLR-1603331, PLR-1713072), NASA (NNX17AH04G, 80NSSC17K0351) and the Heising-Simons foundation. Financial support for measurements along the K-transect was received from the Dutch Polar Program of NWO. Data from the Programme for Monitoring of the Greenland Ice Sheet (PROMICE) and the Greenland Analogue Project (GAP) were provided by the Geological Survey of Denmark and Greenland (GEUS) at http://www.promice.dk.
References
Andersen, J. K., R. S. Fausto, K. Hansen, J. E. Box, S. B. Andersen, A. P. Ahlstrøm, D. van As, M. Citterio, W. Colgan, N. B. Karlsson, K. K. Kjeldsen, N. J. Korsgaard, S. H. Larsen, K. D. Mankoff, A. Ø. Pedersen, C. L. Shields, A. Solgaard, and B. Vandecrux, 2019: Update of annual calving front lines for 47 marine terminating outlet glaciers in Greenland (1999-2018). Geol. Surv. Den. Greenl., 43, e2019430202, https://doi.org/10.34194/GEUSB-201943-02-02.
Box, J. E., D. van As, and K. Steffen, 2017: Greenland, Canadian and Icelandic land ice albedo grids (2000-2016). Geol. Surv. Den. Greenl., 38, 53-56.
Cape, M. R., F. Straneo, N. Beaird, R. M. Bundy, and M. A. Charette, 2019: Nutrient release to oceans from buoyancy-driven upwelling at Greenland tidewater glaciers. Nat. Geosci., 12, 34–39, https://doi.org/10.1038/s41561-018-0268-4.
Hopwood, M. J., D. Carroll, T. J. Browning, L. Meire, J. Mortensen, S. Krisch, and E. P. Achterberg, 2018: Non-linear response of summertime marine productivity to increased meltwater discharge around Greenland. Nat. Commun., 9, 3256, https://doi.org/10.1038/s41467-018-05488-8.
Loomis, B. D., S. B. Luthcke, and T. J. Sabaka, 2019a: Regularization and error characterization of GRACE mascons. J. Geodesy, 93(9), 1381-1398, https://doi.org/10.1007/s00190-019-01252-y.
Loomis, B. D., K. E. Rachlin, and S. B. Luthcke, 2019b: Improved Earth oblateness rate reveals increased ice sheet losses and mass-driven sea level rise. Geophys. Res. Lett., 46, 6910- 6917, https://doi.org/10.1029/2019GL082929.
Luo, H., R. M. Castelao, A. K. Rennermalm, M. Tedesco, A. Bracco, P. L. Yager, and T. L. Mote, 2016: Oceanic transport of surface meltwater from the southern Greenland ice sheet. Nat. Geosci., 9(7), 528-532, https://doi.org/10.1038/ngeo2708.
Luthcke, S. B., T. J. Sabaka, B. D. Loomis, A. A. Arendt, J. J. McCarthy, and J. Camp, 2013: Antarctica, Greenland and Gulf of Alaska land ice evolution from an iterated GRACE global mascon solution. J. Glaciol., 59(216), 613-631, https://doi.org/10.3189/2013JoG12J147.
Mankoff, K. D., W. Colgan, A. Solgaard, N. B. Karlsson, A. P. Ahlstrøm, D. van As, J. E. Box, S. A. Khan, K. K. Kjeldsen, J. Mouginot, and R. S. Fausto, 2019: Greenland Ice Sheet solid ice discharge from 1986 through 2017. Earth Syst. Sci. Data, 11, 769-786, https://doi.org/10.5194/essd-11-769-2019. Data product updated through 2019-08-16 at http://promice.org.
Morlighem, M., and Coauthors, 2017: BedMachine v3: Complete bed topography and ocean bathymetry mapping of Greenland from multibeam echo sounding combined with mass conservation. Geophys. Res. Lett., 44(21), 11051-11061, https://doi.org/10.1002/2017GL074954.
Mote, T., 2007: Greenland surface melt trends 1973-2007: Evidence of a large increase in 2007. Geophys. Res. Lett., 34, L22507.
Mouginot, J., E. Rignot, A. A. Bjørk, M. van den Broeke, R. Millan, M. Morlighem, B. Noël, B. Scheuchl, and M. Wood, 2019: Forty-six years of Greenland Ice Sheet mass balance from 1972 to 2018. P. Natl. Acad. Sci. USA, 116(19), 9239-9244, https://doi.org/10.1073/pnas.1904242116.
Overeem, I., B. D. Hudson, J. P. M. Syvitski, A. B. Mikkelsen, B. Hasholt, M. R. Van Den Broeke, B. P. Y. Noël, and M. Morlighem, 2017: Substantial export of suspended sediment to the global oceans from glacial erosion in Greenland. Nat. Geosci., 10(11), 859-863, https://doi.org/10.1038/ngeo3046.
Ryan, J. C., L. C. Smith, D. van As, S. W. Cooley, M. G. Cooper, L. H. Pitcher, and A. Hubbard, 2019: Greenland Ice Sheet surface melt amplified by snowline migration and bare ice exposure. Sci Adv., 5(3), eaav3738, https://doi.org/10.1126/sciadv.aav3738.
Tedesco, M., X. Fettweis, T. Mote, J. Wahr, P. Alexander, J. Box, and B. Wouters, 2013: Evidence and analysis of 2012 Greenland records from spaceborne observations, a regional climate model and reanalysis data. Cryosphere, 7, 615-630.
van As, D., R. S. Fausto, J. Cappelen, R. S. van de Wal, R. J. Braithwaite, and H. Machguth, 2016: Placing Greenland ice sheet ablation measurements in a multi-decadal context. Geol. Surv. Den. Greenl., 35, 71-74.
Wahr, J., M. Molenaar, and F. Bryan, 1998: Time variability of the Earth’s gravity field: Hydrological and oceanic effects and their possible detection using GRACE. J. Geophys. Res., 103( B12), 30205- 30229, https://doi.org/10.1029/98JB02844.
November 26, 2019