
M. -L. Timmermans1
1Yale University, New Haven, CT, USA
Highlights
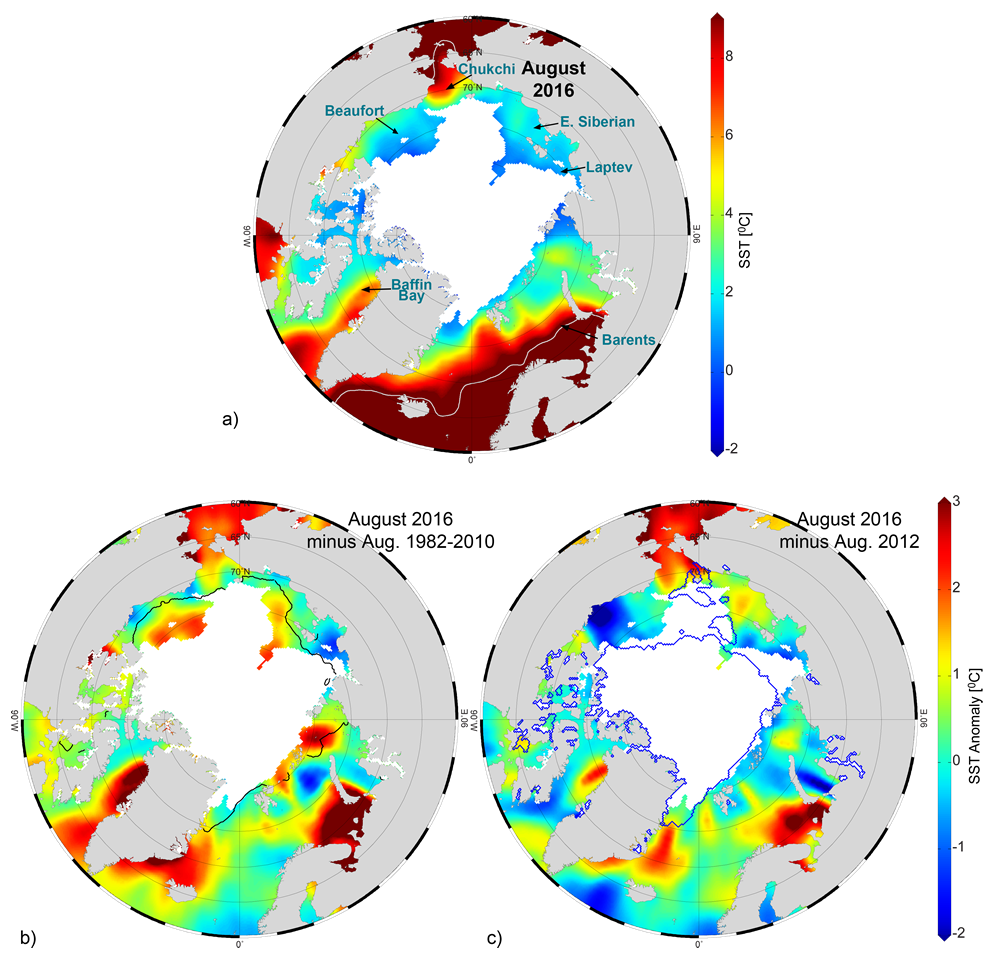
- Sea surface temperatures (SSTs) in August 2016 were up to +5° C warmer than the 1982-2010 August mean in regions of the Barents and Chukchi seas, and off the east and west coasts of Greenland.
- In the Arctic Basin, spatial patterns of August 2016 SST anomalies relative to the 1982-2010 August mean are linked to regional variability in sea-ice retreat, regional air temperature, and advection of waters from the Pacific and Atlantic oceans.
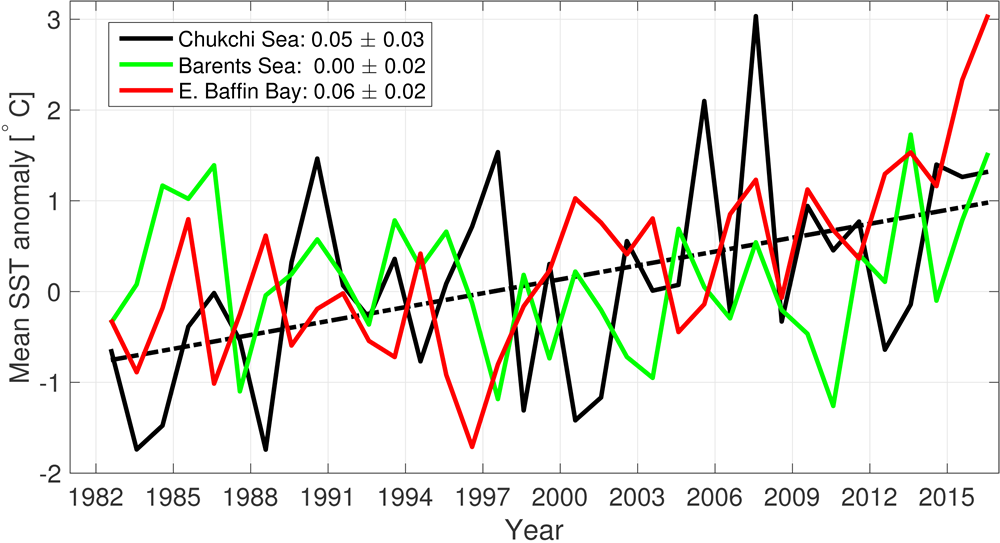
- The Chukchi Sea and eastern Baffin Bay show significant ocean surface warming trends; linear trends over 1982-2016 indicate August SSTs are increasing at ~0.5° C/decade in these regions.
Summer sea surface temperatures in the Arctic Ocean are set by absorption of solar radiation into the surface layer. In the Barents and Chukchi seas, there is an additional contribution from advection of warm water from the North Atlantic and Pacific Oceans (for a recent assessment of this in the Chukchi Sea, see Serreze et al., 2016). Solar warming of the ocean surface layer is influenced by the distribution of sea ice (with more solar warming in ice-free regions), cloud cover, water color, and upper-ocean stratification (river influxes influence the latter two). Here August SSTs are reported, which are an appropriate representation of Arctic Ocean summer SSTs and are not affected by the cooling and subsequent sea-ice growth that takes place in the latter half of September. SST data are from the NOAA Optimum Interpolation (OI) SST Version 2 product (OISSTv2), which is a blend of in situ and satellite measurements (Reynolds et al. 2002, 2007). Compared to in situ temperature measurements, the OISSTv2 product showed average correlations of about 80%, with an overall cold SST bias of -0.02° C (Stroh et al., 2015).
Mean SSTs in August 2016 in ice-free regions ranged from ~0° C in some regions to around +7° C to +8° C in the Chukchi Sea and eastern Baffin Bay off the west coast of Greenland, and up to +11° C in the Barents Sea (Fig. 5.1a). Most boundary regions and marginal seas of the Arctic had anomalously warm SSTs in August 2016 compared to the 1982-2010 August mean (Fig. 5.1b). SSTs in these regions, which are mostly ice-free in August, are linked to the timing of local sea-ice retreat; for example, anomalously warm SSTs (>+2° C relative to 1982-2010) in August 2016 in the Beaufort Sea may be associated with low sea-ice extents and exposure of surface waters to direct solar heating. Compared to August 2012 (the summer of lowest minimum sea-ice extent in the satellite record, 1979-present) Beaufort Sea SSTs were up to 2° C cooler in 2016 (Fig. 5.1c). August 2016 SSTs were cooler relative to the 1982-2010 average along the southern boundaries of the Beaufort Sea and East Siberian and Laptev Seas (Fig. 5.1b), where summer air temperatures were also below average (see essay on Surface Air Temperature); cooler than average SSTs were also notable in the northern Barents Sea. August 2016 SST anomalies off the east and west coasts of Greenland, and in the southern Barents Sea were up to 5° C warmer than the 1982-2010 average, and coincide with regional surface air temperatures that were up to 5° C warmer in July-August 2016 compared to 1982-2010 July-August mean temperatures (see essay on Surface Air Temperature); SSTs in these regions were up to 3° C warmer in August 2016 compared to August 2012 (Fig. 5.1c).
The Chukchi Sea and eastern Baffin Bay are the only marginal regions to exhibit a statistically significant warming trend over the duration of the record (August SSTs in these regions are warming at a rate of about +0.5° C decade-1 since 1982, based on a linear fit; Fig. 5.2). In the Chukchi Sea, this trend coincides with declining trends in summer sea ice extent. In other marginal seas, for instance the Barents Sea, warm August SST anomalies observed in 2016 are of similar magnitude to warm anomalies observed in past decades (Timmermans and Proshutinsky 2015; 2016).
References
Reynolds, R. W., N. A. Rayner, T. M. Smith, D. C. Stokes, and W. Wang, 2002: An improved in situ and satellite SST analysis for climate. J. Climate, 15, 1609-1625.
Reynolds, R. W., T. M. Smith, C. Liu, D. B. Chelton, K. S. Casey, and M. G. Schlax, 2007: Daily high-resolution-blended analyses for sea surface temperature. J. Climate, 20, 5473-5496, and see http://www.esrl.noaa.gov/psd/data/gridded/data.noaa.oisst.v2.html.
Serreze, M. C., A. D. Crawford, J. Stroeve, A. P. Barrett and R. A. Woodgate, 2016: Variability, trends and predictability of seasonal sea ice retreat and advance in the Chukchi Sea. J. Geophys. Res., accepted for publication.
Stroh, J. N., G. Panteleev, S. Kirillov, M. Makhotin, and N. Shakhova, 2015: Sea-surface temperature and salinity product comparison against external in situ data in the Arctic Ocean. J. Geophys. Res. Oceans, 120, 7223-7236, doi:10.1002/2015JC011005.
Timmermans, M. -L. and A. Proshutinsky, 2015: [The Arctic] Sea Surface Temperature [in “State of the Climate in 2014”]. Bull. Amer. Meteor. Soc., 96 (7), S147-S148.
Timmermans, M. -L. and A. Proshutinsky, 2016: [The Arctic] Sea Surface Temperature [in “State of the Climate in 2015”]. Bull. Amer. Meteor. Soc., 97 (8), S137-S138.
November 15, 2016