S. M. Natali1, B. Rogers1, E. A. G. Schuur2, V. Romanovsky3, H. Alcock4, K. Arndt1, E. S. Euskirchen5,6, G. Falvo2, G. Fiske1, G. Hould-Gosselin4, J. Hung1, A. Kholodov3, S. Potter1, O. Sonnentag4, and A. -M. Virkkala1
1Woodwell Climate Research Center, Falmouth, MA, USA
2Center for Ecosystem Science and Society, Northern Arizona University, Flagstaff, AZ, USA
3Geophysical Institute, University of Alaska Fairbanks, Fairbanks, AK, USA
4Département de Géographie, Université de Montréal, Montréal, QC, Canada
5Institute of Arctic Biology, University of Alaska Fairbanks, Fairbanks, AK, USA
6Department of Biology and Wildlife, University of Alaska Fairbanks, Fairbanks, AK, USA
Headlines
- When including wildfire emissions, the Arctic tundra region has shifted to a carbon dioxide (CO2) source and is a consistent methane (CH4) source.
- In 2024, permafrost temperatures were the highest on record at nearly half of Alaska long-term monitoring stations. On average, the year represented the second-warmest permafrost temperatures on record for Alaska.
- Wildfires in North American permafrost regions have increased since the mid-20th century, and circumpolar wildfire emissions have averaged 207 teragrams of carbon (Tg C) per year since 2003. 2024 was the second highest year for wildfire emissions north of the Arctic Circle.
Introduction
The terrestrial Arctic region has been a carbon sink for thousands of years, meaning that there has been a net removal of carbon dioxide (CO2) from the atmosphere by plants and storage as organic carbon in soils and permafrost (perennially frozen ground). Climate warming can stimulate plant productivity and growth (see essay Tundra Greenness), resulting in enhanced rates of CO2 removal from the atmosphere. At least 1.4 to 1.6 trillion tonnes of carbon (Hugelius et al. 2014; Schuur et al. 2022) have accumulated in terrestrial soils and permafrost across the region. Despite increased plant growth and CO2 uptake, recent indicators suggest that some locations in the Arctic are becoming a net source of carbon to the atmosphere. Increasing surface air temperatures (see essay Surface Air Temperature) are causing permafrost to warm and thaw (Smith et al. 2024). Once thawed, permafrost carbon can be decomposed by microbes and released into the atmosphere as greenhouse gasses, CO2 and methane (CH4). In addition to changes in plant and microbial processing of carbon, disturbances, such as wildfire, are resulting in pulse releases of CO2 and CH4 that may shift the Arctic from a net carbon sink to a source.
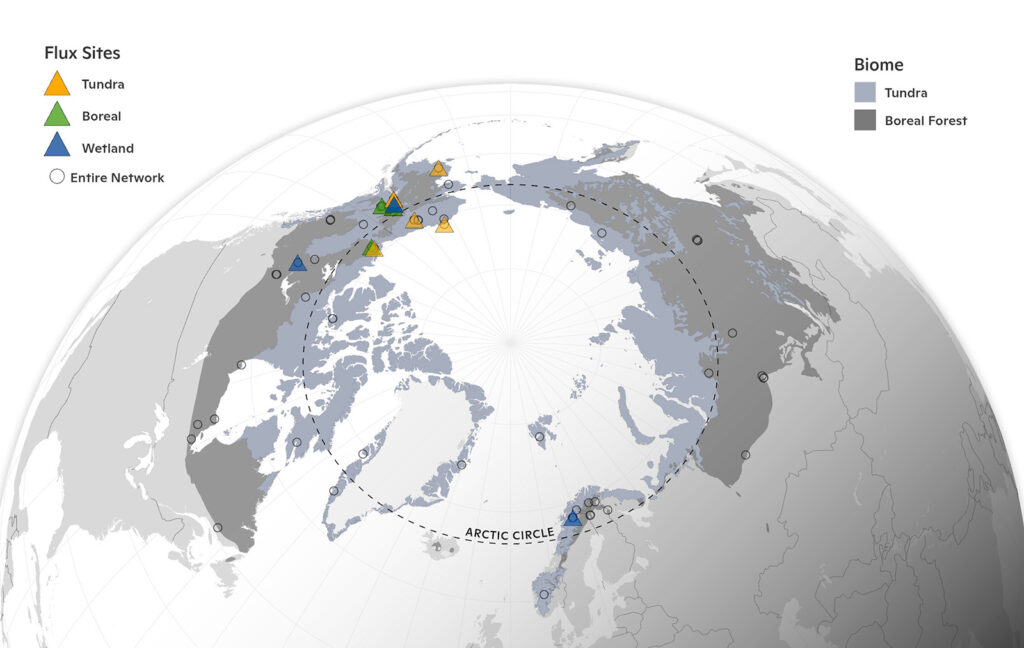
Here, we describe trends in permafrost temperatures, wildfire, and carbon cycling (CO2 and CH4) at select long-term terrestrial monitoring sites and across the Arctic. Our discussion of the Arctic region considers all tundra and boreal lands within the northern permafrost region (Brown et al. 2002; Fig. 1), which covers 16.6 x 10⁶ km2.
Permafrost temperature trends
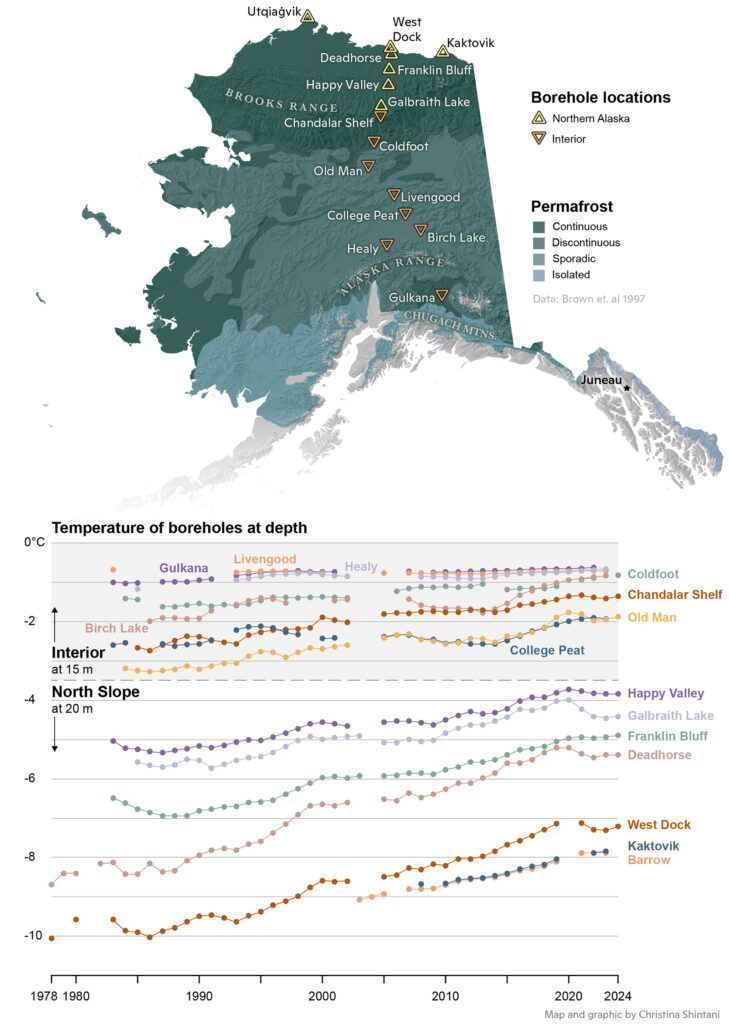
Permafrost temperatures have been monitored across the Arctic for almost half a century, providing a long-term record of climate change impacts. Deeper permafrost temperatures (≥ 15 m), which are reported here, are less sensitive to seasonal temperature fluctuations than surface measurements, and thus, these long-term trends are good indicators of permafrost response to climate change. Here, we report trends in deep permafrost temperatures across Alaska, which, similar to permafrost temperatures across the Arctic, have been increasing for the past several decades (Smith et al. 2024). These warming trends are also associated with a deepening of the seasonally thawed soils, which can have important implications for carbon cycling.
Permafrost temperatures in 2024 were the highest on record at 9 of 20 long-term monitoring sites across Alaska. Over the past four decades, the average increase in permafrost temperature ranged from 0.3 to 0.7°C per decade in colder permafrost in Northern Alaska (i.e., North Slope) and from 0.02 to 0.3°C per decade in warmer permafrost in Interior Alaska (Fig. 2). Greater permafrost warming rates at higher latitudes compared to lower latitudes are partly due to greater air temperature increases at higher latitudes. Additionally, permafrost with temperatures close to 0°C—such as those in lower latitudes in Interior Alaska—require energy (i.e., latent heat) to melt ground ice before temperatures can continue rising, bringing about reduced permafrost warming rates.
Site-level carbon fluxes
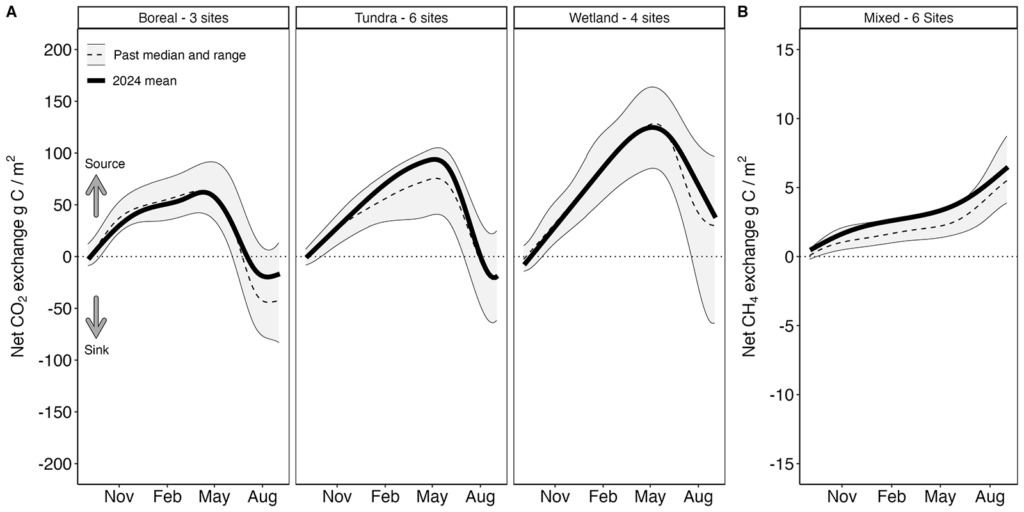
Published observations from several long-term carbon flux monitoring sites have shown that some ecosystems have already shifted from carbon sinks to carbon sources (Schuur et al. 2021; Euskirchen et al. 2024). Here, we report net CO2 and CH4 exchange between ecosystems and the atmosphere through August 2024 for 13 locations (Fig. 1) in the North American and European permafrost region, each having between 6 and 17 years of data (Fig. 3). It is important to note that the fluxes from these sites do not directly correspond to the average fluxes for the entire biomes they fall within or the region as a whole. For the 12-month period of September 2023 to August 2024, the three boreal forest sites were on average a net sink of CO2, taking up 17 g CO2-C/m2/y from the atmosphere, which was slightly less CO2 uptake than their long-term average. During the same 12-month period, the six tundra sites took up an average of 19 g CO2-C/m2/y, which was similar to their long-term average uptake. The four wetland sites were stronger CO2 sources than in previous years, releasing an average of 46 g CO2-C/m2/y; however, larger data compilations demonstrate wetlands to be on average CO2 sinks (Ramage et al. 2024). The six sites that measured CH4 fluxes (three wetland, two tundra, one boreal forest) were on average net emitters of CH4 (7 g CH4-C/m2/y) during this period. Fire, logging, and other disturbances at the regional scale, which may cause these biomes to become net carbon sources, are not included in these site-level assessments.
Wildfire
Climate change has been intensifying high-latitude fire regimes, resulting in increased burned area, fire intensity, and carbon emissions. Vegetation regrowth after wildfire often re-sequesters CO2 from the atmosphere over decades following fire, but more frequent and severe fires, combustion of below-ground carbon, and long-term impacts of fire on ground thaw from combustion of vegetation and organic soils are resulting in net carbon emissions to the atmosphere over large spatial scales.
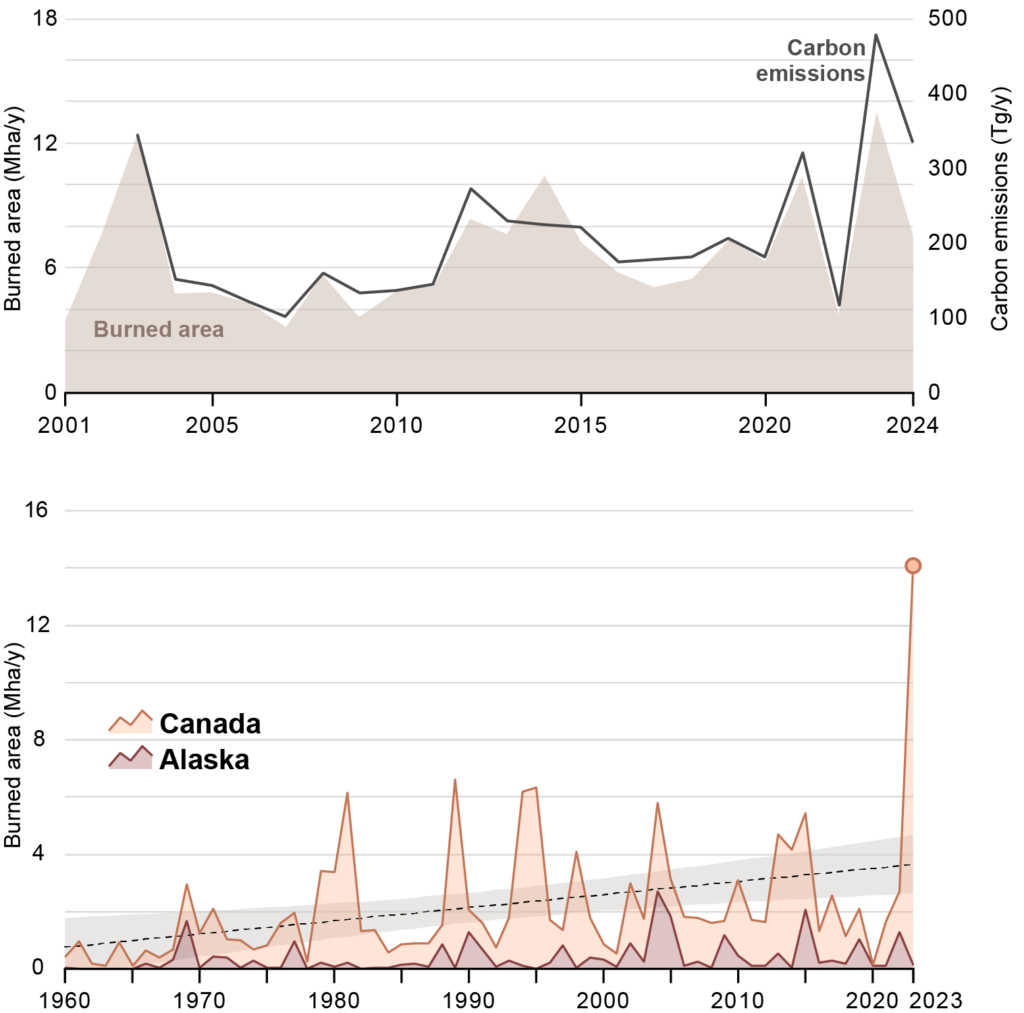
Given the high interannual variability in permafrost-region fires, it is not possible to detect trends across the entire Arctic (Fig. 1) over the previous two decades alone, which is when robust satellite-based fire products are available (Fig. 4, top panel). During this period, the largest carbon emissions from fire occurred in 2003 (343 Tg C) and 2023 (478 Tg C) due to large fires in southern Siberia and Canada, respectively. Fires in Canada’s permafrost region in 2023 burned more than twice the area of any previous year on record and emitted 381 Tg C. Over a longer multi-decadal time frame, Alaskan and Canadian permafrost regions have experienced a clear upward trend in burned area since the mid-20th century (Fig. 4, bottom panel); burned area over the last 20 years (2004-23) is 28% higher than the 1981-2000 average and 62% higher than the 1971-90 average. Fire emissions have also been increasing at higher rates north of the Arctic Circle compared to permafrost regions below the Arctic Circle. North of the Arctic Circle the three years with the largest fire emissions during the last 20 years are 2019 (39.2 Tg C), 2024 (42.3 Tg C), and 2020 (60.5 Tg C). Across the entire pan-Arctic permafrost region, 2024 was a moderately high fire year, with 7.5 Mha burned and 335 Tg C emitted (Scholten et al. 2024; Copernicus Atmosphere Monitoring Service 2022).
Regional carbon cycling trends
Across the Arctic region (Fig. 1), warmer temperatures over the past two decades (see essay Surface Air Temperature) were associated with more CO2 uptake during the growing season (Virkkala et al. 2024a, 2024b), but CO2 emitted from microbial respiration during the non-growing season offset growing season uptake (See et al. 2024; Virkkala et al. 2024a, 2024b). The pan-Arctic region was CO2 neutral during 2001-20 (budget: -24 ± 123 Tg C/yr; Virkkala et al. 2024a, 2024b) when considering net ecosystem exchange (i.e., plant CO2 uptake through photosynthesis and plant and microbial CO2 release through respiration) and fire. However, the tundra region has shifted from a CO2 sink—which it has been for millenia—to a small CO2 source, while the boreal region remains a CO2 sink (Hugelius et al. 2024; Ramage et al. 2024; Virkkala et al. 2024a; Fig. 5). The permafrost region is a CH4 source, releasing 15 to 39 Tg CH4-C/yr during 2000-20 (Hugelius et al. 2024).
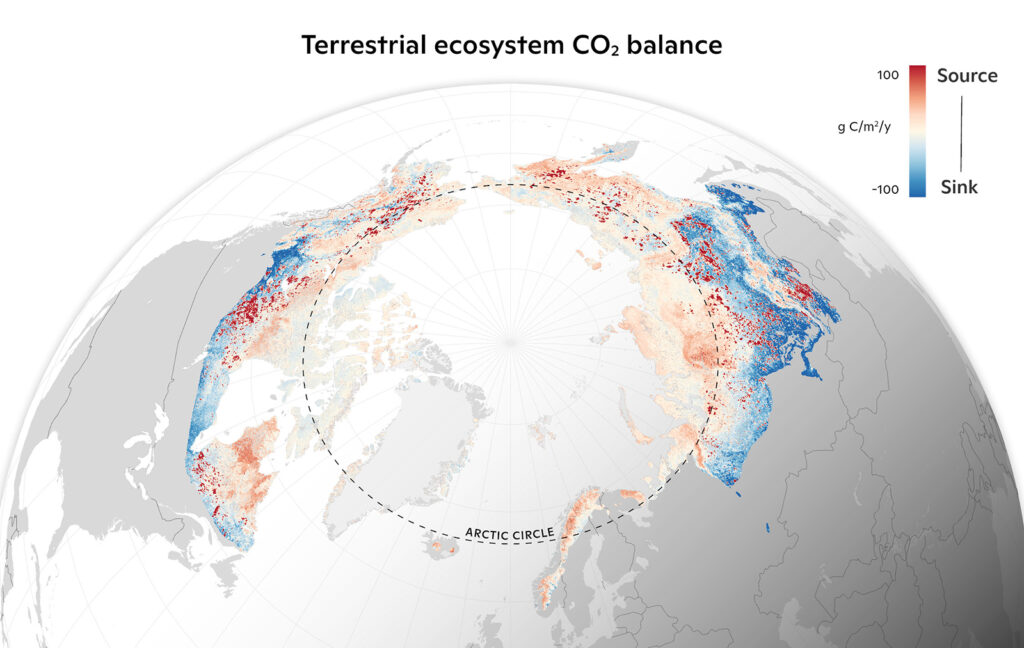
Methods and data
Site-level carbon fluxes were measured using the eddy covariance technique and gap-filled using Marginal Distribution Sampling or Random Forest methods (e.g., Euskirchen et al. 2024). Data were acquired through 31 August 2024 from public databases and site principal investigators (Lundin et al. 2024; NEON 2024). The shading in Fig. 3 denotes the 2.5%, 50%, and 97.5% quantiles of previous years’ data and were generated using a generalized additive model. The long-term (6-17 year) mean fluxes were calculated using a linear mixed effect regression model with land cover as the fixed effect and site as the random intercept.
Burned area data from 2001-24 were taken from the MODIS-based MCD64A1 product (Giglio et al. 2018), and fire carbon emissions from 2003-24 were derived from the Copernicus Atmosphere Monitoring Service (2022). Due to lags in data latency, we used burned area information from the VIIRS active fire-based product (Scholten et al. 2024) for the months of August, September, and October in 2024. Data for 2024 were updated as of 15 October 2024 for both fire emissions and burned area. We also provide information on longer-term patterns in burned area in North America’s permafrost region using the Canadian National Fire Database (Stocks et al. 2002; Canadian Forest Service 2021) and the Alaska Large Fire Database (Kasischke et al. 2002; Alaska Interagency Coordination Center 2024). Note these data sources are less reliable during the earlier decades.
References
Alaska Interagency Coordination Center, Wildland Fire Predictive Services Maps. Alaska Fire Service Bureau of Land Management, accessed 22 October 2024, https://fire.ak.blm.gov/predsvcs/maps.php.
Brown, J., O. Ferrians, J. A. Heginbottom, and E. Melnikov, 2002: Circum-Arctic Map of Permafrost and Ground-Ice Conditions, Version 2. NASA National Snow and Ice Data Center Distributed Active Archive Center, Boulder, CO, USA, accessed 20 January 2017, https://doi.org/10.7265/skbg-kf16.
Canadian Forest Service, 2021: Canadian National Fire Database. Natural Resources Canada, Canadian Forest Service, Northern Forestry Centre, accessed 22 October 2024, https://cwfis.cfs.nrcan.gc.ca/ha/nfdb.
Copernicus Atmosphere Monitoring Service, 2022: CAMS global biomass burning emissions based on fire radiative power (GFAS). Atmosphere Data Store, accessed 22 October 2024, https://ads.atmosphere.copernicus.eu/datasets/cams-global-fire-emissions-gfas?tab=overview.
Euskirchen, E. S., and Coauthors, 2024: Persistent net release of carbon dioxide and methane from an Alaskan lowland boreal peatland complex. Glob. Change Biol., 30(1), e17139, https://doi.org/10.1111/gcb.17139.
Giglio, L., L. Boschetti, D. P. Roy, M. L. Humber, and C. O. Justice, 2018: The Collection 6 MODIS burned area mapping algorithm and product. Remote Sens. Environ., 217, 72-85, https://doi.org/10.1016/j.rse.2018.08.005.
Hugelius, G., and Coauthors, 2014: Estimated stocks of circumpolar permafrost carbon with quantified uncertainty ranges and identified data gaps. Biogeosciences, 11, 6573-6593, https://doi.org/10.5194/bg-11-6573-2014.
Hugelius, G. and Coauthors, 2024: Permafrost region greenhouse gas budgets suggest a weak CO2 sink and CH4 and N2O sources, but magnitudes differ between top-down and bottom-up methods. Global Biogeochem. Cy., 38(10), e2023GB007969, https://doi.org/10.1029/2023GB007969.
Kasischke, E. S., D. Williams, and D. Barry, 2002: Analysis of the patterns of large fires in the boreal forest region of Alaska. Int. J. Wildland Fire, 11(2), 131-144, https://doi.org/10.1071/WF02023.
Lundin, E., P. Crill, H. Grudd, J. Holst, A. Kristoffersson, A. Meire, M. Mölder, and N. Rakos, 2024: ETC L2 Fluxes, Abisko-Stordalen Palsa Bog, 2021-12-31-2024-08-31. ICOS RI, https://hdl.handle.net/11676/pPnlUbSqmjVMEf0SjkOpoUCX.
NEON (National Ecological Observatory Network), 2024: Bundled data products – eddy covariance (DP4.00200.001), provisional data, accessed 12 September 2024, https://data.neonscience.org/data-products/DP4.00200.001.
Ramage, J., and Coauthors, 2024: The net GHG balance and budget of the permafrost region (2000-2020) from ecosystem flux upscaling. Global Biogeochem. Cy., 38(4), e2023GB007953, https://doi.org/10.1029/2023GB007953.
Scholten, R. C., S. Veraverbeke, Y. Chen, and J. T. Randerson, 2024: Spatial variability in Arctic-boreal fire regimes influenced by environmental and human factors. Nat. Geosci., 17, 866-873, https://doi.org/10.1038/s41561-024-01505-2.
Schuur, E. A. G., and Coauthors, 2021: Tundra underlain by thawing permafrost persistently emits carbon to the atmosphere over 15 years of measurements. J. Geophys. Res.:-Biogeo., 126(6), e2020JG006044, https://doi.org/10.1029/2020JG006044.
Schuur, E. A. G., and Coauthors, 2022: Permafrost and climate change: Carbon cycle feedbacks from the warming Arctic. Annu. Rev. Env. Resour., 47, 343-371, https://doi.org/10.1146/annurev-environ-012220-011847.
See, C. R., and Coauthors, 2024: Decadal increases in carbon uptake offset by respiratory losses across northern permafrost ecosystems. Nat. Climate Change, 14, 853-862, https://doi.org/10.1038/s41558-024-02057-4.
Smith, S. L., V. E. Romanovsky, K. Isaksen, K. E. Nyland, N. I. Shiklomanov, D. A. Streletskiy, and H. H. Christiansen, 2024: Permafrost. State of the Climate in 2023. Bull. Amer. Meteor. Soc., 105(8), S314-S317, https://doi.org/10.1175/BAMS-D-24-0101.1.
Stocks, B. J., and Coauthors, 2002: Large forest fires in Canada, 1959-1997. J. Geophys. Res.-Atmos., 107, 8149, https://doi.org/10.1029/2001JD000484.
Virkkala, A. -M., and Coauthors, 2024a: An increasing Arctic-boreal CO2 sink offset by wildfires and source regions. bioRxiv, https://doi.org/10.1101/2024.02.09.579581.
Virkkala, A. -M., B. M. Rogers, J. D. Watts, K. Arndt, S. Potter, I. Wargowsky, and S. Natali, 2024b: Machine learning-based Arctic-boreal terrestrial ecosystem CO2 fluxes, 2001-2020. ORNL DAAC, Oak Ridge, TN, USA, https://doi.org/10.3334/ORNLDAAC/2377.
January 8, 2025

