
C. Derksen1, R. Brown1, L. Mudryk1, K. Luojus2, S. Helfrich3
1Climate Research Division, Environment and Climate Change Canada, Canada
2Arctic Research Centre, Finnish Meteorological Institute, Finland
3NOAA/NESDIS Center for Satellite Applications and Research, USA
Highlights
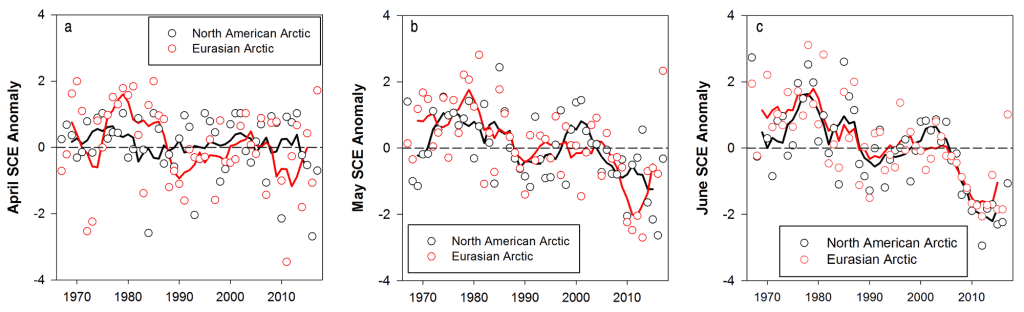
- Spring snow cover extent (SCE) over Eurasia was above average in 2017, including the 2nd highest May SCE for Eurasia over the period of satellite observations (which date back to 1967). Consistent with below normal surface air temperatures in May and June, these are the first positive SCE anomalies observed in May over the Eurasian Arctic since 2005. June SCE anomalies were positive across the Eurasian Arctic for the first time since 2004.
- Greater than average April snow water equivalent (SWE) was present across Eurasia, a precursor to the above average snow extent later in the spring.
- SCE anomalies were once again below average (1981-2010 reference period) across the North American Arctic (11th time out of the past 12 years for May; 12th consecutive June) driven by earlier snow melt across the Canadian Arctic.
Satellite-derived estimates of SCE over Arctic land areas date back to 1967, and have shown dramatic reductions since 2005. This loss of spring snow over Arctic land areas is important because it influences the surface energy budget (snow is highly reflective of incoming solar energy), ground thermal regime (snow is a highly effective insulator of the underlying soil), and hydrological processes (the snowpack stores water in solid form for many months before spring melt). Current and projected changes in snow cover also generate a cascade of interactions and feedbacks that affect vegetation, biogeochemical activity, exchanges of carbon dioxide and trace gases, and ecosystem services (Brown et al., 2017). The spring (April, May, June) period is particularly important because the entire Arctic land area is snow covered during winter, so conditions during the melt season have a major impact on variability and trends in Arctic snow cover.
SCE anomalies (relative to the 1981-2010 reference period) for the Arctic (land areas north of 60N) in spring (April, May, June) 2017 were computed separately for the North American and Eurasian sectors of the Arctic. Anomalies were derived from the NOAA snow chart climate data record, which extends from 1967 to present (maintained at Rutgers University; Estilow et al., 2015; http://climate.rutgers.edu/snowcover/; Fig. 1a-c). For the first time in over a decade, Eurasian Arctic spring snow cover in 2017 was above average. April and May SCE anomalies were positive, including the 2nd highest May SCE in the period of satellite observations. These are the first positive SCE anomalies observed in May over the Eurasian Arctic since 2005, while June SCE anomalies were positive across the Eurasian Arctic for the first time since 2004. SCE anomalies over the North American Arctic were negative all spring, but did not approach the series of record-breaking low SCE values observed in recent years.
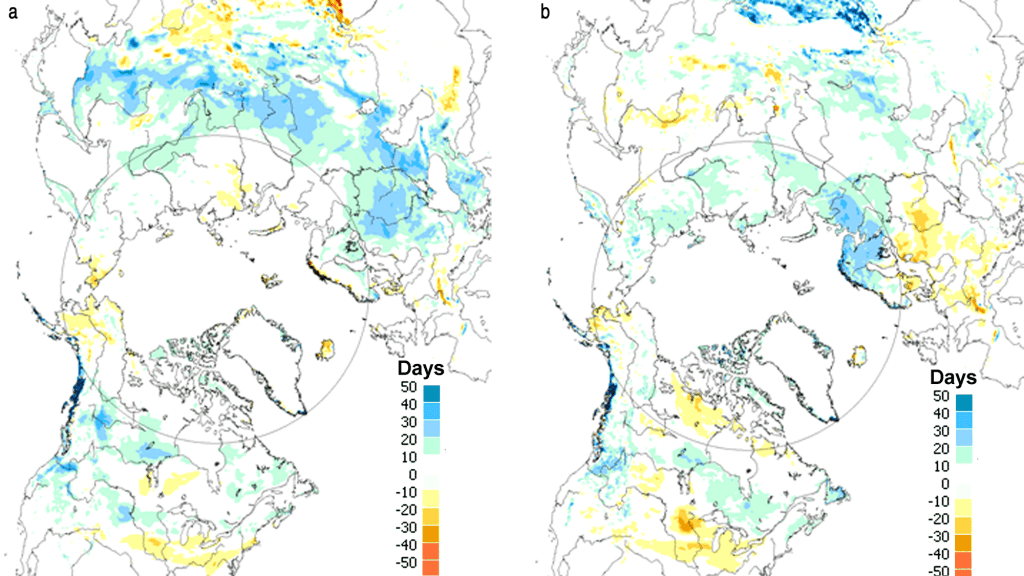
Snow cover duration (SCD) departures, relative to a 1998-2010 reference period (used due to dataset availability) (Fig. 2) were derived from the NOAA daily Interactive Multisensor Snow and Ice Mapping System (IMS) snow cover product (Helfrich et al., 2007). While there was evidence of earlier snow cover onset over much of mid-latitude Eurasia (consistent with cold surface air temperature anomalies, see Fig. 1.2a in essay on Surface Air Temperature), the timing of snow onset over Arctic land areas (with the exception of parts of Alaska) was near normal. Later than normal snow melt onset across Eurasia (also reflected in the positive SCE anomalies in Fig. 1) was consistent with colder than normal surface air temperatures across this region (especially in May and June; see Fig. 1.2c in essay on Surface Air Temperature). In the North American Arctic, spring snow melt in the Canadian Arctic was slightly earlier than normal, coincident with warmer than average surface air temperatures in May and June (see Fig. 1.2c in essay on Surface Air Temperature).
Snow depth anomalies (Fig. 3) were derived from the Canadian Meteorological Centre (CMC) daily gridded global snow depth analysis, which combines surface observations with a simple snow model driven by temperature and precipitation forcing (Brasnett, 1999). In March and April, negative anomalies (i.e. relatively low snow depth) were observed across the subarctic, with mainly positive anomalies over the high latitude regions of Siberia and North America. Snow depth over the two continental sectors of the Arctic diverged by June; the Eurasian Arctic was characterized by extensive positive snow depth anomalies, while the North American Arctic was dominated by negative snow depth anomalies (which correspond to the region of shorter spring snow cover duration in Fig. 2b).
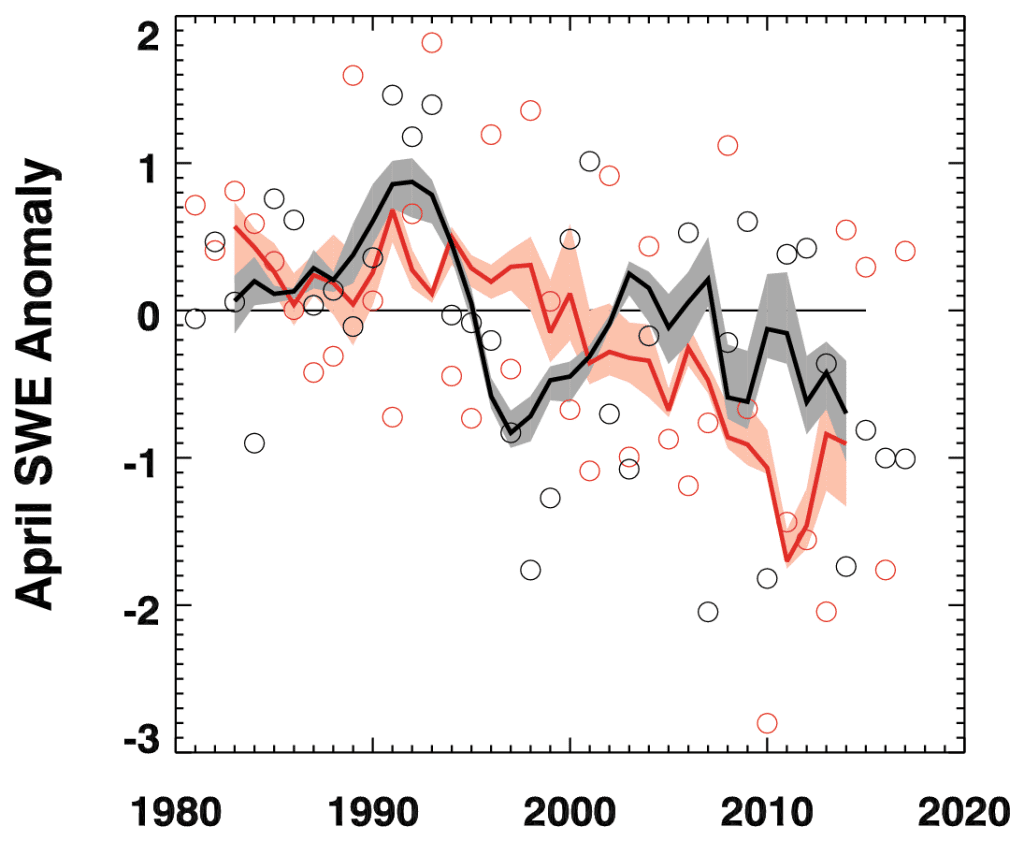
Four products were utilized to generate a multi-dataset snow water equivalent (SWE; the amount of water stored in solid form as snow) anomaly time series (1980-2017) for April (typically the month of maximum SWE across the Arctic; Fig. 4). While compromising on time series length, the use of a multiple data sets tends to reduce uncertainty in the derived trends (for instance, see Brown and Derksen, 2013 and Mudryk et al., 2017 for issues related to the NOAA-CDR). The datasets used to derive the SWE time series included modern atmospheric reanalysis (The Modern-Era Retrospective Analysis for Research and Applications version 2; MERRA-2; Reichle et al., 2017), reconstructed snow cover driven by ERA-interim meteorology using the temperature-index model described by Brown et al. (2003), the physical snowpack model Crocus (Brun et al., 2013), and the European Space Agency GlobSnow product derived using a combination of satellite passive microwave data and climate station observations (Takala et al., 2011). While there is a high degree of interannual variability in the multi-dataset SWE anomaly time series (calculated using the same 1981-2010 reference as Fig. 1), the anomalies have been predominantly negative since 2000. This was again the case for the North American Arctic in 2017. In contrast, Eurasian SWE anomalies were positive, which indicates a deeper than average snowpack was a precursor to the above average snow extent that followed later in the spring.
Even in the presence of a long term negative trend in Arctic spring SCE (driven by warming temperature trends), negative SCE anomalies are not expected in every season (nor in all regions) due to natural variability in the atmospheric circulation patterns which drive regional temperature and precipitation anomalies. The rebound in Eurasian SCE during May and June of 2017 was consistent with winter and spring season circulation patterns that generally favored lower surface air temperatures, enhanced precipitation, and above-average snow accumulation across northern Eurasia (see essay on Surface Air Temperature).
References
Brasnett, B., 1999: A global analysis of snow depth for numerical weather prediction, J. Appl. Meteorol., 38, 726-740.
Brown, R., B. Brasnett, and D. Robinson, 2003: Gridded North American monthly snow depth and snow water equivalent for GCM evaluation, Atmos.-Ocean., 41, 1-14.
Brown, R., and C. Derksen. 2013. Is Eurasian October snow cover extent increasing? Environ. Res. Lett., 8: 024006 doi: 10.1088/1748-9326/8/2/024006.
Brown, R., D. Vikhamar Schuler, O. Bulygina, C. Derksen, K. Luojus, L. Mudryk, L. Wang, and D. Yang, 2017: Arctic terrestrial snow cover, Chapter 3 in: Snow, Water, Ice and Permafrost in the Arctic (SWIPA) 2017 Assessment, Arctic Monitoring and Assessment Programme, Oslo, Norway.
Brun, E., V. Vionnet, A. Boone, B. Decharme, Y. Peings, R. Valette, F. Karbou, and S. Morin, 2013: Simulation of Northern Eurasian local snow depth, mass, and density using a detailed snowpack model and meteorological reanalyses, J. Hydrometeorol., 14, 203-219, DOI: 10.1175/JHM-D-12-012.1.
Estilow, T. W., A. H. Young, and D. A. Robinson, 2015: A long-term Northern Hemisphere snow cover extent data record for climate studies and monitoring, Earth Sys. Sci. Data, 7.1, 137-142.
Helfrich, S., D. McNamara, B. Ramsay, T. Baldwin, and T. Kasheta, 2007: Enhancements to, and forthcoming developments in the Interactive Multisensor Snow and Ice Mapping System (IMS), Hydrol. Process., 21, 1576-1586.
Mudryk, L., P. Kushner, C. Derksen, and C. Thackeray, 2017: Snow cover response to temperature in observational and climate model ensembles, Geophys. Res. Lett., 44, DOI: 10.1002/2016GL071789.
Reichle, R., C. Draper, Q. Liu, M. Girotto, S. Mahanama, R. Koster, and G. De Lannoy, 2017: Assessment of MERRA-2 land surface hydrology estimates, J. Clim., 30, DOI: 10.1175/JCLI-D-16-0720.1.
Takala, M., K. Luojus, J. Pulliainen, C. Derksen, J. Lemmetyinen, J. -P. Kärnä, and J. Koskinen, 2011: Estimating northern hemisphere snow water equivalent for climate research through assimilation of space-borne radiometer data and ground-based measurements, Remote Sens. Environ., 115, 3517-3529.
November 20, 2017