
H. Epstein1, U. Bhatt2, M. Raynolds3, D. Walker3, B. C. Forbes4, T. Horstkotte5, M. Macias-Fauria6, A. Martin7, G. Phoenix8, J. Bjerke9, H. Tømmervik9, P. Fauchald9, H. Vickers10, R. Myneni11, C. Dickerson1
1Department of Environmental Sciences, University of Virginia, Charlottesville, VA, USA
2Geophysical Institute, University of Alaska Fairbanks, Fairbanks, AK, USA
3Institute of Arctic Biology, University of Alaska Fairbanks, Fairbanks, AK, USA
4Arctic Centre, University of Lapland, Rovaniemi, Finland
5Department of Ecology and Environmental Sciences, Umeå University, Umeå, Sweden
6School of Geography and the Environment, Oxford University, Oxford, UK
7Department of Zoology, Oxford University, Oxford, UK
8Department of Animal and Plant Sciences, University of Sheffield, Sheffield, UK
9Norwegian Institute for Nature Research, Tromsø, Norway
10Norut Northern Research Institute, Tromsø, Norway
11Department of Earth and Environment, Boston University, Boston, MA, USA
Highlights
- Tundra greenness has increased substantially throughout the Arctic over the past two years (2015-2016), following 3-4 years of continuous declines.
- Peak tundra greenness for 2016 ranks 4th (entire Arctic), 9th (Eurasian Arctic), and 3rd (North American Arctic) in the context of the 35-year record.
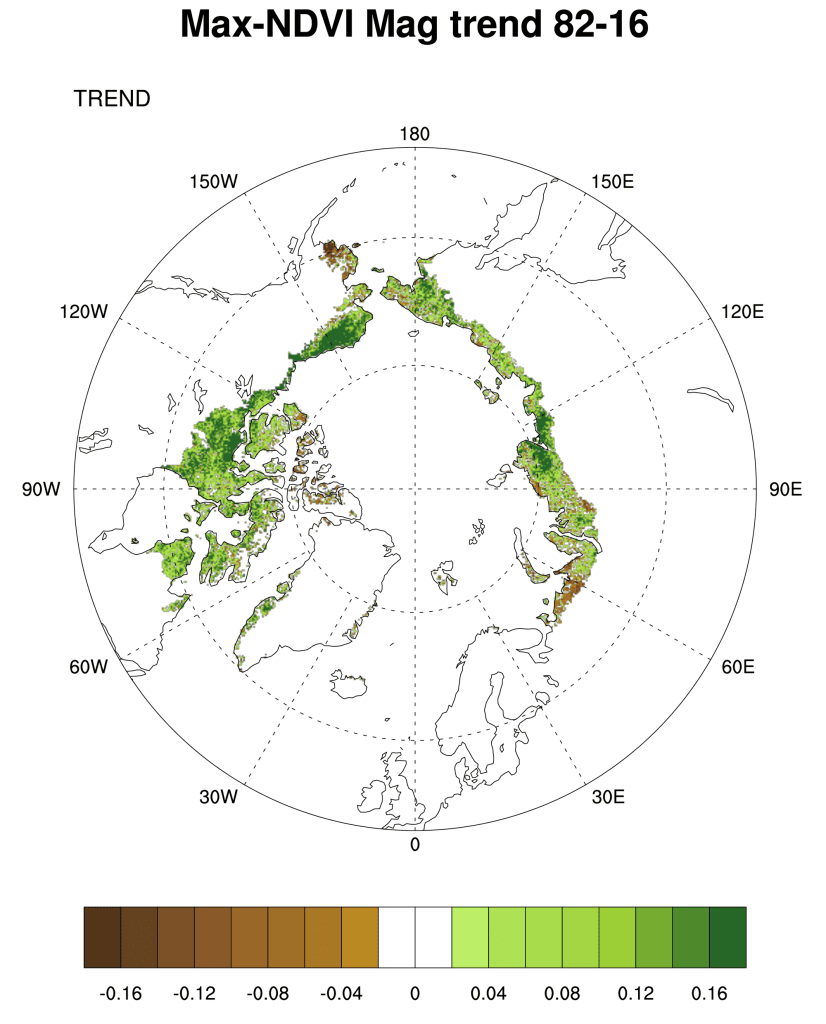
- Long-term trends (1982-2016) show greening on the North Slope of Alaska, the southern Canadian tundra, and in the central Siberian tundra; tundra browning is found in western Alaska (Yukon-Kuskokwim Delta), the higher-Arctic Canadian Archipelago, and western Siberian tundra.
Vegetation in the Arctic tundra has been responding to environmental changes over the course of the last several decades, with the tendency being an increase in the quantity of above-ground vegetation (i.e., “greening”). These vegetation changes vary spatially throughout the circumpolar Arctic in both direction and magnitude, and they are not always consistent over time. This suggests complex interactions among atmosphere, ground (soils and permafrost), vegetation, and herbivore components of the Arctic system. Changes in tundra vegetation can have important effects on permafrost, hydrological dynamics, carbon and nutrient cycling, and the surface energy balance (e.g., Frost et al., 2017; Kępski et al., 2017), as well as the diversity, abundance, and distribution of both wild and domesticated herbivores in the Arctic (e.g., Fauchald et al., 2017; Horstkotte et al., 2017). We continue to evaluate the state of the circumpolar Arctic vegetation, to improve our understanding of these complex interactions and their impacts on the Arctic system and beyond.
Using Earth-Observing Satellites (EOS) with daily return intervals, Arctic tundra vegetation has been continuously monitored since 1982. We report on data from the Global Inventory Modeling and Mapping Studies (GIMMS) version 3g dataset (GIMMS, 2013) based largely on the Advanced Very High Resolution Radiometer (AVHRR) sensors onboard NOAA satellites (Pinzon and Tucker, 2014). At the time of the writing of this report, the GIMMS3g dataset was only available through 2016. The GIMMS product (at ~12-km resolution for this report) is a bi-weekly, maximum-value composited dataset of the Normalized Difference Vegetation Index (NDVI). NDVI is highly correlated with aboveground vegetation (e.g., Raynolds et al., 2012), or “greenness,” within the Arctic tundra. We use two metrics based on the NDVI: MaxNDVI and TI-NDVI. Max NDVI is the peak NDVI for the year (growing season), and is related to yearly maximum aboveground vegetation biomass. TI (time-integrated) NDVI is the sum of the bi-weekly NDVI values for the growing season, and is correlated with the total aboveground vegetation productivity.
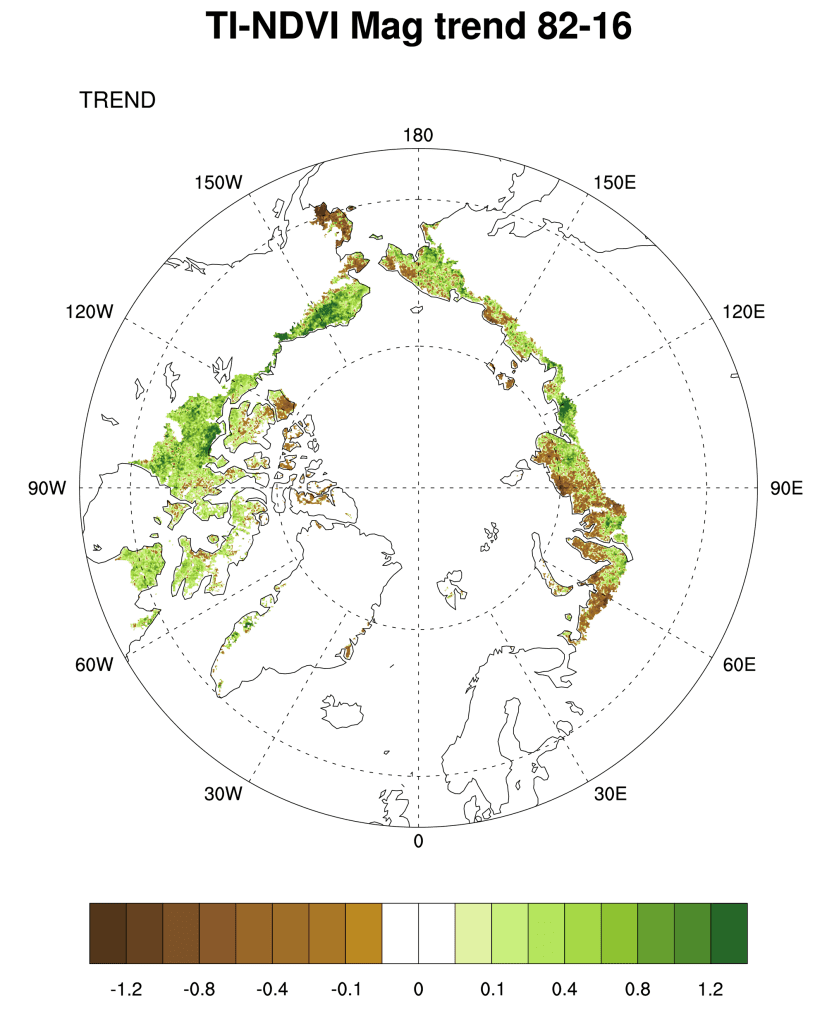
Examining the overall trend in tundra greenness for the now 35-year record (1982-2016), it is apparent that the MaxNDVI has increased throughout a majority of the geographic circumpolar Arctic tundra (Fig. 1 a). Widespread increase is also true, though to a lesser extent, for TI-NDVI (Fig. 1b). Regions with some of the greatest increases in tundra greenness are the North Slope of Alaska, the Low Arctic (southern tundra subzones) of the Canadian tundra, and east of the Taimyr Peninsula in north-central Siberia, Russia. However, tundra greenness has declined (i.e., “browning”) on the Yukon-Kuskokwim Delta of western Alaska, the High Arctic of the Canadian Archipelago, and the north-western Siberian tundra. Whereas the regions of browning (NDVI decrease) tend to be collocated between MaxNDVI and TI-NDVI, the decrease in TI-NDVI covers a greater areal extent than that of MaxNDVI. A particular region of note includes the Yamal, Gydan, and Taimyr peninsulas in north-western Siberia, which generally show increases in MaxNDVI, yet decreases in TI-NDVI over the course of the record.
Following 3-4 years of successive declines prior to and including 2014, the NDVI for Arctic tundra exhibited an upturn in 2015 (Fig. 2). The one exception was the TI-NDVI for North America, which continued to decrease in 2015. The NDVI then increased from 2015 to 2016 for both indices and both continents, with the past two years exhibiting substantial recovery from the prior years of “browning.” MaxNDVI and TI-NDVI for the entire Arctic increased 3.2% and 5.3%, respectively, between 2015 and 2016. Much of this can be attributed to enhanced NDVI in North America with increases of 6.5% and 9.2%, respectively, for MaxNDVI and TI-NDVI. This is the first annual increase in TI-NDVI for North America since 2010.
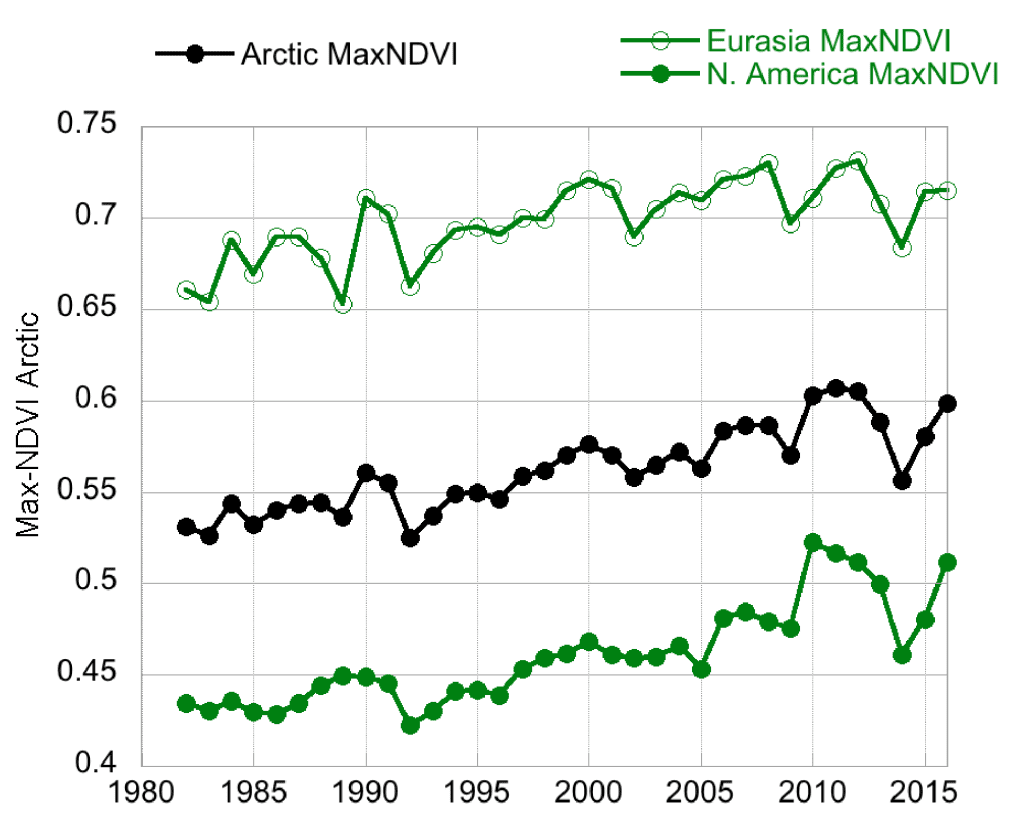
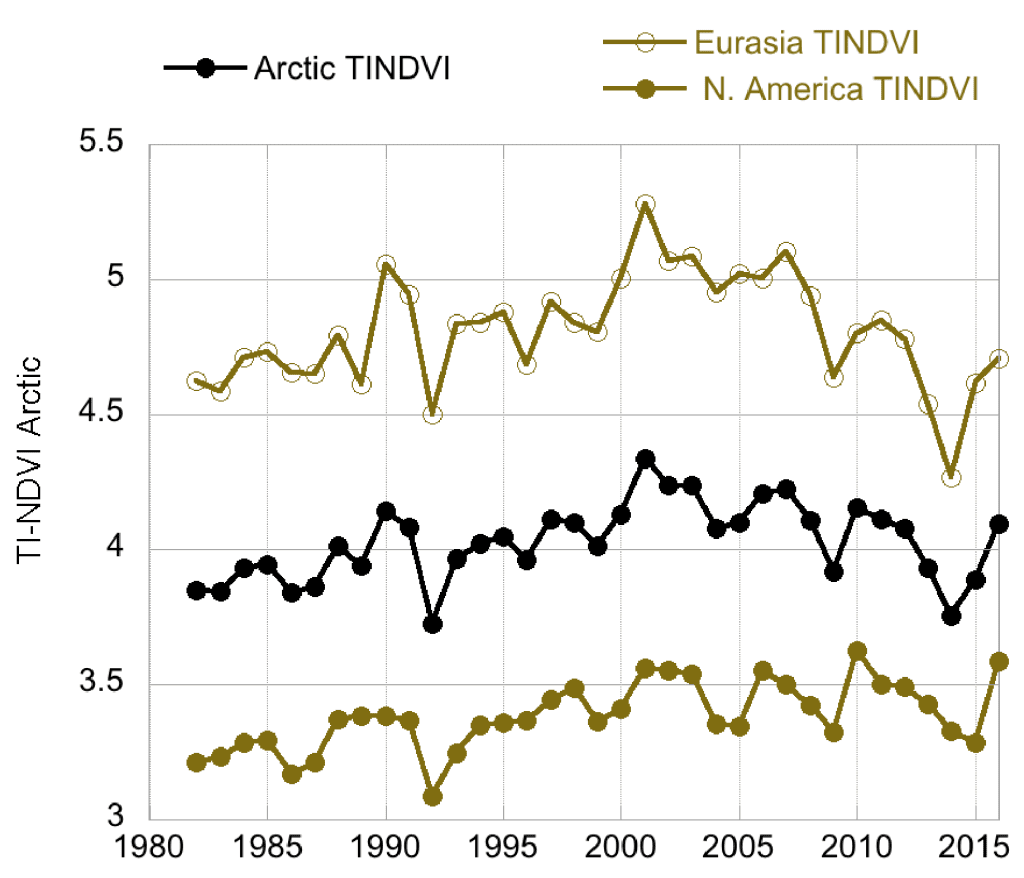
All NDVI values for 2016 were greater than their respective mean values for the 35-year record, with the exception of TI-NDVI for Eurasia. MaxNDVI values ranked 4th, 9th, and 3rd greatest for the Arctic, Eurasian Arctic, and North American Arctic, respectively. TI-NDVI values ranked 14th, 24th, and 2nd for the Arctic, Eurasian Arctic, and North American Arctic, respectively, indicating a large discrepancy in the dynamics of TI-NDVI between the Eurasian and North American continents. Based on remotely-sensed Land Surface Temperatures (LST), from the same sensors as those providing the NDVI values, the Summer Warmth Index (SWI – sum of mean monthly temperatures > 0° C) for the Arctic as a whole and for the Eurasian Arctic was greater in 2016 than in any other year of the satellite record (since 1982). For the North American Arctic, the 2016 SWI was the 2nd greatest on record.
The reported controls on tundra greening are numerous and varied, and include increases in summer, spring, and winter temperatures, as well as growing season length (Bhatt et al., 2017; Fauchald et al., 2017; Horstkotte et al., 2017; Myers-Smith and Hik, 2017; Vickers et al., 2017), in part controlled by reductions in Arctic Ocean sea-ice cover (Bhatt et al., 2017; Macias-Fauria et al., 2017). Other controls on tundra greening include increases in snow water equivalent and soil moisture, increases in active layer depth, changes in the patterns of herbivore activity, and even a reduction in the human use of the land (Fauchald et al., 2017; Horstkotte et al., 2017; Martin et al., 2017; Westergaard-Nielsen et al., 2017).
Even though the past two years have seen large increases in tundra NDVI, there are still regions of the Arctic that have experienced “browning” (i.e., decreases in tundra NDVI) over the length of the satellite record, and there have been substantive time periods of tundra browning, even within a general greening trend. While research on tundra browning is still relatively sparse, there has recently been greater attention given to this phenomenon. Bjerke et al. (2017) report on extensive vegetation dieback in northern Norway (including Svalbard) in 2014 and 2015, and attributed this largely to changes in winter climate–specifically, reductions in snow cover due to winter warming events leave the ground exposed to subsequent freezing and desiccation (Vikhamar-Schuler et al., 2016); insect outbreaks contributed secondarily to vegetation mortality.
References
Bhatt, U., D. Walker, R. Raynolds, P. Bieniek, H. Epstein, J. Comiso, C. Tucker, M. Steele, W. Ermold, and J. Zhang, 2017: Changing seasonality of Panarctic tundra vegetation in relationship to climatic variables. Environ. Res. Lett., 12, 055003.
Bjerke, J. W., R. Treharne, D. Vikhamar-Schuler, S. R. Karlsen, V. Ravolainen, S. Bokhorst, G. K. Phoenix, Z. Bochenek, and H. Tømmervik, 2017: Understanding the drivers of extensive plant damage in boreal and Arctic ecosystems: Insights from field surveys in the aftermath of damage. Sci. Tot. Environ., doi: 10.1016/j.scitotenv.2017.05.050.
Fauchald, P., T. Park, H. Tømmervik, R. Myneni, and V. Helene Hauser, 2017: Arctic greening from warming promotes declines in caribou populations. Sci. Adv., 3, e1601365.
Frost, G. V., H. E. Epstein, D. A. Walker, G. Matyshak, and K. Ermokhina, 2017: Seasonal and long-term changes in active-layer temperatures after tall shrubland expansion and succession in Arctic tundra. Ecosystems, 16, 1296.
Global Inventory Modeling and Mapping Studies (GIMMS), 2013: Available online: http://gcmd.nasa.gov/records/GCMD_GLCF_GIMMS.html.
Horstkotte, T., T. Utsi, Å. Larsson-Blind, P. Burgess, B. Johansen, J. Käyhkö, L. Oksanen, and B. C. Forbes, 2017: Human-animal agency in reindeer management: herders’ perspectives on vegetation dynamics under climate change. Ecosphere, 8(9), e01931, doi: 10.1002/ecs2.1931.
Kępski, D., B. Luks, K. Migala, T. Wawrzyniak, S. Westermann, and B. Wojtuń, 2017: Terrestrial remote sensing of snowmelt in a diverse High-Arctic tundra environment using time-lapse imagery. Remote Sens., 9, 733.
Macias-Fauria, M., S. R. Karlsen, and B. C. Forbes, 2017: Disentangling the coupling between sea ice and tundra productivity in Svalbard. Sci. Reports, 7, 8586.
Martin, A. C., E. S. Jeffers, G. Petrokofsky, I. Myers-Smith, and M. Macias-Fauria, 2017: Shrub growth and expansion in the Arctic tundra: an assessment of controlling factors using an evidence-based approach. Environ. Res. Lett., 12, 085007.
Myers-Smith, I. H., and D. S. Hik, 2017: Climate warming as a driver of tundra shrubline advance. J. Ecol., doi: 10.1111/1365-2745.12817.
Pinzon, J., and C. Tucker, 2014: A non-stationary 1981-2014 AVHRR NDVI3g time series. Remote Sens., 6, 6929-6960, doi: 10.3390/rs6086929.
Raynolds, M. K., D. A. Walker, H. E. Epstein, J. E. Pinzon, and C. J. Tucker, 2012: A new estimate of tundra-biome phytomass from trans-Arctic field data and AVHRR NDVI. Remote Sens. Lett., 3, 403-411.
Vickers, H., K. A. Høgda, S. Solbø, S. R. Karlsen, H. Tømmervik, R. Aanes, and B. Hansen, 2016: Change in greening in the high Arctic: insights from a 30 year AVHRR max NDVI dataset for Svalbard. Environ. Res. Lett., 11, 105004.
Vikhamar-Schuler, D., K. Isaksen, J. E. Haugen, H. Tømmervik, B. Luks, T. Vikhamar Schuler, and J. W. Bjerke, 2016: Change in winter warming events in the Nordic Arctic Region. J. Clim., doi: 10.1175/JCLI-D-15-0763.1.
Westergaard-Nielsen, A., M. Lund, S. H. Pedersen, N. M. Schmidt, S. Klosterman, J. Abermann, and B. U. Hansen, 2017: Transitions in high-Arctic vegetation growth patterns and ecosystem productivity tracked with automated cameras from 2000 to 2013. Ambio, 46, S39-S52.
November 17, 2017