
Arctic Report Card 2016 Addendum: October-November 2016
The tight publication schedule of the Arctic Report Card, which includes a peer-review of its content, means the updated observations extend through September of the reporting year. Since some Arctic conditions in Fall 2016 are exceptional, we’ve added this update to extend the scope through November for those ‘Vital Signs’ essays where data are available: surface air temperature, surface ocean temperature, sea ice, terrestrial snow cover, and Greenland ice sheet.
Note: This addendum has not been peer-reviewed.
Summary
It is apparent that the record-breaking delay in the freeze up of the sea ice cover in Fall 2016 is associated with unprecedented warm air and ocean surface temperatures. Further, the pattern of snow extent anomalies over land in Fall 2016 is strongly related to the pattern of surface air temperatures.
While October and November established new record lows for Arctic sea ice extent, the exceptionally warm temperature anomalies, which delayed the onset of ice formation, did not extend over Arctic and subarctic land areas. Instead, colder than normal surface temperatures, particularly over Eurasia, allowed terrestrial snow cover extent to be greater than normal. Though relatively warm, surface temperatures over the Greenland ice sheet remained below the melting point and no surface melting was detected during the fall season. Differences in Arctic and subarctic/mid-latitude surface temperature anomalies observing in Fall 2016 were driven by a large scale atmospheric wind pattern that was unusual but not unexpected.
Surface Air Temperature (prepared by J. Overland, NOAA)
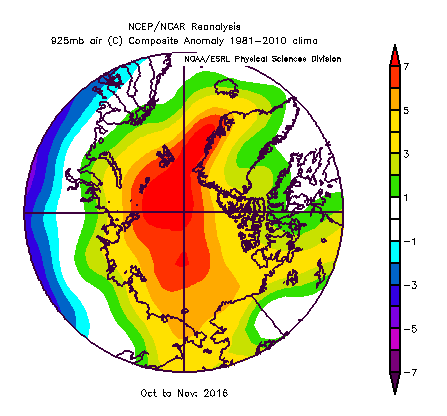
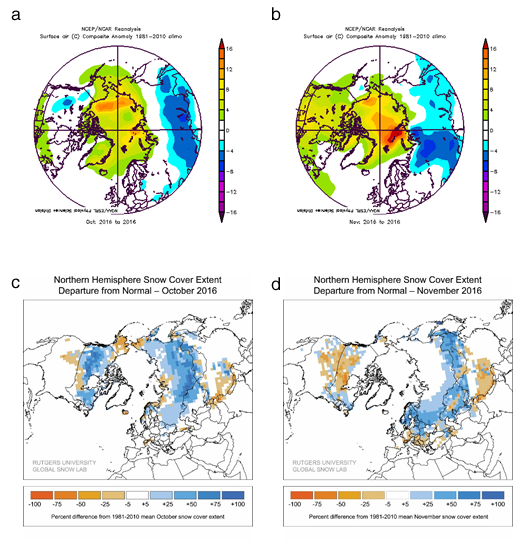
The average October-November 2016 air temperature in the lower atmosphere in the central Arctic was 6° C (11° F) above the 1981-2010 climate average, with the highest values spreading into Northwestern Canada. (Fig. A1). Daily weather records were exceeded all over the Arctic especially near the Kara Sea, Svalbard, and northern Canada, which were up to 14° C (25° F) higher than normal. It is worth noting that the October-November composite temperature anomaly map, shown is Fig. A1, features a pattern that persisted over these months.
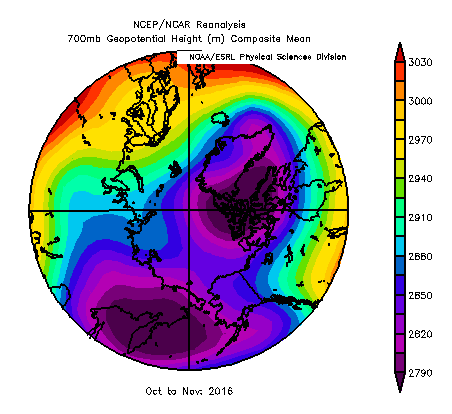
The immediate cause of the warm Fall 2016 Arctic temperatures were winds bringing in warmer temperatures from mid-latitudes, similar to conditions discussed for the warm temperature extremes from Winter 2016. In Fall 2016 there were deep low pressure systems in the western Bering Sea, as part of the Aleutian low, and from west of Iceland extending into northern Baffin Bay (Fig. A2). On the east side of these pressure centers strong winds brought warm conditions up through Bering Strait and across the northern North Atlantic and on to the vicinity of the North Pole.
Conditions in Fall 2016 are similar to conditions in Winter 2016 (see essay on Surface Air Temperature). Both Winter and Fall 2016 represent similar extreme temperature conditions tied to an increased interaction between mid-latitude weather and new changes in the Arctic. For Winter 2016 we speculated that this was primarily a random weather event of the tropospheric polar vortex, but the repeat of the pattern in Fall 2016 suggests more complicated interactions.
Surface Ocean Temperature (M.-L. Timmermans, Yale University)
Mean sea surface temperatures (SST) in September 2016 in ice-free regions ranged from ~0° C just south of the marginal ice zone to around +7° C in the southern Chukchi Sea, and up to +10° C in the Barents Sea (Fig. A3a). A similar pattern, although about 1° C cooler in general, was observed for October 2016 mean SST (Fig. A3b).
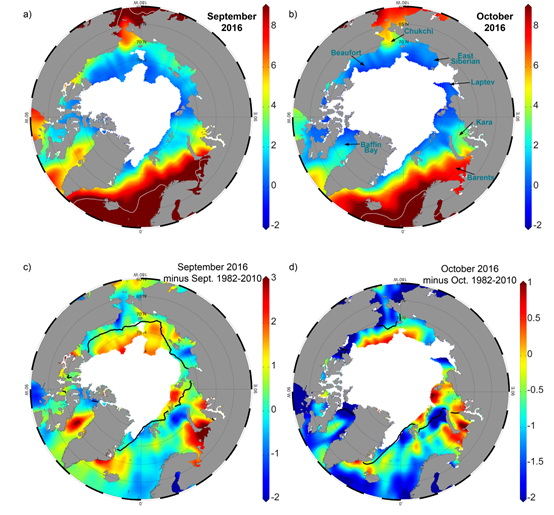
Anomalously warm SSTs in September 2016 compared to the 1982-2010 September mean (Fig. A3c) were largely confined to regions that were ice-covered in the long-term mean, relative to ice-free regions in September 2016. In these regions near the marginal ice zone (i.e. near the edge of the sea ice cover), values were up to +2° C warmer in September 2016 compared to the September 1982-2010 mean. In addition to these regions, SSTs in the Barents Sea were up to +2° C warmer in September 2016 compared to the September 1982-2010 mean, and also warmer in Baffin Bay, and off the east coast of Greenland (Fig. A3c).
A similar pattern persists for October 2016 SST anomalies compared to the 1982-2010 October mean (Fig. A3d) with anomalously warm temperatures generally just to the south of the October 2016 ice edge; regions that were ice covered in the October 1982-2010 mean. In addition to these regions, SSTs in the Barents and Kara seas were up to +1° C warmer in October 2016 compared to the October 1982-2010 mean (Fig. A3d).
Sea Ice (D. Perovich, CRREL)
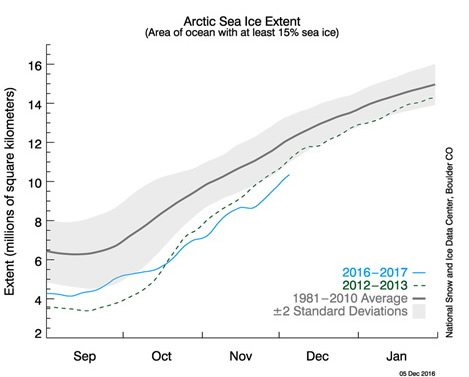
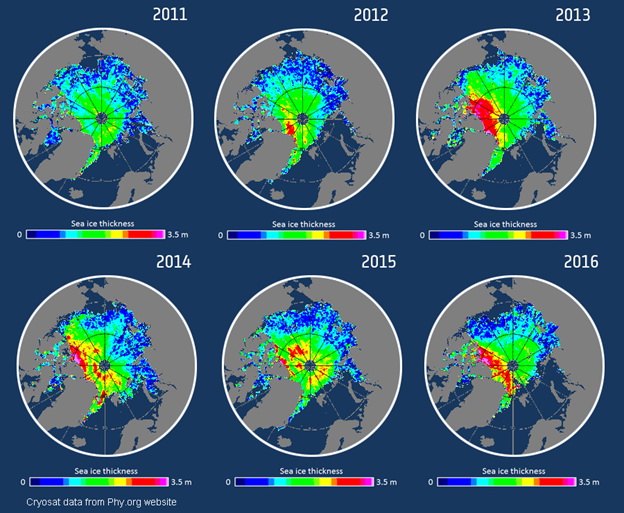
After an early rapid freeze-up in late September, there was a remarkably slow increase in ice extent during the Fall 2016 (Fig. A4). From mid-October to late-November, the ice extent has been the lowest observed since the beginning of the satellite record in 1979. The October 2016 ice extent was 2.55 million km2 (28%) less than the long term October value, averaged from 1981 to 2010. In November 2016, the ice extent was 1.95 million km2 (18%) below the 1981 to 2010 average. The ice extent remained well below average into November in the Bering Strait, Chukchi, Barents and Kara Seas, and along Greenland’s eastern coast. Results from ESA’s CryoSat indicate a low ice volume for November 2016, as well. The low volume is a direct consequence of the reduced ice extent, as the ice that is present is of greater than average thickness (Fig. A5).
Terrestrial Snow Cover (C. Derksen, ECCC)
The warm temperature anomalies over the central Arctic in October and November 2016 (Fig. 1A), associated with the new record lows for Arctic sea ice extent (Fig. A4), did not extend over Arctic and subarctic land areas. Instead, October 2016 surface temperatures over Eurasian Arctic land areas were near normal, a zone of well below average temperatures extended across the Eurasian subarctic and mid-latitude regions, and a region of colder than normal temperatures was over northwestern Canada (Fig A6a). This resulted in more extensive than normal snow cover extent over Eurasia and Canada (Fig. A6c). Colder than normal surface temperatures continued to extend over much of Eurasia in November 2016 (Fig. A6b), which allowed the above normal snow extent established in October to persist in this region (Fig. A6d). Air temperatures anomalies over North America were positive in November (Fig. A6c), so the above average snow extent observed in October transitioned to largely negative anomalies (Fig. A6d). Time series of October and November northern hemisphere snow extent from the NOAA snow chart climate data record showed October and November 2016 to have the third and fourth highest monthly values respectively, in the record (which dates back to 1967).
Greenland Ice Sheet (M. Tedesco, LDEO)
Air temperature anomalies over the Greenland ice sheet during Fall 2016 were above the 1981-2010 mean by up to +5-6° C in the northeast and up to +1-3° C in the southern portion of the ice sheet (Fig. A1). However, these surface temperatures remained below the melting point and no surface melting was detected during fall. No update for the GRACE data set is available, and estimates of total mass changes during Fall 2016 will be available in April 2017.
December 9, 2016