
T. Schuur1, G. Hugelius2
1Center for Ecosystem Science and Society, Northern Arizona University, Flagstaff, AZ
2Department of Physical Geography, Stockholm University, 10691, Stockholm, Sweden
Highlights
- Northern permafrost zone soils contain 1330-1580 billion tons organic carbon, about twice as much as currently contained in the atmosphere.
- Warming conditions promote microbial conversion of permafrost carbon into the greenhouse gases carbon dioxide and methane that are released to the atmosphere in an accelerating feedback to climate change.
- Tundra ecosystems are taking up increasingly more carbon during the growing season over the past several decades, but this has been offset by increasing carbon loss during the winter. Overall, tundra appears to be releasing net carbon to the atmosphere.
Introduction
The Arctic continues to warm at a rate that is currently twice as fast as the global average (see essay on Surface Air Temperature). Warming is causing normally frozen ground (permafrost) to thaw, exposing significant quantities of organic soil carbon to decomposition by soil microbes (Romanovsky et al. 2010, Romanovsky et al. 2012). This permafrost carbon is the remnants of plants, animals, and microbes accumulated in frozen soil over hundreds to thousands of years (Schuur et al. 2008). The northern permafrost zone holds twice as much carbon as currently in the atmosphere (Schuur et al. 2015, Hugelius et al. 2014, Tarnocai et al. 2009, Zimov et al. 2006). Release of just a fraction of this frozen carbon pool, as the greenhouse gases carbon dioxide and methane, into the atmosphere would dramatically increase the rate of future global climate warming (Schuur et al. 2013).
This report details recent advances in quantifying the amount of organic carbon stored in permafrost zone soils and recent trends (1970-2010) in the exchange of carbon between tundra ecosystems and the atmosphere. These data are the most recent comprehensive data synthesis across individual sites.
Permafrost Carbon Pools: How Much Permafrost Carbon Is Available to Release Into the Atmosphere?
Northern soils were known by scientists for decades to have relatively large amounts of carbon, accumulating in frozen and waterlogged soils (Gorham 1991). But it was only about a decade ago when attention by the science community became focused on carbon stored deeper in permafrost soils (Zimov et al. 2006), below the traditional 1-meter accounting depth. Soil carbon originates from organisms living at the surface and so organic carbon becomes increasingly scarce with depth. But soils in the northern permafrost zone have unique characteristics that can cause an accumulation of deep carbon. These characteristics include: vertical mixing due to the freeze-thaw cycle, peat accumulation as a result of waterlogged conditions, and deposits of wind and water-moved silt (yedoma) tens of meters thick, (Gorham 1991, Schirrmeister et al. 2002, Bockheim et al. 2007, Schuur et al. 2008).
The latest circumpolar inventory represents a synthesis of measurements from hundreds of individual study sites that now includes an order of magnitude more data for deep soils (>1m). This comprehensive inventory places the amount of organic carbon stored in the northern permafrost region at 1,330-1,580 billion tons carbon, almost twice as much carbon as currently contained in the atmosphere (Fig. 9.1) (Schuur et al. 2015, Hugelius et al. 2014). Of this amount, 800-1000 billion tons is perennially frozen, with the remainder contained in seasonally thawed soils. Considering just the upper 3 m of northern permafrost zone soils, the amount of carbon is equal to 50% of the quantity of soil carbon to this depth found in ecosystems everywhere else, even though this northern region represents only 15% of the global soil area (Fig.9. 1a) (Schuur et al., 2015).

The inventory also shows substantial permafrost carbon below 3 m depth. Deep carbon has been best quantified for the yedoma region of Siberia and Alaska, characterized by permafrost silt sediments tens of meters thick (Fig. 9.1b). The yedoma region covers a 1.4×10⁶ km2 area that remained ice-free during the last Ice Age (Strauss et al. 2014). The carbon inventory of this region comprises yedoma soils that were previously thawed as lakes formed and then refrozen into permafrost when lakes drained, interspersed by intact permafrost yedoma deposits that were unaffected by thaw-lake cycles (Anthony et al. 2014).
The improved inventory also highlighted additional carbon stocks that are likely to be present but are so poorly quantified that they cannot yet be added into the number reported above. There are deep soil/sediment deposits outside of the yedoma region with such limited quantification, all we can do at this point is to suggest that about 400 billion tons of additional carbon may be preserved there with unknown susceptibility to current climate change. An additional pool is organic carbon remaining in permafrost but that is now submerged on shallow Arctic sea shelves that were formerly exposed as terrestrial ecosystems during the Last Glacial Maximum ~20,000 years ago (Walter et al. 2007) (subsea area not shown in Fig. 9.1 map). This permafrost is slowly degrading due to seawater intrusion, and it is not clear what amounts of permafrost and organic carbon still remain in the sediment versus what has already been converted to greenhouse gases.
Tundra Carbon Exchange: How Fast Can This Carbon Release Occur?
Permafrost thaw and increased microbial decomposition releases stored organic carbon from the terrestrial biosphere into the atmosphere as greenhouse gases. At the same time, plant growth sequesters atmospheric carbon, which becomes stored as new plant biomass or deposited as new soil organic matter. Climate warming can stimulate both processes, and whether Arctic ecosystems are currently a net carbon source (losses > gains) or sink (gains > losses) is an area of intense research. Ecosystem carbon balance is the relatively small difference between two large, opposing fluxes: plant carbon uptake via plant photosynthesis and growth, versus respiratory loss via metabolism by all living organisms. Across the landscape, this biological carbon cycle is then modified by physical disturbance processes such as fire, and abrupt permafrost thaw (thermokarst) that accelerate carbon losses while modifying rates of carbon gain. Disturbances that cause rapid carbon loss on a fraction of the landscape in any given year will accelerate change relative to that directly caused by changing climate alone.
Northern tundra ecosystems typically gain carbon (carbon sink) stored in plant biomass and new soil organic matter during the short summer growing season when plant photosynthesis and growth is greater than carbon respired by plants and soil back to the atmosphere. One of the most recent analyses of measurements of tundra ecosystem carbon exchange (not including high-latitude forests, fens, bogs, and mires) over the past several decades is available in Belshe et al., 2013. Belshe et al. show that the amount of carbon gain during the growing season has been increasing over time (Fig. 9.2). There are also more observations accumulating during this time, especially since the 1990s. Plant growth can be stimulated by warmer conditions, increased atmospheric carbon dioxide, and increased soil nutrients. Patterns of ecosystem-atmosphere carbon dioxide exchange are consistent with other observations of tundra greening and shrub expansion by satellites and aerial photography (Sturm 2001, Myers-Smith 2011) (see essay on Tundra Greenness).
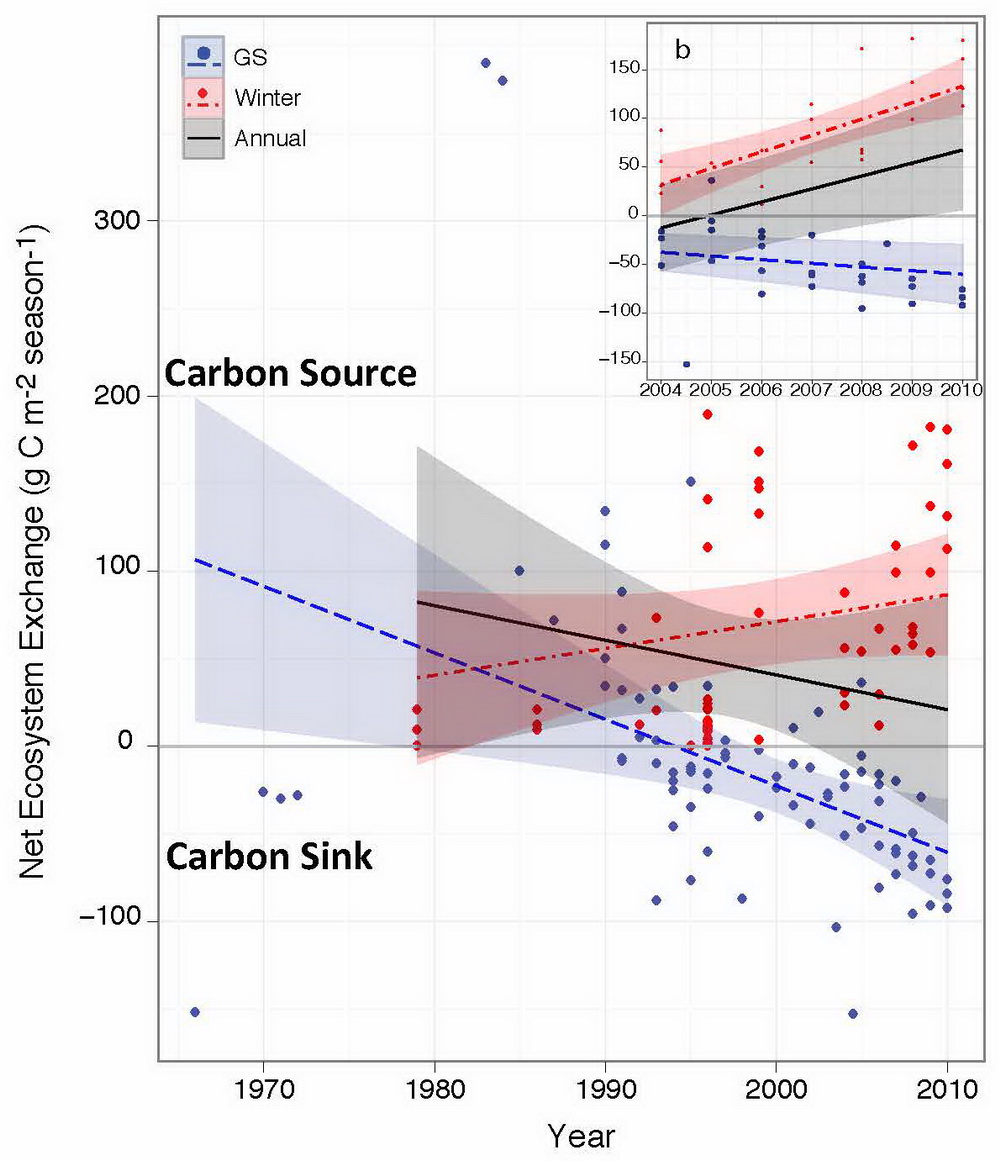
Net carbon uptake during the growing season (June-August) is offset, at least in part, by net carbon releases during the winter (Oct-April), when carbon loss via respiration is greater than plant carbon gain (Fig. 9.2). Even though carbon exchange rates are generally low in the winter, the long winter season can contribute ~10-30% of annual respiration and in some cases can tip the balance between carbon sink and carbon source, when there is a net loss to the atmosphere. Observations of winter carbon exchange are more limited than those made during the summer but carbon release in the winter appears to be increasing over the past several decades (Fig. 9.2).
Summing together growing season and winter shows that tundra was acting as a carbon source on an annual basis over the decade of the 1990s into the early 2000s. Increased summer uptake may have shifted tundra towards carbon neutrality by mid-2000s (neither sink nor source; i.e. confidence intervals include zero line), but this trend is sensitive to the limited availability of winter data. As an example of this, an analysis of only the most recent time period (2004-2010) where winter flux measurements were more available, shows rapidly increasing winter carbon loss that made tundra ecosystems greater annual carbon sources to the atmosphere in the mid-late 2000s (Fig. 9.2, inset). The fact that the annual trend reverses when considering only the shorter, but more robust, winter dataset from 2004-2010 highlights the critical need for expanded winter carbon flux observations.
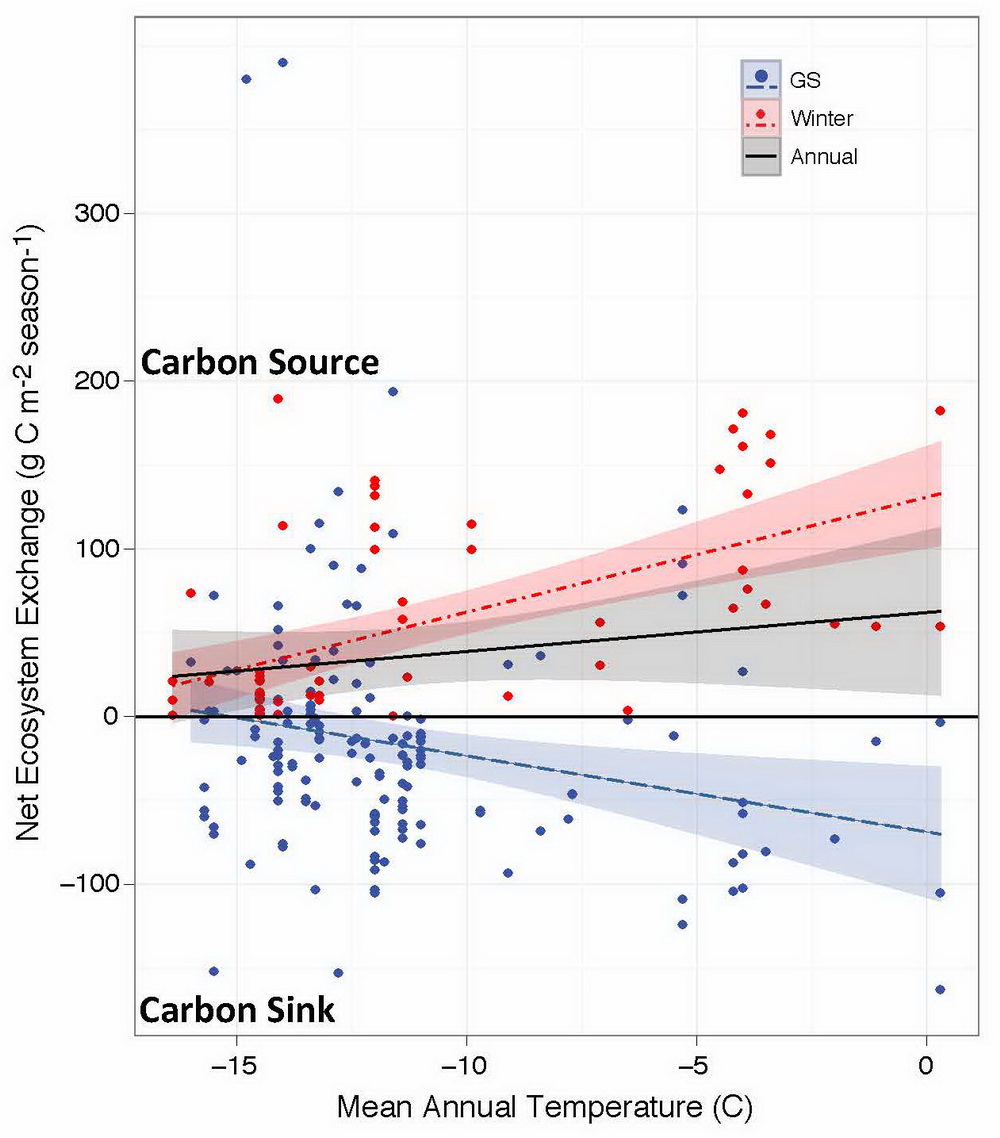
The exact same full dataset from 1970-2010 plotted versus the mean annual temperature of the study sites (rather than year of measurement) more clearly points towards tundra ecosystems acting as carbon sources during the last several decades of measurements, since the mean annual trend line with error estimate are well above the carbon neutral zero line (Fig. 9.3). This analysis suggests that both growing season net carbon uptake and winter net carbon loss increase with warmer mean annual climatic conditions, while the overall magnitude of carbon loss (source strength) increases as well. This pattern suggests that increased Arctic warming could further stimulate tundra to lose carbon at higher rates than observed currently, even in spite of further plant carbon uptake and greening.
It is important to acknowledge that tundra ecosystem results may be influenced by where and when data have been collected, and how methodologies have changed over time. For instance, McGuire et al. (2012) conducted a related analysis of flux studies, with many studies overlapping those used in Belshe (2013) but also including wetlands. When separated into wet and dry tundra types, McGuire et al. showed mean dry tundra as an annual carbon source (though it could not be distinguished from carbon neutral), whereas mean wet tundra was an annual carbon sink.
References
Anthony, K. M. W. et al. A shift of thermokarst lakes from carbon sources to sinks during the Holocene epoch. Nature 511, 452, doi: 10.1038/Nature13560 (2014).
Belshe, F., E. A. G. Schuur, and B.M. Bolker. 2013. Tundra ecosystems observed to be carbon dioxide sources due to differential amplification of the carbon cycle. Ecology Letters doi: 10.1111/ele.12164.
Bockheim, J. 2007. Importance of cryoturbation in redistributing organic carbon in permafrost-affected soils. Soil Science Society of America Journal 71: 1335-1342.
Gorham, E. Northern peatlands: role in the carbon cycle and probable responses to climatic warming. Ecological Applications 1, 182-195 (1991).
Hugelius, G. et al. Improved estimates show large circumpolar stocks of permafrost carbon while quantifying substantial uncertainty ranges and identifying remaining data gaps. 11, 4771-4822 (2014).
Köchy M., Hiederer R., Freibauer A. 2015. Global distribution of soil organic carbon – Part 1: Masses and frequency distributions of SOC stocks for the tropics, permafrost regions, wetlands, and the world. SOIL 1, 351-365. doi:10.5194/soil-1-351-2015.
McGuire, A. D., T. R. Christensen, D. Hayes, A. Heroult, E. Euskirchen, J. S. Kimball, C. Koven, P. Lafleur, P. A. Miller, W. Oechel, P.Peylin, M. Williams and Y. Yi (2012) An assessment of the carbon balance of Arctic tundra: comparisons among observations, process models, and atmospheric inversions, Biogeosciences, 9, 3185-3204, doi:10.5194/bg-9-3185-2012.
Meyers-Smith, I. et al. 2011. Shrub expansions in tundra ecosystems: dynamics, impacts, and research priorities. Environmental Research Letters vol 4, no. 4.
Romanovsky, V., Smith, S. & Christiansen, H. Permafrost Thermal State in the Polar Northern Hemisphere during the International Polar Year 2007-2009: a Synthesis. Permafrost and Periglacial Processes 21, 106-116, doi:10.1002/ppp.689 (2010).
Romanovsky, V. E. et al. Permafrost [in Arctic Report Card 2012], <ftp://ftp.oar.noaa.gov/arctic/documents/ArcticReportCard_full_report2012.pdf>.
Schirrmeister, L., Siegert, C., Kunitzky, V. V., Grootes, P. M. & Erlenkeuser, H. Late Quaternary ice-rich permafrost sequences as a paleoenvironmental archive for the Laptev Sea Region in northern Siberia. Int J Earth Sci 91, 154-167 (2002).
Schuur, E. A. G. et al. Vulnerability of permafrost carbon to climate change: Implications for the global carbon cycle. Bioscience 58, 701-714 (2008).
Schuur, E. A. G. et al. Expert assessment of vulnerability of permafrost carbon to climate change. Climatic Change 119, 359-374, doi:10.1007/s10584-013-0730-7 (2013).
Schuur, E. A. G. et al. Climate change and the permafrost carbon feedback. Nature 520, 171-179, doi:10.1038/nature14338 (2015).
Strauss, J., L. Schirrmeister, G. Grosse, S. Wetterich, M. Ulrich, U. Herzschuh et al. 2013. The Deep Permafrost Carbon Pool of the Yedoma Region in Siberia and Alaska. Geophysical Research Letters 40, 6165-6170.
Sturm, M. C. Racine, K. Tape. Climate change: increased shrub abundance in the Arctic. Nature 411, 546-547 (31 May 2001) | doi:10.1038/35079180.
Tarnocai, C., Canadell, J. G., Mazhitova, G., Schuur, E. A. G. & Kuhry, P. Soil organic carbon pools in the northern circumpolar permafrost region. Global Biogeochemical Cycles 23 (2009).
Walter, K. M., Edwards, M. E., Grosse, G., Zimov, S. A. & Chapin, F. S. Thermokarst lakes as a source of atmospheric CH4 during the last deglaciation. Science 318, 633-636 (2007).
Zimov, S. A. et al. Permafrost carbon: Stock and decomposability of a globally significant carbon pool. Geophysical Research Letters 33 (2006).
November 15, 2016