
M. -L. Timmermans1 and C. Ladd2
1Yale University, New Haven, CT, USA
2Pacific Marine Environmental Laboratory, NOAA, Seattle, WA, USA
Highlights
- August mean sea surface temperatures (SSTs) in 2019 were ~1-7°C warmer than the 1982-2010 August mean in the Beaufort, Chukchi, and Laptev Seas and Baffin Bay, and ~0.5-2°C cooler in the Barents Sea region.
- August mean SSTs show statistically significant warming trends for 1982-2019 in most regions of the Arctic Ocean that are ice-free in August.
- Northern Barents Sea August mean SSTs show statistically significant cooling trends for 1982-2019.
Summer sea surface temperatures (SST) in the Arctic Ocean are driven mainly by the amount of incoming solar radiation absorbed by the sea surface. Solar warming of the Arctic surface ocean is influenced by the distribution of sea ice (with greater warming occurring in ice-free regions), cloud cover, ocean optical properties, and upper-ocean stratification. In the Barents and Chukchi Seas, there is an additional source of ocean heat contributed by the advection of warm water from the North Atlantic and North Pacific Oceans, respectively. Arctic SSTs are an essential indicator of the role of the ice-albedo feedback mechanism in any given summer melt season. As the area of sea-ice cover decreases, more incoming solar radiation is absorbed by the ocean and, in turn, the warmer ocean melts more sea ice. In addition, marine ecosystems are influenced by SST, which affects the timing and development of primary and secondary production cycles as well as available habitat for individual species (see essay Arctic Ocean Primary Productivity).
SST data presented here are from the NOAA Optimum Interpolation (OI) SST Version 2 product (OISSTv2), which is a blend of in situ and satellite measurements from December 1981 to present (Reynolds et al. 2002, 2007). Compared to purely in situ temperature measurements, the OISSTv2 product has explained about 80% of the variance, with an overall tendency to underestimate SST by -0.02°C, i.e., a cold bias (Stroh et al. 2015). The OISSTv2 product uses a linear relationship with sea-ice concentration to infer SST, with SST constrained to -1.8°C (the freezing point of seawater with a salinity of 33 PSU at the sea surface) where ice cover is 100% (Reynolds et al. 2007). Variations in freezing temperature as a result of variations in sea-surface salinity (not accounted for in the algorithm) imply that SSTs under sea ice can be too cool by up to 0.2°C, with the highest errors in the fresher surface waters of the Canada Basin (see Timmermans and Proshutinsky 2015). August mean SSTs provide the most appropriate representation of Arctic Ocean summer SSTs because they are not affected by the cooling and subsequent sea-ice growth that typically takes place in the latter half of September. The period 1982-2010 is taken as a climatological reference mean.
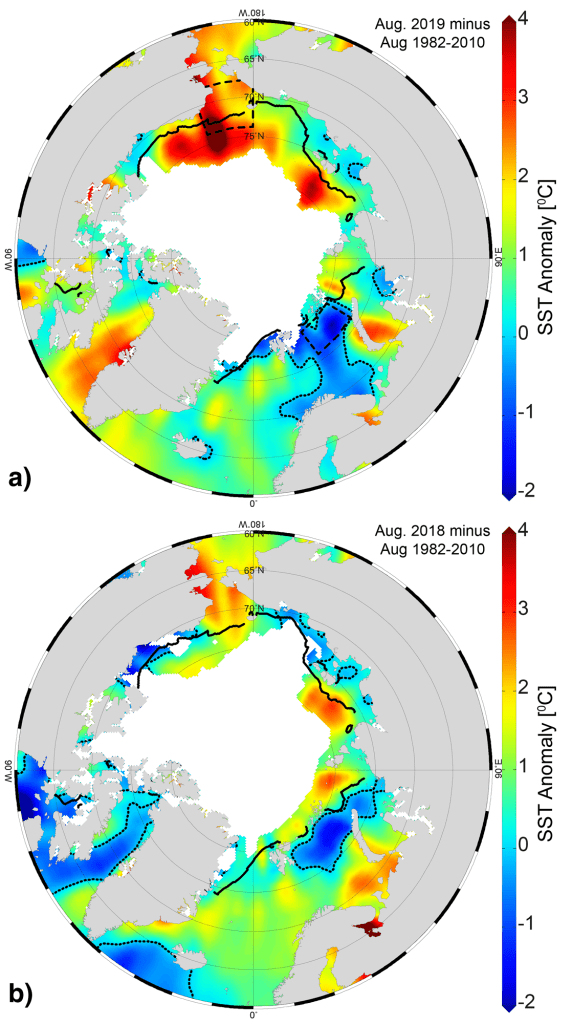
August 2019 mean SSTs ranged from 8 to 9°C in the southern Chukchi and Barents Seas to approximately 1°C in the interior Arctic Ocean near the mean sea-ice edge for that month (Fig. 1). August 2019 mean SSTs were around 1-7°C warmer than the 1982-2010 August mean in the Beaufort, Chukchi, and Laptev Seas and Baffin Bay (Fig. 2a). The anomalously warm SSTs in the vicinity of the August 2019 mean sea-ice edge are linked to anomalously low sea-ice extent, which allowed for direct solar heating of the exposed surface waters (Fig. 2a). Conversely, the entire Barents Sea region was marked by anomalously cool August 2019 SSTs around 0.5-2°C cooler than the 1982-2010 mean. The interplay between sea-ice cover, solar absorption, and lateral ocean heat transport that results in cooler August SSTs in the Barents Sea region requires further study. Relative to August 2018, August 2019 exhibited SSTs up to 4°C warmer in the Beaufort Sea and Baffin Bay, while SSTs were a few degrees cooler in the Barents Sea in August 2019 compared to August 2018 (Fig. 2b).

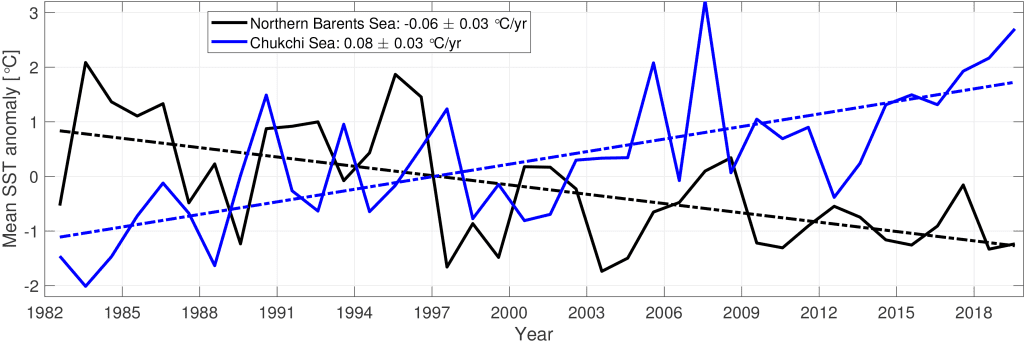
Mean August SSTs from 1982 to 2019 show warming trends over much of the Arctic Ocean, with statistically significant (at the 95% confidence interval) linear warming trends of up to +1°C per decade (Fig. 3). The Chukchi Sea region continues to warm significantly, with August 2019 mean SSTs in the region being the second highest on record (Fig. 4). A marked exception to the prevalent August SST warming trend is the cooling trend (-0.06 ± 0.03°C/yr) in the northern Barents Sea (Fig. 3; Fig. 4). In line with this trend, most of the Barents Sea exhibited August 2019 SSTs around 0.3-2°C cooler than the 1982-2010 average (Fig. 2a) and parts of the southern Barents Sea were a few degrees cooler than in August 2018 (Fig. 2). The statistically significant northern Barents Sea cooling trend is not observed in all months; annually-averaged northern Barents Sea SSTs exhibit a warming trend, which has been attributed to changes in Atlantic Water influence in the region (see e.g., Barton et al. 2018).

References
Barton, B. I., Y. Lenn, and C. Lique, 2018: Observed Atlantification of the Barents Sea causes the Polar Front to limit the expansion of winter sea ice. J. Phys. Oceanogr., 48, 1849-1866, https://doi.org/10.1175/JPO-D-18-0003.1.
Fetterer, F., K. Knowles, W. N. Meier, M. Savoie, and A. K. Windnagel, 2017 (updated daily): Sea Ice Index, Version 3: Regional Daily Data. National Snow and Ice Data Center (NSIDC), Boulder, CO, USA, https://doi.org/10.7265/N5K072F8.
Reynolds, R. W., N. A. Rayner, T. M. Smith, D. C. Stokes, and W. Wang, 2002: An improved in situ and satellite SST analysis for climate. J. Climate, 15, 1609-1625.
Reynolds, R. W., T. M. Smith, C. Liu, D. B. Chelton, K. S. Casey, and M. G. Schlax, 2007: Daily high-resolution-blended analyses for sea surface temperature. J. Climate, 20, 5473-5496, and see http://www.esrl.noaa.gov/psd/data/gridded/data.noaa.oisst.v2.html.
Stroh, J. N., G. Panteleev, S. Kirillov, M. Makhotin, and N. Shakhova, 2015: Sea-surface temperature and salinity product comparison against external in situ data in the Arctic Ocean. J. Geophys. Res. Oceans, 120, 7223-7236, https://doi.org/0.1002/2015JC011005.
Timmermans, M. -L., and A. Proshutinsky, 2015. The Arctic: Sea surface temperature [in “State of the Climate in 2014”]. Bull. Amer. Meteor. Soc., 96(7), S147-S148.
November 19, 2019